Forex Volume MT5
- インディケータ
- KEENBASE SOFTWARE SOLUTIONS
- バージョン: 1.2
- アップデート済み: 8 4月 2022
- アクティベーション: 5
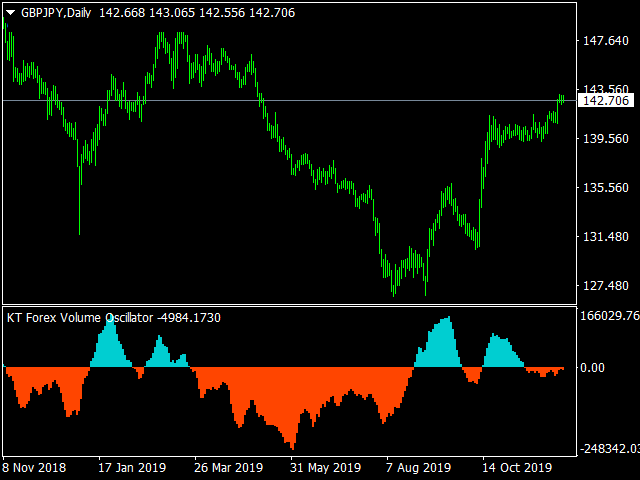
KT Forex Volume shows the buying and selling volume of a currency pair in the form of a colored histogram. The volume is made of buying and selling transactions in an asset.
In FX market:
- If the buying volume gets bigger than the selling volume, the price of a currency pair would go up.
- If the selling volume gets bigger than the buying volume, the price of a currency pair would go down.
Features
- Avoid the bad trades by confirming them using the tick volume data.
- It helps you to stay on the side of big players.
- All Metatrader alerts are included.
Using the Tick Volume
Unlike other markets, the spot Forex market is not centralized; hence, getting the real and accurate volume data is very difficult for the retail traders.
Caspar Marney a veteran forex trader submitted a research paper in 2011, concluded a high level of accuracy and correlation between the tick volume and actual traded volume.
Histogram Formula
The KT Forex volume indicator is derived using the Chaikin oscillator. The Chaikin oscillator was developed by Marc Chaikin. It is calculated by measuring the accumulation distribution of fast and slow moving average.
N = [(Close-Low) - (High-Close)]/High-Low
M = N * Volume(Period)
ADL = M(Period−1)+M(Period)
CO = (Fast EMA of ADL)−(Slow EMA of ADL)
Where:
N = Money flow multiplier
M = Money flow volume
ADL = Accumulation distribution line
CO = Chaikin oscillator


