Pivot Types with Levels MTF MT5
- インディケータ
- John Louis Fernando Diamante
- バージョン: 1.0
- アクティベーション: 5
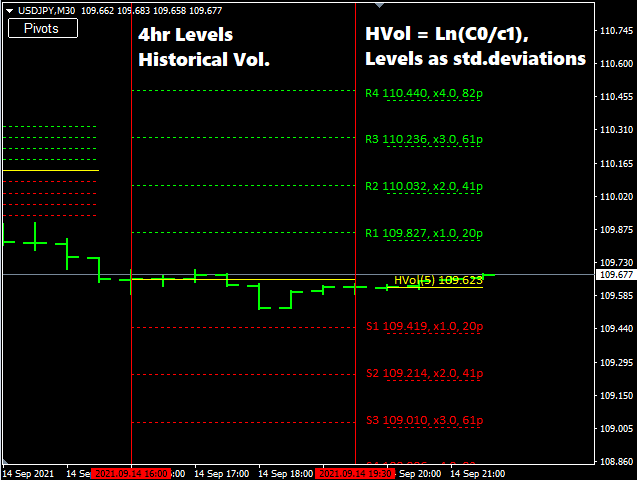
Fully featured Pivots and Levels indicator
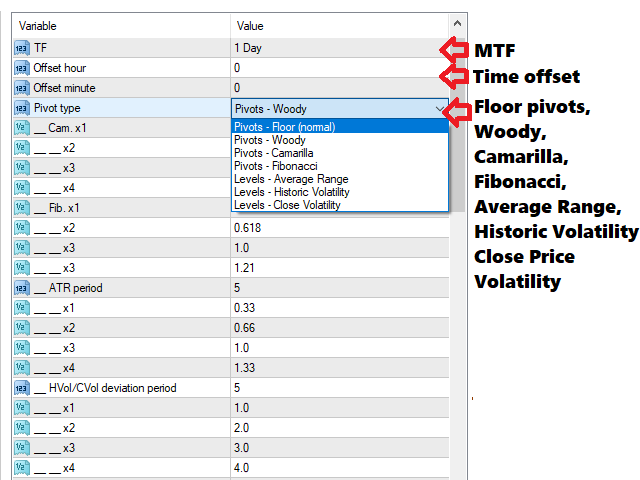
Pivots: Floor (normal), Woody, Camarilla, Fibonacci
Levels: ATR, Historical Volatility with standard deviations, Close Price Volatility with standard deviations
Features:
- 4 +/- levels
- MTF, pivots/levels based on Daily, Weekly, 4hr or even 15min
- Hour and minute time offset
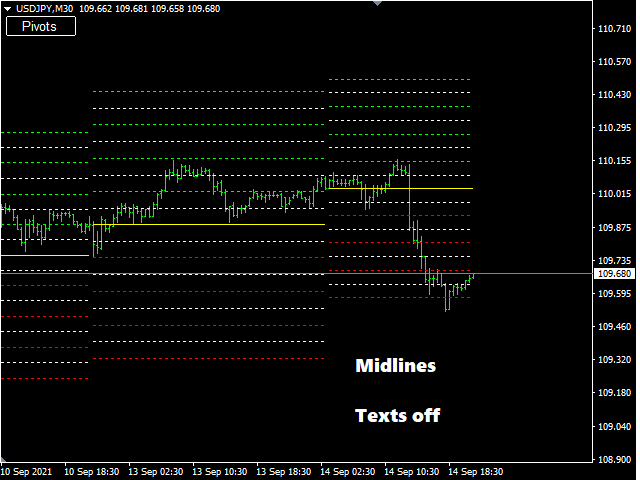
- Texts with prices and pip distances to central pivot/level
- Inputs for Camarilla/Fibonacci/ATR/Volatility levels
- Alerts, popup, push, email, sound, live or completed candles on level crossover
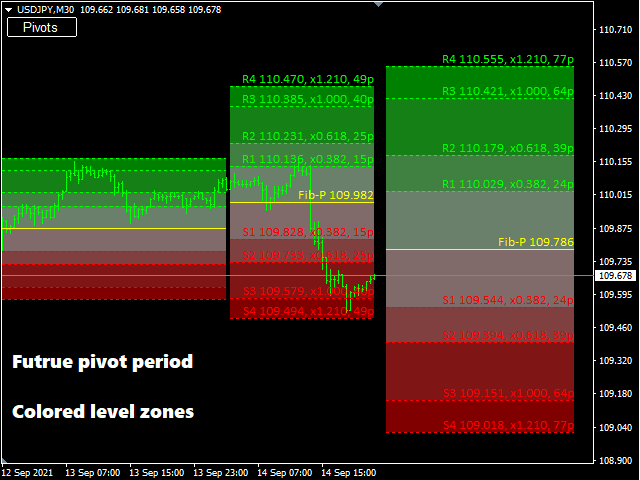
- Colored level zones, with color gradients
- Show/hide button
- Future pivot levels based on live time period
- Saturday/Sunday inclusion, Saturday included as end of week, Sunday included as start of week
Levels Note:
- ATR is taken with MTF data of selected timeframe, and levels as input perentages %.
- Historical volatility is taken as the previous close, +/- input multiples of standard deviation * previous close, based on Log returns: Ln(Close[0]/Close[1])
- Close volatility is taken as the previous close, +/- input multiples of standard deviation, based on Close prices
- If there are any issues or suggestions for the indicator, please comment and let me know. The feedback will be noted and considered in future updates.