Time Session OpenHighLowClose
- インディケータ
- Hiren Parekh
- バージョン: 1.0
Time Session OPEN-HIGH-LOW-CLOSE
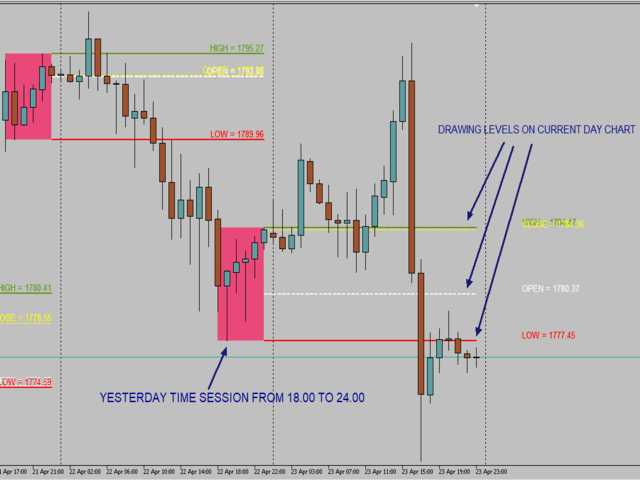
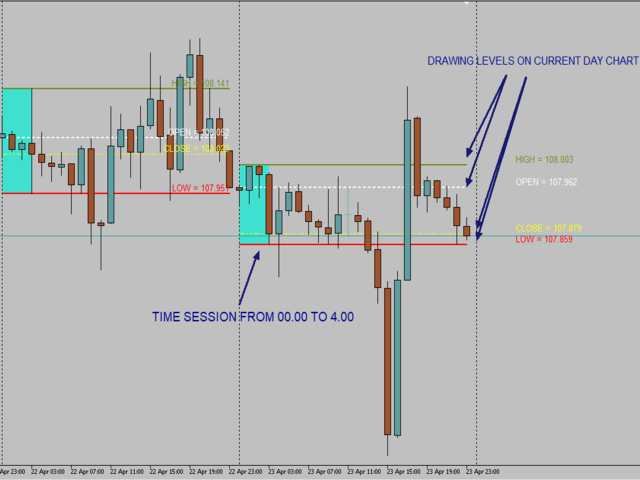
This Indicator Will Draw Lines Of OHLC Levels Of Time Session Defined By User.
It Will Plot Floating Lines On Current Day Chart.
Time Session Can Of Current Day Or Previous Day.
You Can Plot Multiple Session Lines By Giving Unique ID To Each Session.
It Can Even Show Historical Levels Of Time Session Selected By User On Chart To Do Backdating Test.
You Can Write Text To Describe The Lines.


Hola Hiren. En el indicador hay una opción de pivote, pero al marcarlos como verdadero no aparecen. Gracias. Felicitaciones por este indicador. Lo estaba buscando.