Decision Point
- インディケータ
- Zoltan Nemet
- バージョン: 2.2
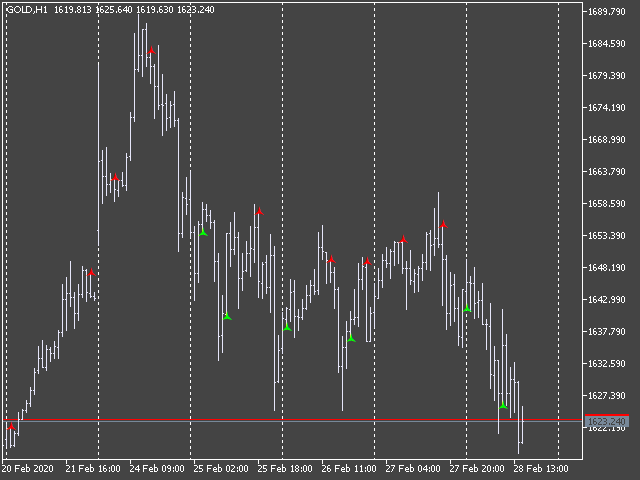
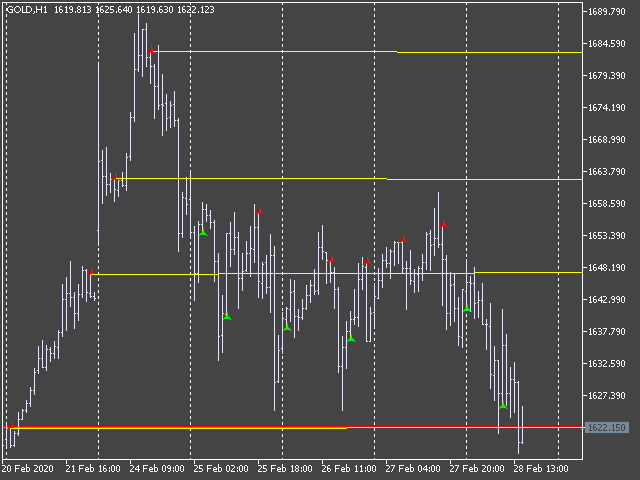
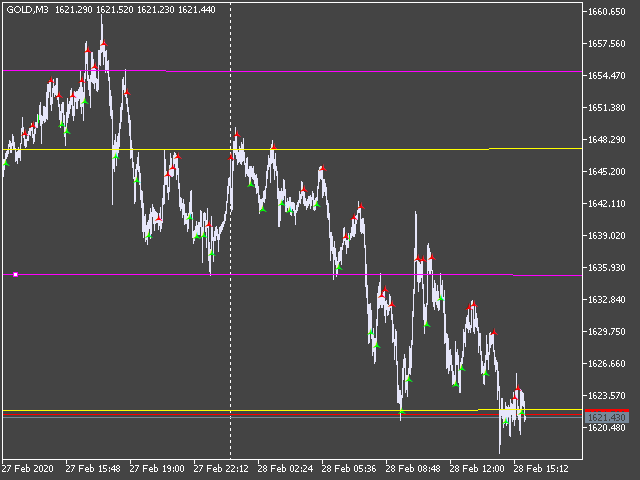
With this indicator user can determine not just pivot like turning points. User able to spot trading ranges boundaries and support-resistance levels.
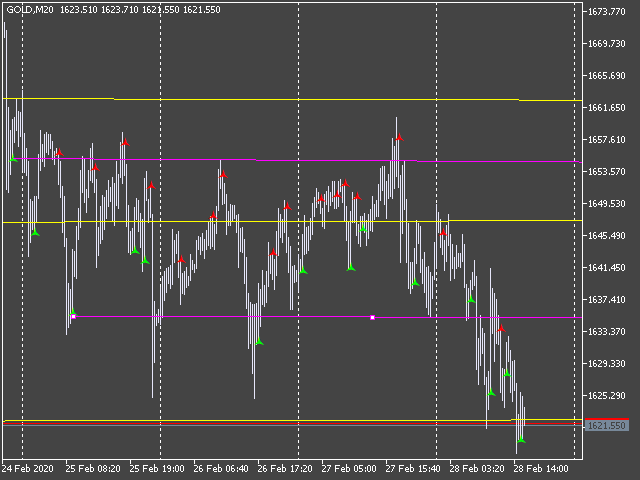
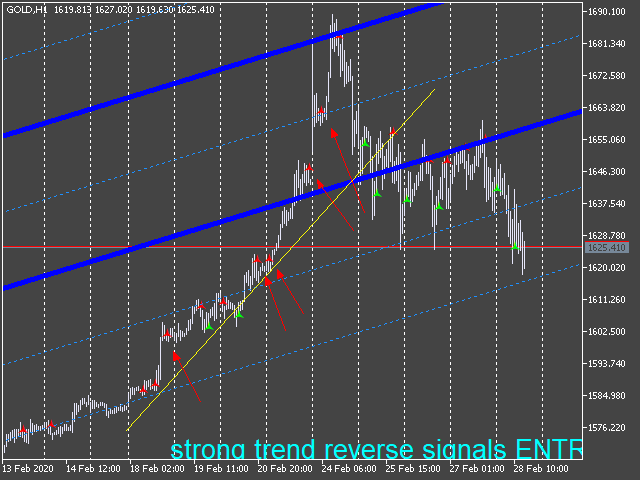
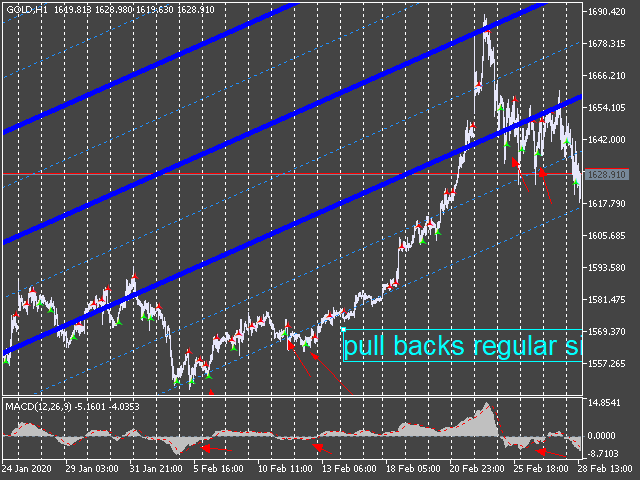
In a strong trend the reverse signals also gives us excellent entry points. Recommended user settings: In the Attis volume: look back period : 1 or (3) MA_Lenght 99.
( of course one can play with the settings and get tailored signals... as you need)
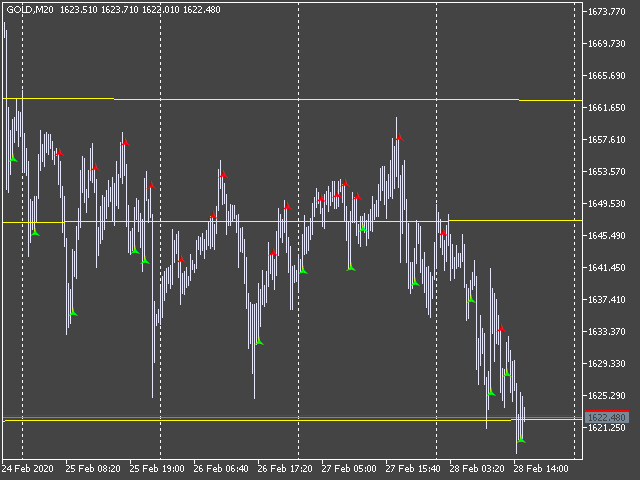
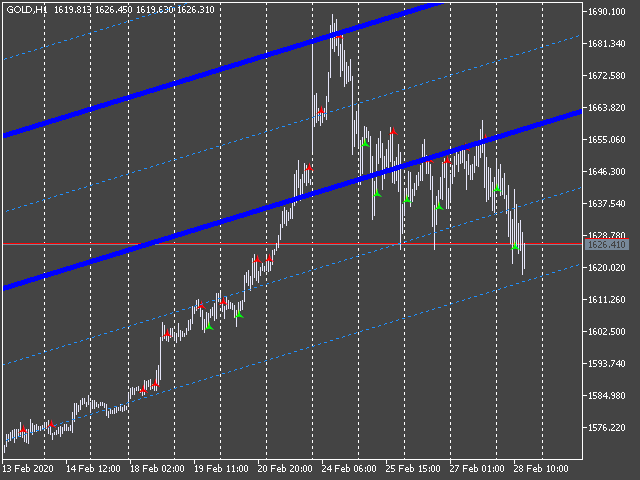


It is a good indicator for determining entry or exit points in a position. I thank the developer for making this tool available.