Deluxe Pivot Point Plotter
- インディケータ
- Olawale Adenagbe
- バージョン: 3.0
- アップデート済み: 24 3月 2020
- アクティベーション: 5
Overview
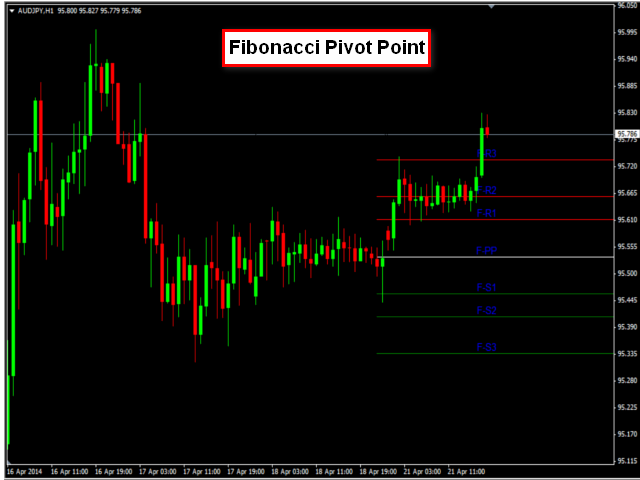
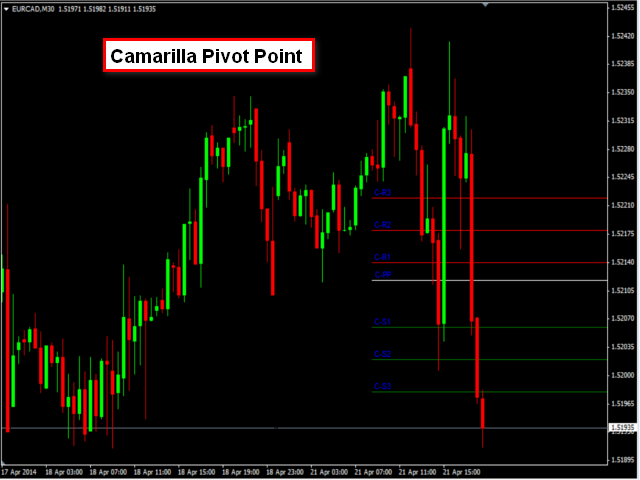
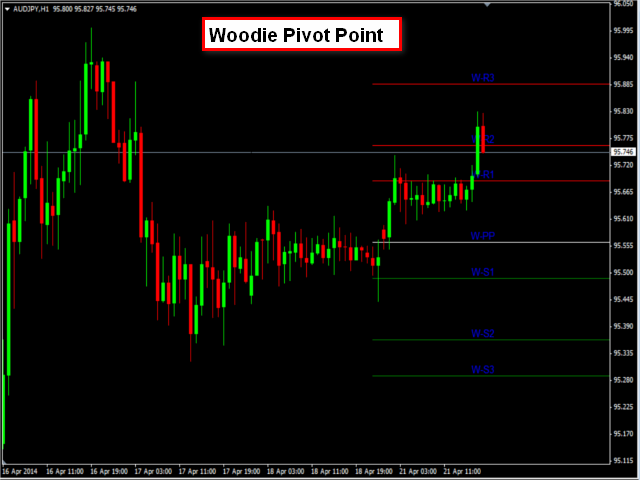
This is the DELUXE version in the Pivot Point Plotter Series. It is a robust indicator that dynamically calculates and plots any of the 4 major pivot points on your chart irrespective of intra day timeframe on which the indicator is placed.This indicator is capable of plotting STANDARD, CAMARILLA, FIBONNACI or WOODIE daily pivot points. Whichever you use in your trading, this indicator is your one-stop shop.
Kindly note that it is a DAILY Pivot Point Plotter for DAY TRADERS who trade on intra day timeframes (i.e. 1MIN, 5MIN, 15MIN, 30MIN, 1H and 4H) on MT4 platform. This indicator is an absolute day trader companion.
Features
- Plots STANDARD, CAMARILLA, FIBONNACI or WOODIE daily pivot points
- Dynamically calculates and plots Daily Pivot Points (Central Pivot Point, R1, R2, R3, S1, S2 and S3)
- Includes option to calculate and plot mid points
- Daily pivot points are plotted irrespective of intraday timeframe on which you trade i.e. 1MIN, 5MIN, 15MIN, 30MIN, 1H and 4H timeframes. Daily pivot points does not change when you change timeframe.
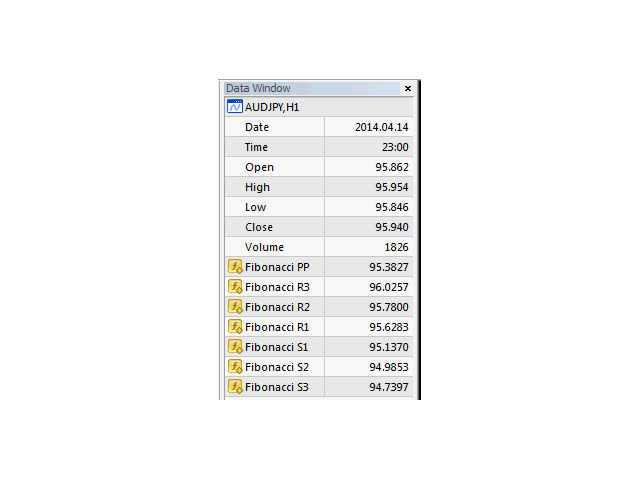
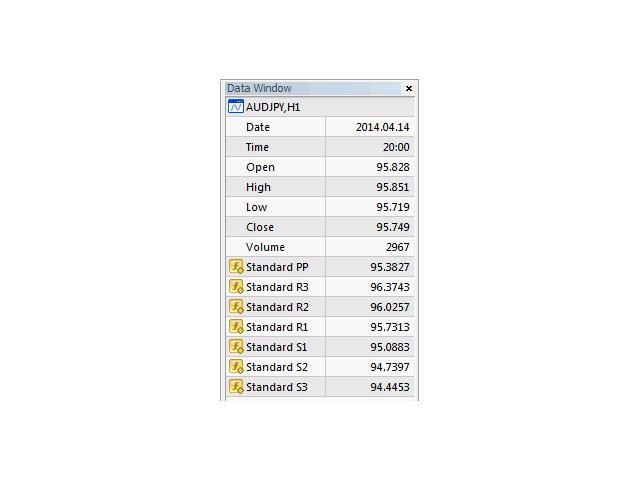
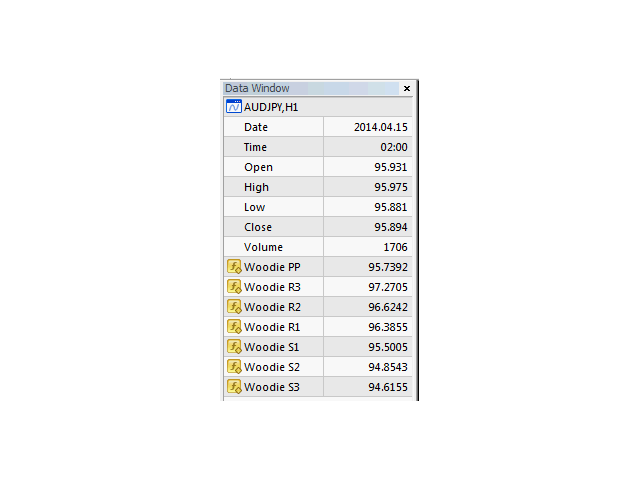
- Values for previous days are contained in the buffer and can be viewed in the data window. This is particularly useful if you want to understand how price behaves around pivot points.
- Fully customizable options (See 'INPUT PARAMETERS' section)
- Can be configured to send daily email of Daily Pivot points
- Can be configured to send daily notification of Daily Pivot points to mobile terminal
- Can be used in EAs using iCustom to get data from the appropriate buffer (see INDICATOR BUFFER' section for details)
Input Parameters
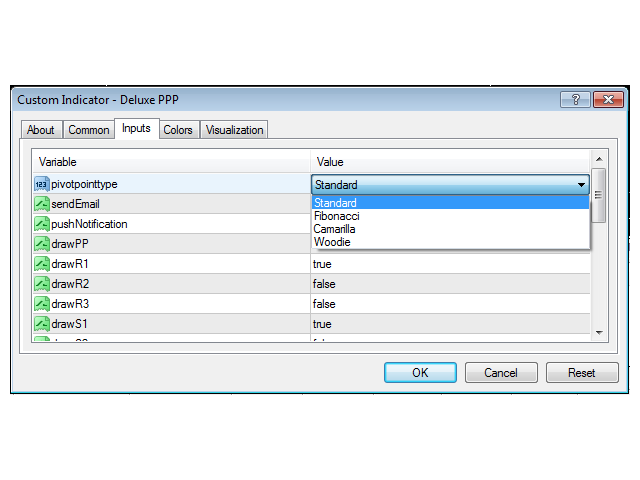
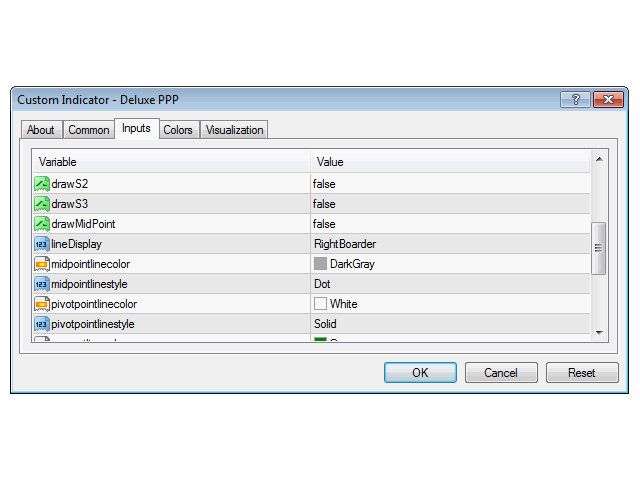
- pivotpointtype - Type of Pivot Point to be drawn
- sendEmail - Send email to email address configured in MetaTrader 4
- pushNotification - Push Notification to mobile terminal
- drawPP - Draw Pivot Point
- drawR1 - Draw Resisitance 1
- drawR2 - Draw Resisitance 2
- drawR3 - Draw Resisitance 3
- drawS1 - Draw Support 1
- drawS2 - Draw Support 2
- drawS3 - Draw Support 3
- drawMidPoint - Draw Mid Points
- lineDisplay - Draw pivot lines on whole chart or on right boarder of chart
- midpointlinecolor - Line color of Mid Points
- midpointlinestyle - Line Style of Mid Points
- pivotpointlinecolor - Line color of Central Pivot Point
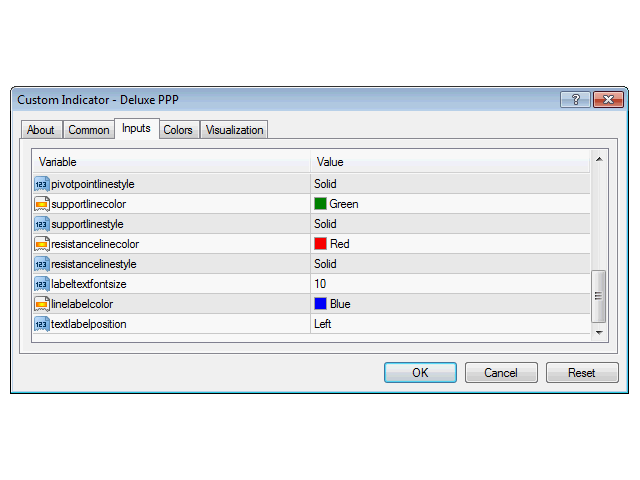
- pivotpointlinestyle - Line style of Central Pivot Point
- supportlinecolor - Line color of Support lines (S1, S2 and S3)
- supportlinestyle - Line style of Support lines (S1, S2 and S3)
- resistancelinecolor - Line color of Resistance lines (R1, R2 and R3)
- resistancelinestyle Line style of Resistance lines (R1, R2 and R3)
- labeltextfontsize - Font Size of Text Label
- linelabelcolor - Color of Text Label
- textlabelposition - Position of the Text Label
Benefits
- Saves time as you never have to manually calculate daily pivots again...NEVER (See how the PPP series can save you money and time in the 'HOW THE PPP SERIES HELP SAVE TIME AND MONEY' section).
- Makes use of data from your broker's platform so you don't need to rely of already calculated pivot points from some websites on the internet whose data might be different from your broker's.
- Fully customizable so that you only display pivot points that you use in your startegy (See 'INPUT PARAMETERS'section for a full list of customizable options).
- Can be used on all instruments on MetaTrader 4.
Indicator Buffers
- Buffer 0 - Central Pivot Point
- Buffer 1 - Resistance 3
- Buffer 2 - Resistance 2
- Buffer 3 - Resistance 1
- Buffer 4 - Support 1
- Buffer 5 - Support 2
- Buffer 6 - Support 3
How the PPP Series Helps Save Time and Money
Let's assume that:
- 5 minutes is spent each day calculating and plotting pivot points on a single chat
- Your 1 hour labour/work is worth $7.25 (Federal Minimum Wage in the United States)
- There are 20 trading days in a month
- Amount of time spent calculating and plotting pivot points in a month = 5 * 20 = 100 min (20 trading days in a month)
- Amount of time spent calculating and plotting pivot points in a year = 100 * 12 (months in a year) = 1200 min
- Convert 1200 min to hours = 1200/60 = 20 hours
- Monetize 20 hours of work = 20 * 7.25 = $145
The analysis above shows that with the most conservative assumptions, you would spend 20 hours yearly calculating and plotting pivot points. The time spent would have amounted to $145 of effort. If you trade 2 pairs, that would be $290 in a year. It would be $435 if you trade 3 currency pairs. Imagine how much it would be if you trade 5 or more currencies.
With the analysis above, you can immediately see how much time and money is spent doing what you consider the simplest thing in the world.
Invest your time wisely in your strategy and let daily pivot do the hard work of calculating and plotting your daily pivot points.
