• 概要
  • レビュー
  • コメント (15)
  • 最新情報

Candlestick Patterns All Pair

Candlestick Patterns All Pair is a simple and convenient indicator of candlestick pattens. It is able to identify 29 candlestick patterns. It displays the latest patterns for all pairs and timeframes.


The considerable advantages of the indicator

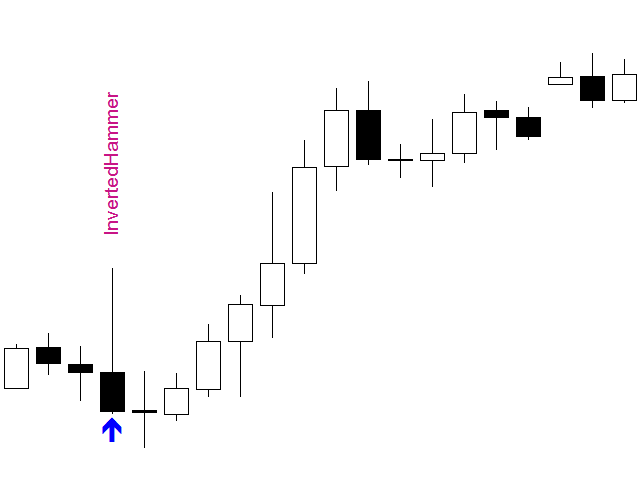
  • It finds and marks 29 candlestick patterns;
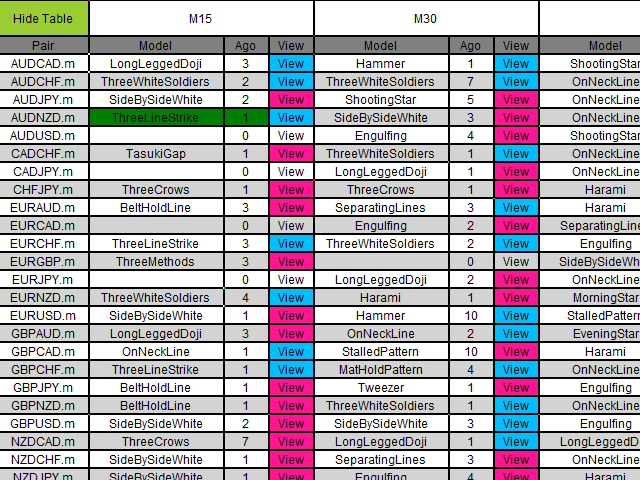
  • Displays a table of the last patterns for the 28 major pairs and each timeframe;
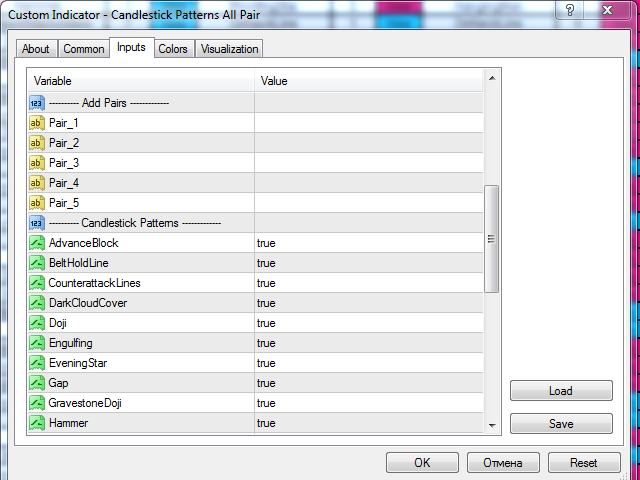
  • It has settings for 5 extra pairs;
  • Indicates the classic trade direction;
  • Each candlestick patterns can be disabled in the settings;
  • The table can be Hidden/Shown in a single click on the chart, which is convenient for viewing the chart.


Parameters

  • Depth - pattern search depth;
  • Up_Color - color of a buy patten in the table;
  • Down_Color - color of the sell pattern in the table;
  • Use_M1 - display М1 in the table;
  • Use_M5 - display М5 in the table;
  • Use_M15 - display М15 in the table;
  • Use_M30 - display М30 in the table;
  • Use_H1 - display H1 in the table;
  • Use_H4 - display H4 in the table;
  • Use_D1 - display D1 in the table;
  • Use_W1 - display W1 in the table;
  • Use_MN1 - display МN1 in the table;
  • TextSizeTable - the size of the text in the table;
  • TextSizeModels - the size of the text on the chart;
  • TextColorModel - the color of the text on the chart;
  • ---------- Add Pairs ------------ -
  • Pair_1 - additional pair;
  • Pair_2 - additional pair;
  • Pair_3 - additional pair;
  • Pair_4 - additional pair;
  • Pair_5 - additional pair;
  • ---------- Candlestick Patterns ------------ -
  • AdvanceBlock - candlestick pattern;
  • BeltHoldLine - candlestick pattern;
  • CounterattackLines - candlestick pattern;
  • DarkCloudCover - candlestick pattern;
  • Doji - candlestick pattern;
  • Engulfing - candlestick pattern;
  • EveningStar - candlestick pattern;
  • Gap - candlestick pattern;
  • GravestoneDoji - candlestick pattern;
  • Hammer - candlestick pattern;
  • HangingMan - candlestick pattern;
  • Harami - candlestick pattern;
  • InvertedHammer - candlestick pattern;
  • LongLeggedDoji - candlestick pattern;
  • MatHoldPattern - candlestick pattern;
  • MorningStar - candlestick pattern;
  • OnNeckLine - candlestick pattern;
  • Piercing - candlestick pattern;
  • SeparatingLines - candlestick pattern;
  • ShootingStar - candlestick pattern;
  • SideBySideWhite - candlestick pattern;
  • StalledPattern - candlestick pattern;
  • TasukiGap - candlestick pattern;
  • ThreeCrows - candlestick pattern;
  • ThreeLineStrike - candlestick pattern;
  • ThreeMethods - candlestick pattern;
  • ThreeWhiteSoldiers - candlestick pattern;
  • Tweezer - candlestick pattern;
  • UpsideGapTwoCrows - candlestick pattern;


Usage

The indicator has been created for quick analysis and navigation in the latest formed candlestick patterns on each pair and timeframe. The table contains the information: name of the pattern (Model), direction (Button color), the number of candles back (Ago). Clicking the "View" button changes the current chart to a chart of the corresponding currency pair and timeframe. The current chart is highlighted in green in the table. Clicking the "Hide Table" button hides the table, freeing the chart scape. Click it again to show the table.

おすすめのプロダクト
Trend indicator with calculation of dynamic levels and signaling their intersection. Description of input parameters: StepTF = true; - Calculation of the indicator by closing the bar (true) or by each tick (false) BarsCount = 300; - Number of settlement bars Price = PRICE_CLOSE; - Type of price used TimeFrame = PERIOD_CURRENT; - Estimated timeframe TrendPeriod = 9; - Trend calculation period TrendDeviations = 4.9; - coefficient of deviation PeriodTrendSmooth = 1; - Trend smoothi
This is a multi timeframe version of the  Supply and Demand indicator . It allows you to analyze a chart using the law of supply and demand on three different timeframes at a time. You will see zones of sales and purchases and determine the most profitable points to open positions. The indicator is based on the principle of market fractality. Supply and demand zones show places where a strong buyer or seller has made the price reverse and change its direction. The indicator has several types of
MT4用FXインジケーター「流れ星パターン」 インジケーター「シューティング スター パターン」は、プライス アクション取引にとって非常に強力なインジケーターです。再描画や遅延はありません。 インジケーターがチャート上で弱気の流れ星パターンを検出: チャート上の赤い矢印シグナル (写真を参照) PC、モバイル、電子メールのアラートが含まれています インジケーター「Shooting Star pattern」はサポート/レジスタンスレベルと組み合わせるのに最適です: https://www.mql5.com/en/market/product/100903 // さらに優れたエキスパートアドバイザーとインジケーターはここから入手できます: https://www.mql5.com/en/users/def1380/seller // また、収益性が高く、安定していて信頼できるシグナル https://www.mql5.com/en/signals/1887493 に参加することも歓迎します。 当MQL5サイトのみでご提供しているオリジナル商品です。
Apollo Supply Demand Zones は、サポートとレジスタンスのレベルを計算する指標です。このインジケーターは、使用する戦略に関係なく、すべてのトレーダーにとって絶対に役立ちます。この指標は、取引システムの主要な要素の 1 つになる可能性があります。このインジケーターは、現在の時間枠でレベルを計算し、MTF モードで動作して、より高い時間枠からのレベルを表示できます。この指標は、任意の時間枠で、任意の取引商品で絶対に使用できます。インジケーターは、実際に市場の全体像を表示するさまざまなタイプのレベルを示します。このインジケーターは音声アラートを提供するため、このインジケーターの操作が非常に 購入後、必ず私に書いてください!インジケーターの使用に関する推奨事項を共有します。あなたを待っている素晴らしいボーナスもあります!
Signal trend indicator. Detects the direction of the trend and is coloured accordingly.  Has built in audible and visual alerts when trends change. Can send notifications to your phone or email. Allows Trend and Counter-Trend trading. Works on all timeframes, all currency pairs, metals, indices and cryptocurrencies. Can be used with binary options. Distinctive features No re-drawing; Simple and clear settings; Four types of alerts; Works on all timeframes and all trading tools; Su
Owl smart levels
Sergey Ermolov
4.63 (54)
MT5版  |   FAQ Owl Smart Levels Indicator   は、 Bill Williams   の高度なフラクタル、市場の正しい波構造を構築する Valable ZigZag、エントリの正確なレベルをマークする Fibonacci レベルなどの一般的な市場分析ツールを含む 1 つのインジケーター内の完全な取引システムです。 利益を得るために市場と場所に。 戦略の詳細な説明 インジケータを操作するための指示 顧問-取引助手 プライベートユーザーチャット ->購入後に私に書いて、私はプライベートチャットにあなたを追加し、あなたはそこにすべてのボーナスをダウンロードすることができます 力はシンプルさにあります! Owl Smart Levels   取引システムは非常に使いやすいので、専門家にも、市場を勉強し始めて自分で取引戦略を選択し始めたばかりの人にも適しています。 戦略と指標に秘密の数式や計算方法が隠されているわけではなく、すべての戦略指標は公開されています。 Owl Smart Levels を使用すると、取引を開始するためのシグナルをすばやく確認し、
Improved version of the free HMA Trend indicator (for MetaTrader 4) with statistical analysis. HMA Trend is a trend indicator based on the Hull Moving Average (HMA) with two periods. HMA with a slow period identifies the trend, while HMA with a fast period determines the short-term movements and signals in the trend direction. The main differences from the free version: Ability to predict the probability of a trend reversal using analysis of history data. Plotting statistical charts for analyz
This indicator monitors the market for a flat state and possible breakout. The flat state is detected as a predefined number of consecutive bars during which price fluctuates inside a small range. If one of the next bars closes outside the range, breakout is signaled. The indicator shows 3 lines: blue - upper bound of flat ranges AND consecutive breakout areas; red - lower bound of flat ranges AND consecutive breakout areas; yellow - center of flat ranges (NOT including breakout areas). When a b
Wave WOLD MT4外国為替インジケータは、Wolf waveを検索し、取引端末の現在のウィンドウに表示するように設計されています。 取引でオオカミの波を使用するトレーダーのための優れた指標。 取引戦略への適用は、効率と収益性を大幅に向上させます。 指標に関する情報 他のWolf wave指標とは異なり、Wave WOLD MT4外国為替指標は、その有効性を大幅に高める多くの機能を備えています: 最初のものは開いているWindows5Pointパラメータ(真の値)情報サポートを提供します。つまり、Wolf waveが登場したチャートのウィンドウを展開します。 たとえば、EURUSD、AUDUSD、GBPUSDチャートが開いていて、それぞれにWave WOLD MT4インジケーターがインストールされている場合、ユーロモデルが検出されると、対応するチャートが自動的に他のチャートの上に前景に表示され、多数の商品を取引するときに非常に便利になります。  2番目の機能は、ユーザーが自分で選択できるパラメータ(デフォルト設定(12,26,9))であるmacd上の組み込みの発散分析で
MT4用FXインジケーター「モーニングスターパターン」 インジケーター「モーニング スター パターン」は、プライス アクション取引にとって非常に強力なインジケーターです。再描画や遅延はありません。 インジケーターがチャート上の強気モーニングスターパターンを検出: チャート上の青い矢印シグナル (写真を参照) PC、モバイル、電子メールのアラートが含まれています その兄弟である弱気の「イブニングスターパターン」インジケーターも利用できます(以下のリンクに従ってください) インジケーター「モーニングスターパターン」はサポート/レジスタンスレベルと組み合わせるのに最適です: https://www.mql5.com/en/market/product/100903 // さらに優れたエキスパートアドバイザーとインジケーターはここから入手できます: https://www.mql5.com/en/users/def1380/seller // また、収益性が高く、安定していて信頼できるシグナル https://www.mql5.com/en/signals/1887493 に参加する
Market Price Color
Rodolfo Leonardo De Morais
This indicator allows you to see the market's aggregation by buying or selling on the price . when it is attacked the sale turns into a color when it is attacked the purchase takes on another color Indicator Parameters Price_Up_Color - Color price to UP Price_Down_Color - Color price to Down Price_X_Position - Position Horizontal Price_Y_Position- Position Vertical Price_Size -  Size font
The Th3Eng PipFinite indicator is based on a very excellent analysis of the right trend direction with perfect custom algorithms. It show the true direction and the best point to start trading. With StopLoss point and Three Take Profit points. Also it show the right pivot of the price and small points to order to replace the dynamic support and resistance channel, Which surrounds the price. And Finally it draws a very helpful Box on the left side on the chart includes (take profits and Stop loss
An indicator of pattern #31 ("Long Island") from Encyclopedia of Chart Patterns by Thomas N. Bulkowski. The second gap is in the opposite direction. Parameters: Alerts - show alert when an arrow appears   Push - send a push notification when an arrow appears (requires configuration in the terminal) GapSize - minimum gap size in points ArrowType - a symbol from 1 to 17 ArrowVShift - vertical shift of arrows in points   ShowLevels - show levels ColUp - color of an upward line ColDn - color of
This LEGIT Indicator Can Accurately Predict the Outcome of One Bar. Imagine adding more filters to further increase your probability! Unlike other products, Binary Options PRO can analyze past signals giving you the statistical edge. How Increase Your Probability Information revealed here www.mql5.com/en/blogs/post/727038 NOTE: The selection of a Good Broker is important for the overall success in trading Binary Options. Benefits You Get Unique algorithm that anticipates price weaknes
BreakEven Line is a very useful and easy to use indicator. In case of multiple positions opened on the same instrument, the indicator shows the breakeven point where it is possible to close the positions. Its graphic simplicity makes it an unobtrusive and customizable tool. You can enable/disable a line on a chart, so you can make the indicator invisible. Inputs Show cumulative BE (line on/off) Breakeven line color (to change the line color) Breakeven line style Breakeven line width Show short B
All Symbols   AND  All Time frames Scan                                                                                                                 Document Introduction   The ABCD is a basic harmonic pattern. The ABCD pattern is a visual, geometric chart pattern comprised of three consecutive price swings. It looks like a diagonal lightning bolt and can indicate an upcoming trading opp
Candlestick Patterns Analytics is a powerful tool for analyzing candlestick patterns. Do you trade based on candlestick patterns? Then Candlestick Patterns Analytics is designed for you. The undeniable advantage of the indicator: Predicts trading result when trading candlestick patterns; Uses statistical data based on the history of the selected symbol and timeframe. What the indicator does Finds and marks on the chart 29 candlestick patterns; Draws arrows to indicate the classical and stati
Trade with Gann on your side!! MASTER CIRCLE 360 CIRCLE CHART, originally created by Gann admitted that this is “The Mother of all charts”. It is one of the last studies that this great trader left for us. The numeric tab le is apparently quite simple like all the tables and is based on square numbers, the SQUARE OF 12 and is by evolution, one of the most important square numbers. Here we can find CYCLE, PRICE AND TIME thanks to angles and grades, to show past and future support and resistance.
Heiken Ashi candle chart is an improved version of The Japanese candle chart, which can effectively filter the market "noise" of the Japanese candle chart. It is favored by many traders for its simplicity and intuition. For trend traders, the HA candle chart is a magic tool. Unlike the traditional Japanese candle chart, Heikenashi does not reflect the opening price, high price, low price and closing price of the market. Instead, Heikenashi calculates the value of a single K line in the dominant
We present you the indicator "Candle closing counter", which will become your indispensable assistant in the world of trading. That’s why knowing when the candle will close can help: If you like to trade using candle patterns, you will know when the candle will be closed. This indicator will allow you to check if a known pattern has formed and if there is a possibility of trading. The indicator will help you to prepare for market opening and market closure. You can set a timer to create a p
Reversal Pattern Pro
Boonyapagorn Rodvattanajinda
Reversal Patterns Pro Reversal Patterns Pro is a Price Action (PA) analytical tool that scans the reversal patterns.  - Finds and marks the most dependable Japanese candlestick patterns in real-time. - Supports all time frames (Best for Scalping) - Doesn't repaint making it an exceptional indicator for Expert Advisors. Input parameters : - Support & Resistance Mode ( true or false ) for enabling advanced filtering - Donchian Period - RSI Period - RSI Oversold Level - RSI Overbought Level - 
The PatternMMB trading indicator finds the most common candlestick analysis patterns and provides trading recommendations based on them. The PatternMMB trading indicator is designed to search for candlestick patterns on the price chart and issue trading recommendations depending on the nature of the found candlestick pattern. It is also possible to send sound notifications when all or any of the selected patterns appear, with an explanation of the pattern and its interpretation. In addition, th
Heiken Ashi Smoothed Strategy is a very simple but powerful system to get forex market trend direction. This indicator is actually 2 indicators in 1 pack, Heiken Ashi and Heiken Ashi Smoothed Moving Average both included. Because HA (Heiken Ashi) and HAS (Heiken Ashi Smoothed) are calculated in the same one system event with necessary buffers and loop only, so it is the FAST, OPTIMIZED and EFFICIENT HA having the combined indicator of MetaTrader 4. You can choose to display HA and HAS in the sam
Price reach indicator. It also serves as the perfect term for supports and resistance. I use it in two experts. The basic tool for professional trading. The indicator analyzes the last 500 bar and uses this to determine the levels ( but it doesn't predict the future ) . Personally, I use it on TF H1.  It is very simple. Four lines on chart and that's all. Only two input parameters.  Thousands of indicators. Why this? Is good ? No! Is very good. Please test the indicator prior to purchasing.
The Point61 indicator is the result of many years of monitoring of price behavior of currency pairs and metals. It is not a secret, that in times of uncertainty, traders are looking for possible levels of support and resistance - the point, where price should stop its movement. There are 2 possible scenarios at these points: 1. Reverse (correction) to the opposite direction; 2. Breakthrough to continue movement. Very often these points are used to set stop orders - TakeProfit or
Was: $249  Now: $99   Market Profile defines a number of day types that can help the trader to determine market behaviour. A key feature is the Value Area, representing the range of price action where 70% of trading took place. Understanding the Value Area can give traders valuable insight into market direction and establish the higher odds trade. It is an excellent addition to any system you may be using. Blahtech Limited presents their Market Profile indicator for the MetaTrader community. Ins
An indicator of patterns #24, #25, #26 and #27 ("Head and Shoulders", "Complex Head and Shoulders") from Encyclopedia of Chart Patterns by Thomas N. Bulkowski. Parameters: Alerts - show alert when an arrow appears   Push - send a push notification when an arrow appears (requires configuration in the terminal) PeriodBars - indicator period K - an additional parameter that influences the accuracy of pattern shape recognition. The smaller the value is, the smoother the row of peaks/valleys shou
"The trend is your friend" is one of the best known sayings in investing, because capturing large trendy price movements can be extremely profitable. However, trading with the trend is often easier said than done, because many indicators are based on price reversals not trends. These aren't very effective at identifying trendy periods, or predicting whether trends will continue. We developed the Trendiness Index to help address this problem by indicating the strength and direction of price trend
A machine translation from the English product description was used. We apologize for possible imprecisions. 英語の製品説明からの機械翻訳が使用されました。 不正確な可能性があることをお詫び申し上げます。 お気に入りのろうそく足の価格アクションパターンの視覚化システム。 アタッチされると、インジケーターはチャート上の次のパターンを自動的にマークします。 ピノキオバー - 長い「鼻」を持つ小さなボディのバー、非常によく知られている逆のパターン。 内側のバー - 範囲が前のバーの範囲内にあるバー。 それは市場の不確実性を表しています。 外側のバー - 範囲が前のバーの範囲を超えるバー。 それは市場の不確実性を表しています。 レールパターン - ほぼ等しく、より大きなボディを持つ 2 つの結果として生じる反対側のバー。 逆のパターン。これは、より高い時間枠のピノキオバーパターンと実際に一致します。 マスターキャンドル パターン - キャンドルの 5 つ、後続の 4 つのキャンドルの範囲
このプロダクトを購入した人は以下も購入しています
Gann Made Easy は、ミスター・ギャンの理論を使用した取引の最良の原則に基づいた、プロフェッショナルで使いやすい外国為替取引システムです。 W・D・ガン。このインジケーターは、ストップロスとテイクプロフィットレベルを含む正確な買いと売りのシグナルを提供します。 PUSH通知を利用して外出先でも取引可能です。 購入後はご連絡ください!私の取引のヒントと素晴らしいボーナスインジケーターを無料で共有します! おそらく、ギャンの取引手法についてはすでに何度も聞いたことがあるでしょう。通常、ギャンの理論は初心者のトレーダーだけでなく、すでにある程度の取引経験がある人にとっても非常に複雑なものです。なぜなら、ギャンの取引手法は理論的にはそれほど簡単に適用できるものではないからです。私はその知識を磨き、最良の原則を私の外国為替インジケーターに組み込むために数年を費やしました。 このインジケーターは非常に簡単に適用できます。必要なのは、それをチャートに添付し、簡単な取引推奨事項に従うだけです。このインジケーターは常に市場分析の仕事を行い、取引の機会を探します。適切なエントリーポイントを検出
現在26%オフ 初心者やエキスパートトレーダーに最適なソリューション! このインジケーターは、独自の機能と新しい計算式を取り入れた、ユニークで高品質、かつ手頃な価格のトレーディングツールです。たった1枚のチャートで28の為替ペアの通貨強度を読み取ることができます。新しいトレンドやスキャルピングチャンスの引き金となるポイントを正確に特定することができるので、あなたのトレードがどのように改善されるか想像してみてください。 ユーザーマニュアルはこちら  https://www.mql5.com/en/blogs/post/697384 これが最初の1本、オリジナルだ! 価値のないクローンを買わないでください。 特別な サブウィンドウの矢印で強い通貨の勢いを表示 GAPがあなたのトレードを導く! 基準通貨や気配値が売られすぎ・買われすぎのゾーン(外相フィボナッチレベル)にあるとき、個別チャートのメインウィンドウに警告表示。 通貨がレンジの外側から反落した場合、プルバック/リバーサルのアラート。 クロスパターンの特別なアラート 複数の時間枠を選択可能で、トレンドを素早く
まず第一に、この取引インジケーターは再描画されず、再描画されず、遅延しないことを強調する価値があります。これにより、手動取引とロボット取引の両方に理想的なものになります。 ユーザーマニュアル:設定、入力、戦略。 アトミックアナリストは、価格の強さとモメンタムを利用して市場でより良いエッジを見つけるためのPA価格アクションインジケーターです。ノイズや誤ったシグナルを除去し、取引ポテンシャルを高めるための高度なフィルターを備えています。複雑なインジケーターの複数のレイヤーを使用して、アトミックアナリストはチャートをスキャンし、複雑な数学的計算をシンプルなシグナルと色に変換します。これにより、どのような初心者トレーダーでも理解して使用し、一貫した取引の決定を行うことができます。 「アトミックアナリスト」は、新規および経験豊富なトレーダー向けにカスタマイズされた包括的な取引ソリューションです。プレミアムインジケーターとトップノッチの機能を1つの取引戦略に組み合わせ、すべてのタイプのトレーダーにとって汎用性のある選択肢にします。 デイリートレーディングとスキャルピング戦略:高
Reversal First Impulse levels (RFI)    INSTRUCTIONS        RUS       -       ENG              R ecommended to use with an indicator   -   TREND PRO -  Version MT5 A key element in trading is zones or levels from which decisions to buy or sell a trading instrument are made. Despite attempts by major players to conceal their presence in the market, they inevitably leave traces. Our task was to learn how to identify these traces and interpret them correctly. Main functions: Displaying active zones
An exclusive indicator that utilizes an innovative algorithm to swiftly and accurately determine the market trend. The indicator automatically calculates opening, closing, and profit levels, providing detailed trading statistics. With these features, you can choose the most appropriate trading instrument for the current market conditions. Additionally, you can easily integrate your own arrow indicators into Scalper Inside Pro to quickly evaluate their statistics and profitability. Scalper Inside
TrendMaestro
Stefano Frisetti
5 (2)
note: this indicator is for METATRADER4, if you want the version for METATRADER5 this is the link:  https://www.mql5.com/it/market/product/108106 TRENDMAESTRO ver 2.4 TRENDMAESTRO recognizes a new TREND in the bud, he never makes mistakes. The certainty of identifying a new TREND is priceless. DESCRIPTION TRENDMAESTRO identifies a new TREND in the bud, this indicator examines the volatility, volumes and momentum to identify the moment in which there is an explosion of one or more of these data a
Manual guide:   Click here Starting price of  $88  for the first 25 copies only ( 3  left)! -- Next price is  $176 .  This indicator is unstoppable when combined with our other indicator called  Support & Resistance . After purchase, send us a message and you could get  it  for  FREE as a BONUS!  Introducing Trend Punch , the revolutionary forex trend indicator that will transform the way you trade! Trend Punch is uniquely designed to provide precise buy and sell arrows during strong
Advanced Supply Demand
Bernhard Schweigert
4.92 (311)
現在33%オフ 初心者にもエキスパートトレーダーにも最適なソリューション このインジケーターは独自の機能と新しい公式を多数内蔵しており、ユニークで高品質かつ手頃な取引ツールです。このアップデートでは、2つの時間枠ゾーンを表示できるようになります。より長いTFだけでなく、チャートTFとより長いTF(ネストゾーンを表示)の両方を表示できます。すべてのSupply Demandトレーダーの皆さんのお気に召すはずです。:) 重要情報の公開 Advanced Supply Demandの可能性を最大化するには、 https://www.mql5.com/ja/blogs/post/720245 にアクセスしてください。   エントリーまたはターゲットの正確なトリガーポイントを正確に特定できれば取引がどのように改善されるか想像してみてください。新しい基盤となるアルゴリズムに基づいて構築されているため、買い手と売り手の間の潜在的な不均衡をさらに簡単に特定できます。これは、最も強い需要と供給のゾーンと、過去のパフォーマンス(古いゾーンを表示)がグラフィカルに表現されるためです。これらの機能は、最適
TPSpro TRENDPRO  - is a trend indicator that automatically analyzes the market and provides information about the trend and each of its changes, as well as giving signals for entering trades without redrawing! The indicator uses each candle, analyzing them separately. referring to different impulses - up or down impulse. Exact entry points into transactions for currencies, crypto, metals, stocks, indices!  -  Version MT5               DETAILED DESCRIPTION                R ecommended to use with
カスタムMT4インジケーターで外国為替取引を成功させるための秘密を発見してください! 外国為替市場で成功を達成し、リスクを最小限に抑えながら一貫して利益を得る方法を疑問に思ったことはありますか? これがあなたが探している答えです! 取引へのアプローチに革命をもたらす独自のMT4インジケーターを導入できるようにします。 ユニークな汎用性 私たちのインジケータは、RenkoとRangeBarのろうそくのフォーメーションを好むユーザー向けに特別に設計されています。 これらのチャートタイプは多くの経験豊富なトレーダーに好まれていることを理解しています。そのため、私たちのインジケーターはそれらとシームレスに統合され、比類のない市場分析を提供します。 クリアトレンドシグナル 複雑な分析を忘れてください! 私たちのインジケーターは、鮮やかな色と明確なドット構造を利用して、市場の動向を明確に示しています。 赤と青の点は、価格の動きの方向性について疑いの余地がなく、取引の迅速な意思決定を可能にします。 HH/HL HL/LL戦略とのアライメント HH/HLおよびHL/LL構
Break and Retest
Mohamed Hassan
4.33 (12)
New update to V.4 where  Break & Retest automatically draws the take profit & stop loss levels and you also have more signals per day! ‍You can visually backtest Break & Retest to see how it behaved in the past!     Manual guide:   Click here $65  for only 1  copy left! Next price is $120 .  This Indicator only places quality trades when the market is really in your favor with a clear break and retest. Patience is key with this price action strategy! If you want more alert s
現在20%OFF! 初心者やエキスパートトレーダーのためのベストソリューション! このダッシュボードソフトウェアは、28の通貨ペアで動作しています。それは私達の主要な指標(高度な通貨の強さ28と高度な通貨インパルス)の2に基づいています。それは全体の外国為替市場の大きい概観を与えます。それは、すべての(9)時間枠で28の外国為替ペアのための高度な通貨の強さの値、通貨の動きの速度と信号を示しています。チャート上で1つのインディケータを使用して市場全体を観察し、トレンドやスキャルピングの機会をピンポイントで見つけることができたら、あなたのトレードがどのように改善されるか想像してみてください。 このインディケータには、強い通貨と弱い通貨の識別、潜在的な取引の識別と確認がより簡単になるような機能が搭載されています。このインディケータは、通貨の強さや弱さが増加しているか減少しているか、また、すべての時間枠でどのように機能しているかをグラフィカルに表示します。 新機能として、現在の市場環境の変化に適応するダイナミックなマーケットフィボナッチレベルが追加され、すでに当社のAdvan
通貨強さウィザードは、取引を成功させるためのオールインワン ソリューションを提供する非常に強力な指標です。このインジケーターは、複数の時間枠のすべての通貨のデータを使用して、このまたはその外国為替ペアのパワーを計算します。このデータは、使いやすい通貨インデックスと通貨パワーラインの形式で表され、特定の通貨のパワーを確認するために使用できます。 必要なのは、取引したいチャートにインジケーターを接続することだけです。インジケーターは、取引する通貨の実際の強さを示します。このインジケーターは、トレンドに合わせて取引するときに有利に利用できる売買高の圧力の極値も示します。このインジケーターには、フィボナッチに基づく可能なターゲットも表示されます。 このインジケーターは、PUSH 通知を含むあらゆるタイプのアラートを提供します。 購入後ご連絡下さい。私の取引のヒントをあなたと共有し、素晴らしいボーナスインジケーターを無料で提供します! 幸せで有益な取引をお祈りします。
もちろんです。以下は、提供いただいたテキストの日本語への翻訳です: MT4用の天文学指標をご紹介します:究極の天体トレーディングコンパニオン トレーディング体験を天空の高みに高める準備はできていますか?私たちの革命的なMT4用の天文学指標をご紹介します。この革新的なツールは、複雑なアルゴリズムの力を借りて、類まれなる天文学的洞察と精密な計算を提供します。 あなたの指先で宇宙の情報を: 宝のような天文学的データが明らかになる包括的なパネルをご覧ください。惑星の地理的/太陽中心座標、太陽と地球の距離、星の大きさ、伸び、星座、黄道座標および赤道座標、さらには水平座標まで、それぞれが綿密に計算され美しく表示されています。指標によって生成される垂直線は時間値に対応し、トレーディングの旅に宇宙の視点を提供します。 惑星のラインと関係: グラフを飾る惑星のラインの魔法を体験し、スケールと角度をカスタマイズできます。直感的なコントロールパネルを介して各惑星のラインの表示を簡単に切り替えることができます。指定された時刻範囲内での合会、六分会、四分会、三分会、対会、逆行の指標で天体の関係の芸術を発見してく
ICT, SMC, SMART MONEY CONCEPTS, SMART MONEY, Smart Money Concept, Support and Resistance, Trend Analysis, Price Action, Market Structure, Order Blocks, BOS/CHoCH,   Breaker Blocks ,  Momentum Shift,   Supply&Demand Zone/Order Blocks , Strong Imbalance, HH/LL/HL/LH,    Fair Value Gap, FVG,  Premium  &   Discount   Zones, Fibonacci Retracement, OTE, Buy Side Liquidity, Sell Side Liquidity, BSL/SSL Taken, Equal Highs & Lows, MTF Dashboard, Multiple Time Frame, BigBar, HTF OB, HTF Market Structure, 
TrendDecoder Premium
Christophe Pa Trouillas
5 (4)
レンジと次の動きを特定    |  トレンドの最も早いシグナルと強さを得る   |  反転の前に明確な出口を得る   |  価格がテストするフィボ・レベルを見つける。 非リペイント、非遅延インディケータ - マニュアルおよび自動売買に最適 - すべての資産、すべての時間単位に対応 期間限定キャンペーン   >> 50%OFF 購入後、 推奨セッティングについては、このチャンネルで私に連絡してください。 MT5 バージョン: ここをクリック BladeSCALPER   と   PowerZONES   を使った完全な方法を入手する どのようなものですか? TrendDECODERは、トレンド監視をシンプルかつ簡単にするための複数のイノベーションを集約したものです。 Projective TrendLine (投影トレンドライン) - 今後のトレンドのスピードリファレンス。 RealTime TrendLine vs. Projective TrendLine (リアルタイムトレンドライン vs. Projective TrendLine) - 市場が同じ方
FX Volume
Daniel Stein
4.6 (35)
mql5と Telegramの モーニング・ブリーフィングで、詳細とスクリーンショットを含む毎日のマーケット・アップデートをご覧 ください! FX Volumeは、ブローカーの視点から市場のセンチメントをリアルに洞察する、最初で唯一の出来高インジケーターです。 ブローカーのような機関投資家が外国為替市場でどのようなポジションをとっているか、COTレポートよりもはるかに速く、素晴らしい洞察を提供します。 この情報をチャート上で直接見ることは、あなたの取引にとって真のゲームチェンジャーであり、画期的なソリューションです。 以下のようなユニークなマーケットデータ洞察から利益を得てください。 比率は 、通貨のロングポジションとショートポジションの比率をパーセントで表示します。 比率の変化は 、選択した期間内のロング比率とその変化率を表示します。 Volumes Totalは 、通貨の取引量(ロングとショート)の合計をロット単位で表示します。 Volumes Long :全通貨のロングポジションの取引量を表示します。 Volumes(ショート )は、全通貨のショートポジションの取引量を表示
The indicator of a Professional Trader is an arrow indicator for predicting the direction of price movement. I have been working on this indicator since 2014. You can use this indicator as your main indicator, use its entry signals, and use it as your only indicator to find entry points. About the product: Recommended TF [H4-D1-W1]   . The indicator predicts the direction of the next candle. Fits a variety of tools; Flexibility in settings for different instruments and intervals through the
まず第一に、この取引ツールはノンリペイント、ノンリドロー、ノンラグの指標であり、プロの取引に理想的ですことを強調する価値があります。 オンラインコース、ユーザーマニュアル、デモ。 スマートプライスアクションコンセプトインジケーターは、新米から経験豊富なトレーダーまで、非常 に強力なツールです。Inner Circle Trader AnalysisやSmart Money Concepts Trading Strategiesなど、20以上の有用な指標を1つに組み合わせています。このインジケーターはスマートマネーコンセプトに焦点を当て、大手機関の取引方法を提供し、彼らの動きを予測するのに役立ちます。 特に、流動性分析に優れており、機関がどのように取引しているかを理解しやすくしています。市場のトレンドを予測し、価格の動きを慎重に分析するのに優れています。機関の戦略とトレードを合わせることで、市場の動向についてより正確な予測ができます。このインジケーターは多目的であり、市場構造を分析し、重要な注文ブロックを特定し、さまざまなパターンを認識するのに優れています。 このインジケー
現在31%オフ! 初心者やエキスパートトレーダーに最適なソリューション! このインジケータは、独自の機能と秘密の数式を組み込んだ、ユニークで高品質かつ手頃な価格のトレーディングツールです。たった1枚のチャートで28の通貨ペアのアラートを表示します。新しいトレンドやスキャルピングチャンスの引き金となるポイントを正確に把握することができるので、あなたのトレードがどのように改善されるか想像してみてください! 新しい基本的なアルゴリズムに基づいて構築されているため、潜在的な取引の特定と確認がより簡単になります。これは、通貨の強さや弱さが加速しているかどうかをグラフィカルに表示し、その加速のスピードを測定するためです。加速すると物事は明らかに速く進みますが、これはFX市場でも同じです。つまり、反対方向に加速している通貨をペアにすれば、利益を生む可能性のある取引を特定することができるのです。 通貨の勢いを示す縦の線と矢印は、あなたの取引の指針となるでしょう。 ダイナミックマーケットフィボナッチ23レベルはアラートトリガーとして使用され、市場の動きに適応します。もしインパルスが黄色
Legacy of Gann
Pavel Zamoshnikov
4.83 (12)
The indicator very accurately determines the levels of the possible end of the trend and profit fixing. The method of determining levels is based on the ideas of W.D.Gann, using an algorithm developed by his follower Kirill Borovsky. Extremely high reliability of reaching levels (according to K. Borovsky  - 80-90%) Indispensable for any trading strategy – every trader needs to determine the exit point from the market! Precisely determines targets on any timeframes and any instruments (forex, met
74% discount for the next 10 buyers (original price $605): 1 left Get a 50% bonus by buying (or even renting) any of our products. After buying (or renting), send a message for more information. 3 Indicators in 1 indicator Strategy based on price action Made specifically for the best forex currency pairs Can be used in the best time frame of the market at a very reasonable price This indicator is basically 3 different indicatos . But we have combined these 3 indicators in 1 indicator so th
Auto Order Block with break of structure based on ICT and Smart Money Concepts Futures Break of Structure ( BoS )             Order block ( OB )            Higher time frame Order block / Point of Interest ( POI )    shown on current chart           Fair value Gap ( FVG ) / Imbalance   ,  MTF      ( Multi Time Frame )    Volume Imbalance     ,  MTF          vIMB Gap’s Equal High / Low’s     ,  MTF             EQH / EQL Liquidity               Current Day High / Low           HOD /
ご紹介   クォンタム トレンド スナイパー インジケーターは 、トレンド反転を特定して取引する方法を変革する画期的な MQL5 インジケーターです。 13年以上の取引経験を持つ経験豊富なトレーダーのチームによって開発されました。     クォンタムトレンドスナイパーインジケーター   は、非常に高い精度でトレンドの反転を識別する革新的な方法で、あなたのトレーディングの旅を新たな高みに押し上げるように設計されています。 ***Quantum Trend Sniper Indicatorを購入すると、Quantum Breakout Indicatorを無料で入手できます!*** クォンタム ブレイクアウト インジケーターは、トレンドの反転を特定するとアラートを発し、矢印を示し、3 つのテイクプロフィットレベルを提案します。 初心者トレーダーにもプロのトレーダーにも適しています。 量子EAチャネル:       ここをクリック MT5のバージョン:       ここをクリック 推奨事項: 期間: すべての時間枠。最良の結果を得るには、
Scalper Vault は、スキャルピングを成功させるために必要なすべてを提供するプロフェッショナルなスキャルピング システムです。このインジケーターは、外国為替およびバイナリー オプションのトレーダーが使用できる完全な取引システムです。推奨される時間枠は M5 です。 システムは、トレンドの方向に正確な矢印シグナルを提供します。また、トップとボトムのシグナルとギャン マーケット レベルも提供します。 インジケーターは、プッシュ通知を含むすべてのタイプのアラートを提供します。 インジケータの購入後にご連絡ください。私の個人的な取引の推奨事項と素晴らしいボーナス指標を無料で共有します! 幸せで有益な取引をお祈りします!
Sacrament
owais_saadeh
4.91 (11)
Sacrament mt4- This is an indicator that includes the best basic forex indicators, without redrawing. Based on this data, a signal for sale or purchase is formed. It does not disappear anywhere after the signal, which gives us the opportunity to see the results on the history. It can be used on any currency pair, crypto metals, stocks It is best used on an hourly chart, but other periods are also acceptable. The best results for the period H1,H4,daily If customers have any questions, I w
TakePropips Donchian Trend Pro
Eric John Pajarillaga Aldana
4.82 (17)
TakePropips Donchian Trend Pro   (MT4) は、ドンチャン チャネルを使用してトレンドの方向を自動的に検出し、エントリーとエグジットの取引シグナルを提供する強力で効果的なツールです! この多機能インジケーターには、トレンド スキャナー、取引シグナル、統計パネル、スクリーナー、取引セッション、およびアラート履歴ダッシュボードが含まれます。取引シグナルを提供し、チャートを分析する時間を節約するように設計されています! ユーザー マニュアルとインストール ガイドは、ブログ投稿 (   https://www.mql5.com/en/blogs/post/751368   ) からダウンロードできます。 今日は 50% オフ! 98ドルから49ドルに値下げ! このインジケーターは、ストラテジー テスターでテストできます (ビジュアル モードを有効にします)。 詳細については、説明の下にあるビデオ チュートリアルも利用できます。 ご不明な点やサポートが必要な場合は、私に連絡してください。 TakePropips Donchian Trend Pro イン
デイトレーダーマスターは、デイトレーダーのための完全なトレーディングシステムです。システムは2つのインジケーターで構成されています。 1つの指標は売買する矢印信号です。それはあなたが得る矢印インジケーターです。 2つ目のインジケーターを無料で提供します。 2番目のインジケーターは、これらの矢印と組み合わせて使用​​するために特別に設計されたトレンドインジケーターです。 インジケーターは繰り返さず、遅れないでください! このシステムの使用は非常に簡単です。 2色の線で表示されている現在のトレンドの方向に矢印信号をたどる必要があります。青は買いの傾向です。赤い色は売りの傾向です。青い矢印は買いシグナルです。赤い矢印は売りの合図です。トレンドラインの色と一致するように、矢印の色と信号の方向が必要です。 矢印インジケーターは、主に時間間隔M5とM15での日中取引のために作成されました。ただし、技術的には、システムは他の時間間隔で使用できます。 インジケータには、PUSHメッセージ機能を備えたポップアップアラートが装備されています。 購入後、必ず私に書いてください!私はあなたにシステムとの取引の
mql5と Telegramの モーニング・ブリーフィングで、詳細とスクリーンショットを含む毎日のマーケット・アップデートをご覧 ください! FX Power MT4 NGは 、長年の人気を誇る通貨強度計FX Powerの次世代モデルです。 この次世代ストレングスメーターは何を提供するのでしょうか?初代FXパワーの魅力すべて プラス GOLD/XAUの強さ分析 より正確な計算結果 個別に設定可能な分析期間 カスタマイズ可能な計算上限値により、さらに優れたパフォーマンスを実現 もっと見たい人のための特別なマルチインスタンス設定 すべてのチャートでお好みの色を無限に設定可能 数え切れないほどの通知オプションにより、重要なことを見逃すことはありません。 Windows 11とmacOSのスタイルで角を丸くした新しいデザイン 魔法のように動くインジケーターパネル FXパワーの主な機能 すべての主要通貨の強さの完全な履歴 すべての時間枠における通貨の強さの履歴 すべてのブローカーとチャートで同一の計算結果 100%信頼できるリアルタイム計算 -> リペイントなし ドロップダウン・リストから
ご紹介     Quantum Breakout PRO は 、ブレイクアウト ゾーンの取引方法を変革する画期的な MQL5 インジケーターです。 13年以上の取引経験を持つ経験豊富なトレーダーのチームによって開発された Quantum Breakout PROは 、革新的でダイナミックなブレイクアウトゾーン戦略により、あなたの取引の旅を新たな高みに押し上げるように設計されています。 クォンタム ブレイクアウト インジケーターは、5 つの利益ターゲット ゾーンを備えたブレイクアウト ゾーン上のシグナル矢印と、ブレイクアウト ボックスに基づいたストップロスの提案を提供します。 初心者トレーダーにもプロのトレーダーにも適しています。 量子EAチャネル:       ここをクリック MT5バージョン:   ここをクリック 重要!購入後、インストールマニュアルを受け取るためにプライベートメッセージを送ってください。 推奨事項: 時間枠: M15 通貨ペア: GBPJPY、EURJPY、USDJPY、NZDUSD、XAUUSD アカウントの種類: ECN、Raw、また
作者のその他のプロダクト
Copy Trader is a convenient and fast order copier for MetaTrader4. The EA performs the copying of orders from the server terminal to one or several client terminals. It monitors opening/closing, StopLoss and TakeProfit, and also pending orders. It uses a magic number for its orders, which allows to open other orders in the client terminal both manually and using other experts; It has a minimum of settings. Install the Expert Advisor in two terminals: Choose MODE - SERVER on the terminal to copy
Candlestick Patterns MT4 is a simple and convenient indicator able to define 29 candle patterns. Advantages Defines and highlights 29 candle patterns; Estimated trading direction is shown as an arrow; Each candlestick pattern can be disabled in the settings; The indicator can be used as an arrow indicator in EAs. Parameters TextSize - chart text size; TextColor - chart text color; Alert - enable/disable alerts; ---------- Candlestick Patterns ------------- - settings separator; AdvanceBlock
Candlestick Patterns Analytics is a powerful tool for analyzing candlestick patterns. Do you trade based on candlestick patterns? Then Candlestick Patterns Analytics is designed for you. The undeniable advantage of the indicator: Predicts trading result when trading candlestick patterns; Uses statistical data based on the history of the selected symbol and timeframe. What the indicator does Finds and marks on the chart 29 candlestick patterns; Draws arrows to indicate the classical and stati
Candlestick Patterns Custom is the lite version of the Candlestick Patterns Analytics indicator , intended for use as a conventional arrow indicator and in expert advisors. The considerable advantages of the indicator It finds and marks 29 candlestick patterns (43 variants of signal patterns) on the chart; It allows the user to configure the signal of each pattern in accordance with the analysis results of the Candlestick Patterns Analytics indicator; The indicator can also be used as an arrow
Candlestick Patterns Trade Custom is an Expert Advisor for trading candlestick patterns. The considerable advantages of the EA It allows the user to configure the signal of each pattern, it is recommended to configure the EA in accordance with the analysis results of the Candlestick Patterns Analytics indicator; It does not use Martingale; Contains the integrated Candlestick Patterns Custom indicator. Description of Input Parameters Each candlestick pattern has a drop-down menu with the opti
The MultiCurrency RSI indicator calculates the values of the standard RSI indicator for each of 8 major currencies: EUR, GBP, AUD, NZD, USD, CAD, CHF, JPY. Advantage of the indicator: The calculation is performed based on 8 virtual currency charts: EUR, GBP, AUD, NZD, USD, CAD, CHF, JPY; Shows the strength of currencies, not depending on the currency pair; Allows any time to determine the strongest and the weakest currency, also sorts currencies by strength; At any time it shows the current st
MultiCurrency Indicators is a multi-currency indicator which calculates the values of multiple standard indicators for each of the 8 major currencies: EUR, GBP, AUD, NZD, USD, CAD, CHF, JPY. Advantages of the indicator Calculation is performed for 8 virtual charts of the currencies: EUR, GBP, AUD, NZD, USD, CAD, CHF, JPY; Show the currency strength, which does not depend on the currency pair; It allows determining the strongest and the weakest currencies at any moment, it also sorts currencies
Future Candle One Candle is an arrow indicator of candlestick patterns, based on the calculation of historical statistics. It identifies and calculates patterns consisting of one candle. Advantages of the indicator Gives information about the next candle right now; The indicator values are based on statistical data on the history of the current instrument; Forecasts and displays the result of trading based on its signals; The colors of the indicator have been selected for a comfortable operati
Future Candle Two Candle is an arrow indicator of candlestick patterns, based on the calculation of historical statistics. It identifies and calculates patterns consisting of two candles. Advantages of the indicator Gives information about the next candle right now; The indicator values are based on statistical data on the history of the current instrument; Forecasts and displays the result of trading based on its signals; The colors of the indicator have been selected for a comfortable operat
Future Candle Three Candle is an arrow indicator of candlestick patterns, based on the calculation of historical statistics. It identifies and calculates patterns consisting of three candles. Advantages of the indicator Gives information about the next candle right now; The indicator values are based on statistical data on the history of the current instrument; Forecasts and displays the result of trading based on its signals; The colors of the indicator have been selected for a comfortable op
RSI Trend is a trend indicator that interprets the current market situation based on multiple RSI indicators with different periods. Indicator Benefits Displays zones of an evident trend movement, overbought/oversold zones, as well as transition zones; Can be used in scalping strategies, as well as medium-term and long-term strategies; Has a minimum of settings; The standard line colors and selected for a comfortable operation with the black and white styles of the chart; Can be used in Expert
Spreads Monitoring MT4 - мощный инструмент для сбора значений спреда и записи их в файл. Позволяет "ловить" минимальные и максимальные значения спреда, рассчитывает реальное среднее значение спреда у брокера . Преимущества индикатора: Работает на всех таймфреймах; Восстанавливает ранее записанные данные для отображения на графике; Умеет запускать себя на графиках других символов по шаблону текущего графика; Имеет инструменты для удобной работы с данными; Не нагружает терминал. Параметры индикато
Pivots MT4 - Простой и удобный индикатор уровней pivot , рассчитывает уровни по методам  Classic , Fibonacci , DeMark , Camarilla , WooDie , Central Pivot Range . Индикатор выгодно отличается следующим Рассчитывает уровни pivot по методам  Classic ,  Fibonacci ,  DeMark ,  Camarilla ,  WooDie ,  Central Pivot Range ; Выводит на графике текущие уровни и уровни на предыдущих периодах; Выводит на графике выбранные метод и период, названия уровней и их ценовые значения. Параметры Pivot Method - Вып
Candlestick Patterns MT5  is a simple and convenient indicator able to define 29 candle patterns. Advantages Defines and highlights 29 candle patterns; Estimated trading direction is shown as an arrow; Each candlestick pattern can be disabled in the settings; The indicator can be used as an arrow indicator in EAs. Parameters TextSize  - chart text size; TextColor  - chart text color; Alert  - enable/disable alerts; ---------- Candlestick Patterns -------------  - settings separator; AdvanceB
フィルタ:
レビューなし
レビューに返信
バージョン 1.1 2021.11.30
New build