PipsFactoryDaily
- インディケータ
- Alfred Kamal
- バージョン: 4.0
- アップデート済み: 2 12月 2021
- アクティベーション: 5
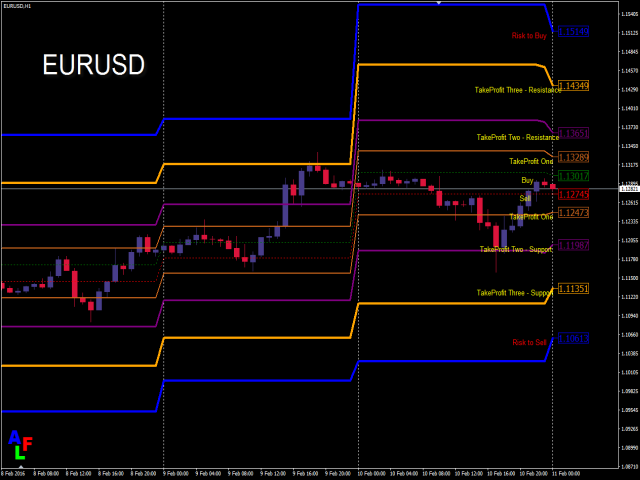
This indicator depends on High and Low price of currency in the last day, and then I made some secret equations to draw 10 lines.
Features
- You will know what exactly price you should enter the market.
- You will know when to be out of market.
- You will know what you should do in market:
- Buy
- Sell
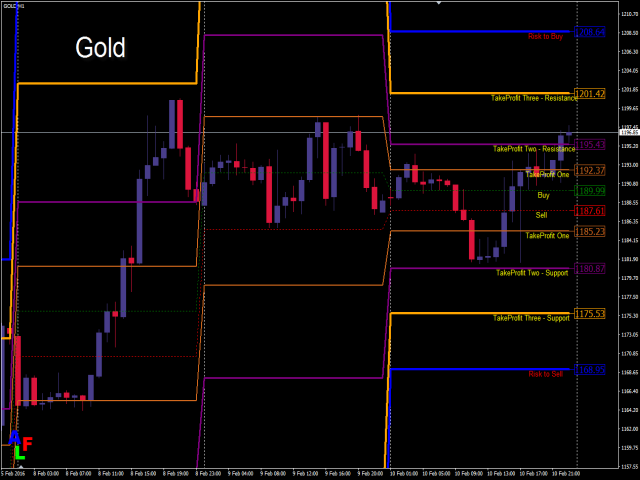
- Take profit, and there are three levels to take your profit
- Support
- Resistance
- Risk to buy
- Risk to sell
Signal Types and Timeframes Used
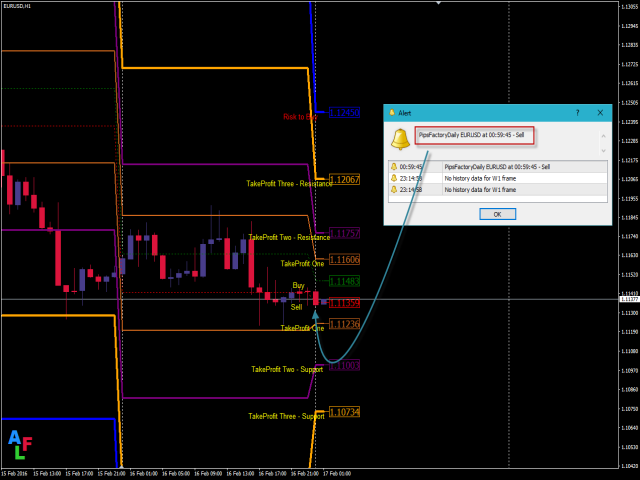
- You can use this indicator just on (M1, M5, M15, M30, H1) timeframes and you have to download the historical data of D1 timeframe.
- Enter buy order in case the price is at buy line and there are three levels to take your profit:
- First level is take profit.
- Second level is take profit too but it is also Resistance.
- Third level is take profit too but it is also Resistance.
- The fourth line is Risk to enter market with buy order.
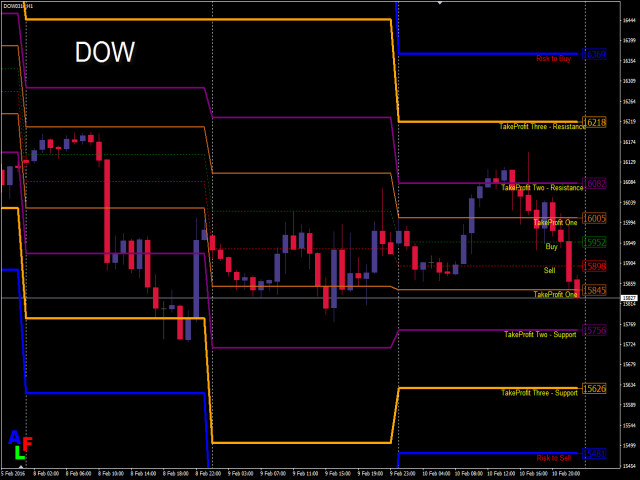
- Enter sell order in case price at sell line and there are three levels to take your profit:
- First level is take profit.
- Second level is take profit too but it is also Support
- Third level is take profit too but it is also Support.
- The fourth line is Risk to enter market with sell order.
- Currency: It works on any currency pair, but for best results use it on EURUSD H1
- It is very easy to use.
Indicator parameters:
- Notifications - if it false there are no notifications at all, if it true you have to choose how indicator will send notifications to you.
- Alert - Displays a message in a separate window.
- Send push message - Sends push notifications to the mobile terminals, whose MetaQuotes IDs are specified in the "Notifications" tab.
- Send an email - Sends an email at the address specified in the settings window of the "Email" tab.

Amazing indicator by a very generous and helpful author. Worth the spend as you can instantly make your money back if you know what you are doing. Thank you once again for your amazing work.