Black Rock Secrets
- インディケータ
- Ivan Stefanov
- バージョン: 1.0
- アクティベーション: 10
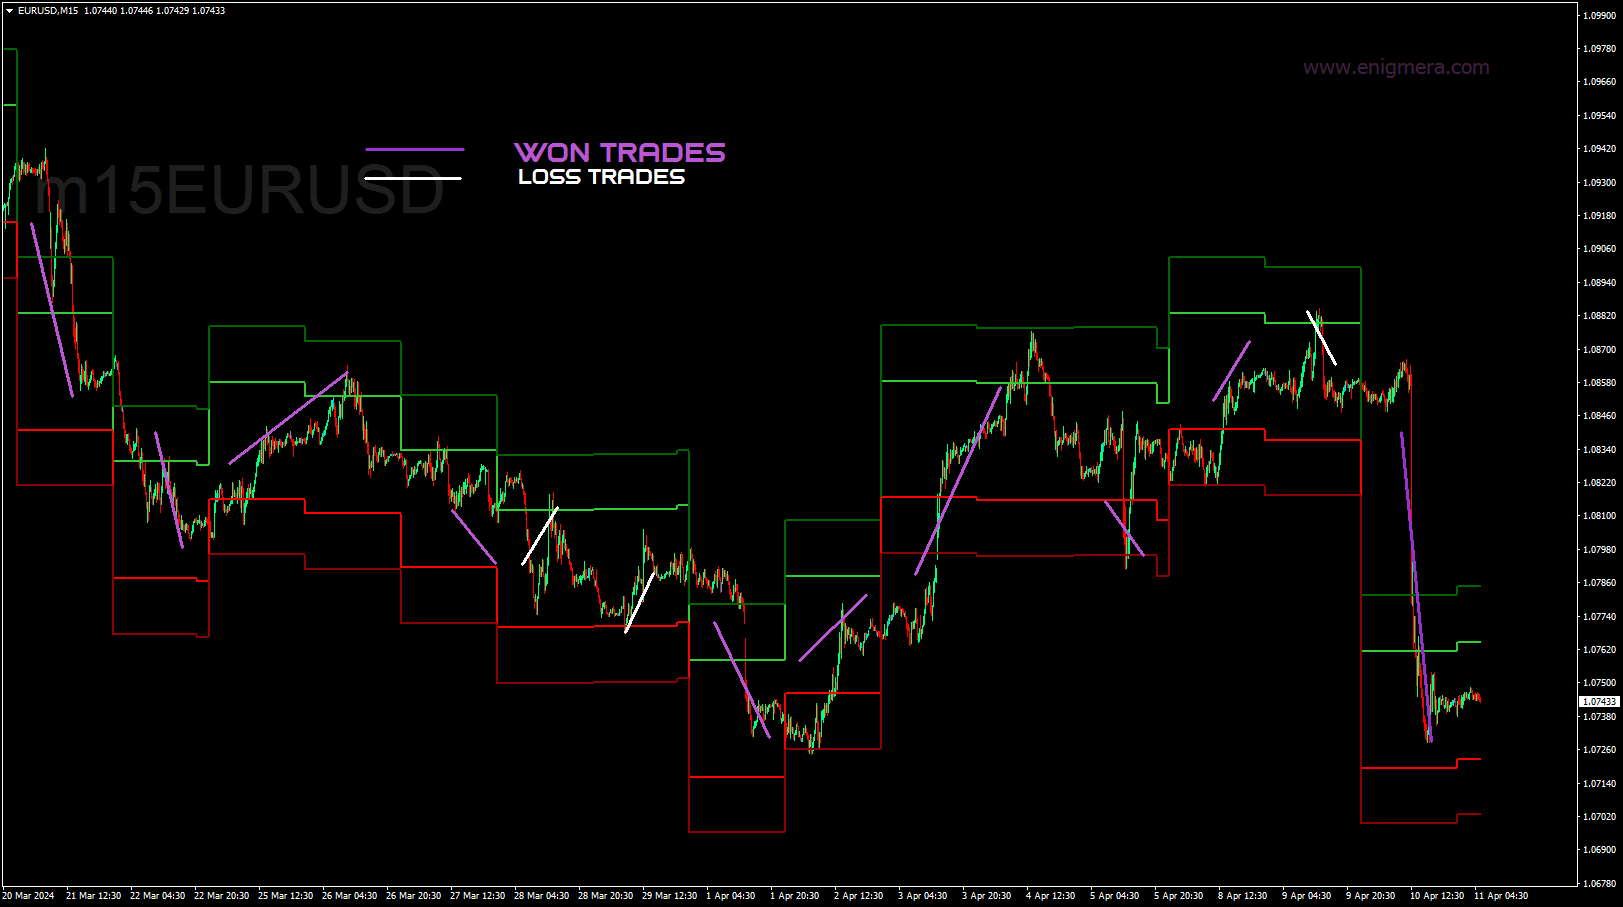
このインジケーターは、毎日レベルを表示する。
昨日のグリーンゾーンに入ったら買い、昨日のレッドゾーンに入ったら売り。
ストップ20ピプス。
目標は20ピプス以上。
注文を出して待つだけ。
取引するペア
EURUSD
GBPUSD
特別なスキルは必要ありません。アルゴリズムがすべて自分で計算します。
成功率は抜群です。シンプルだが効果的!
このインジケーターは、毎日レベルを表示する。
昨日のグリーンゾーンに入ったら買い、昨日のレッドゾーンに入ったら売り。
ストップ20ピプス。
目標は20ピプス以上。
注文を出して待つだけ。
取引するペア
EURUSD
GBPUSD
特別なスキルは必要ありません。アルゴリズムがすべて自分で計算します。
成功率は抜群です。シンプルだが効果的!