MACD Signal indicator
- インディケータ
- Adam Zolei
- バージョン: 1.1
- アップデート済み: 29 12月 2023
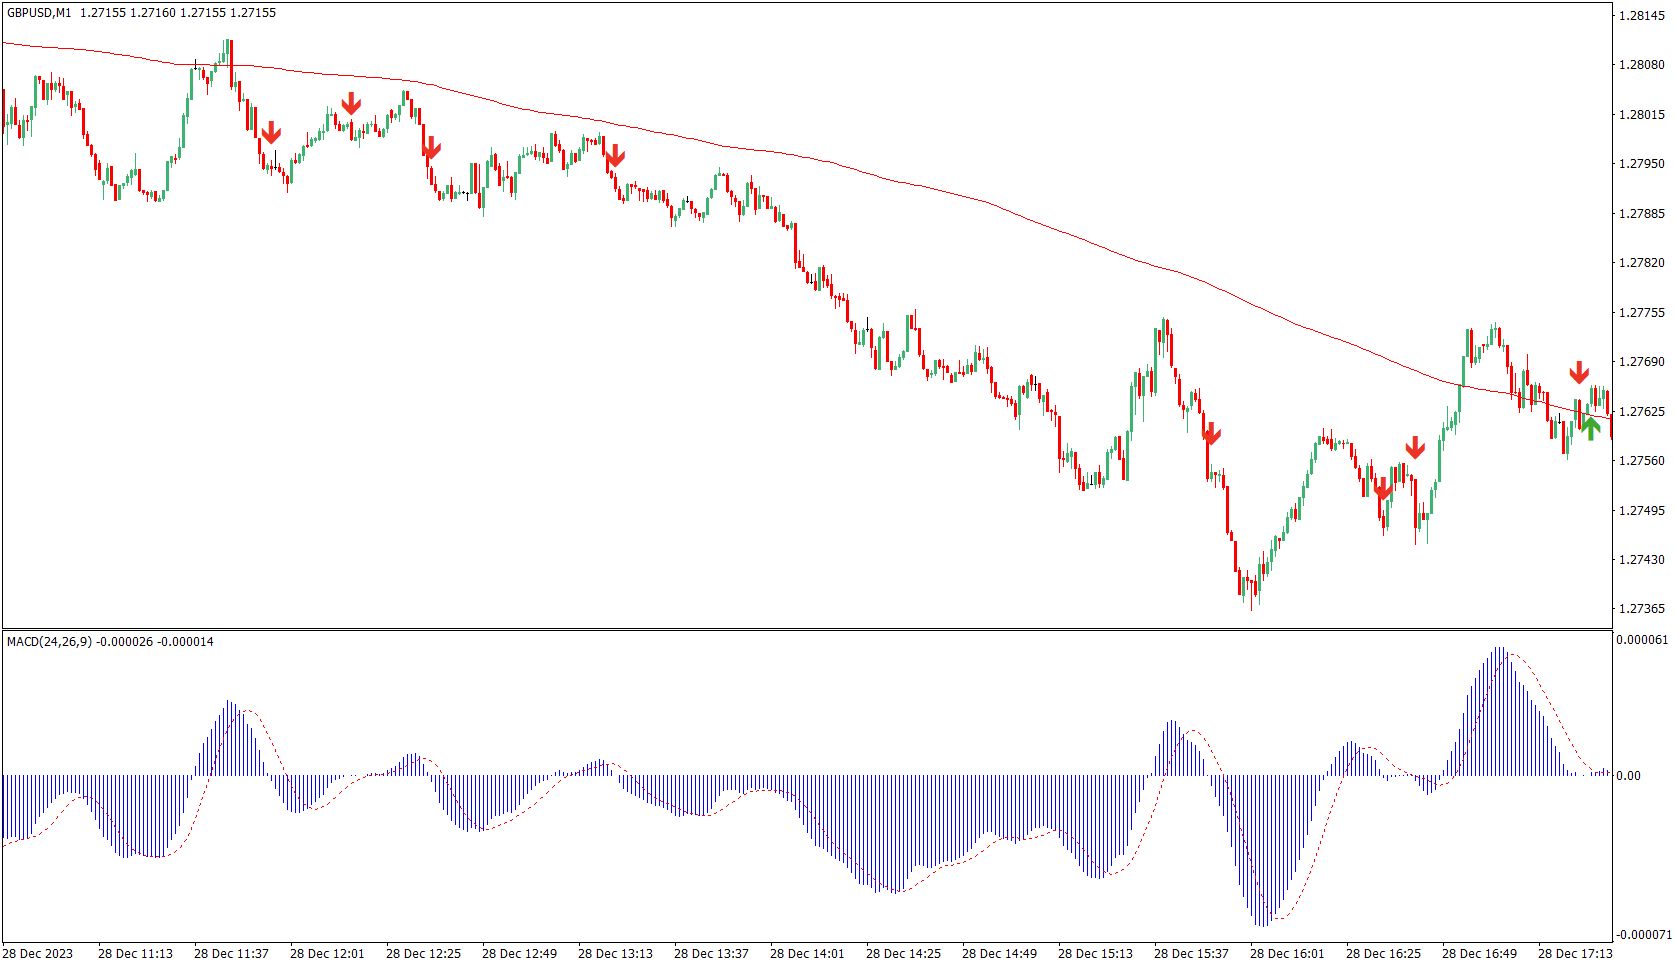
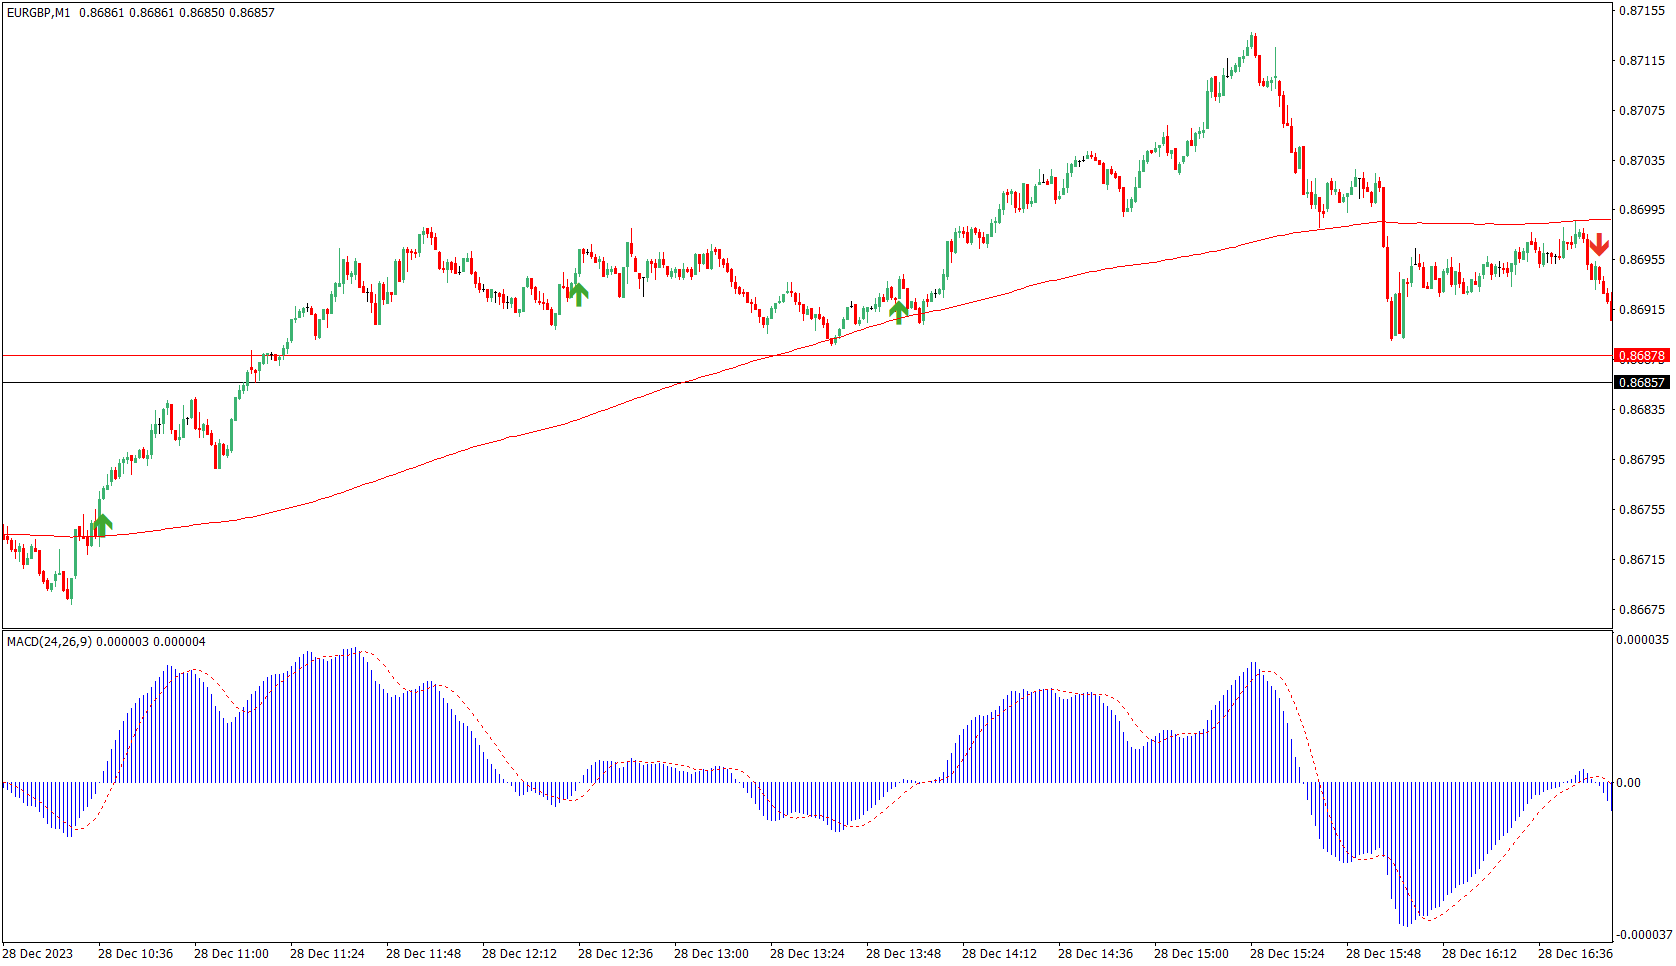
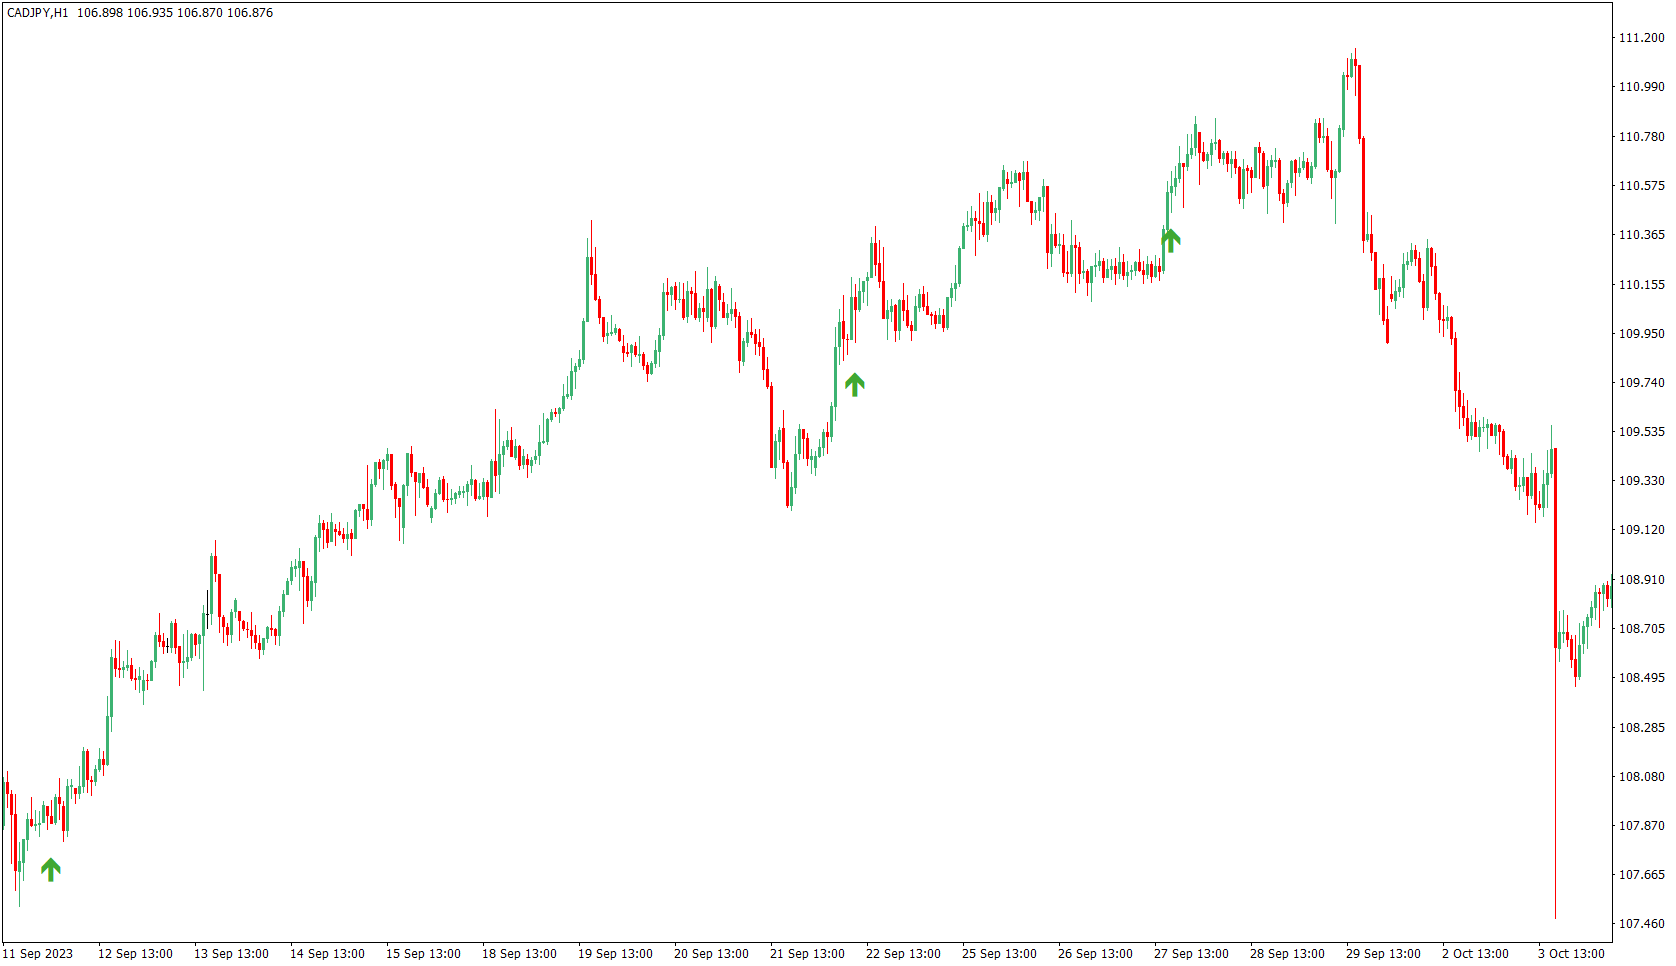
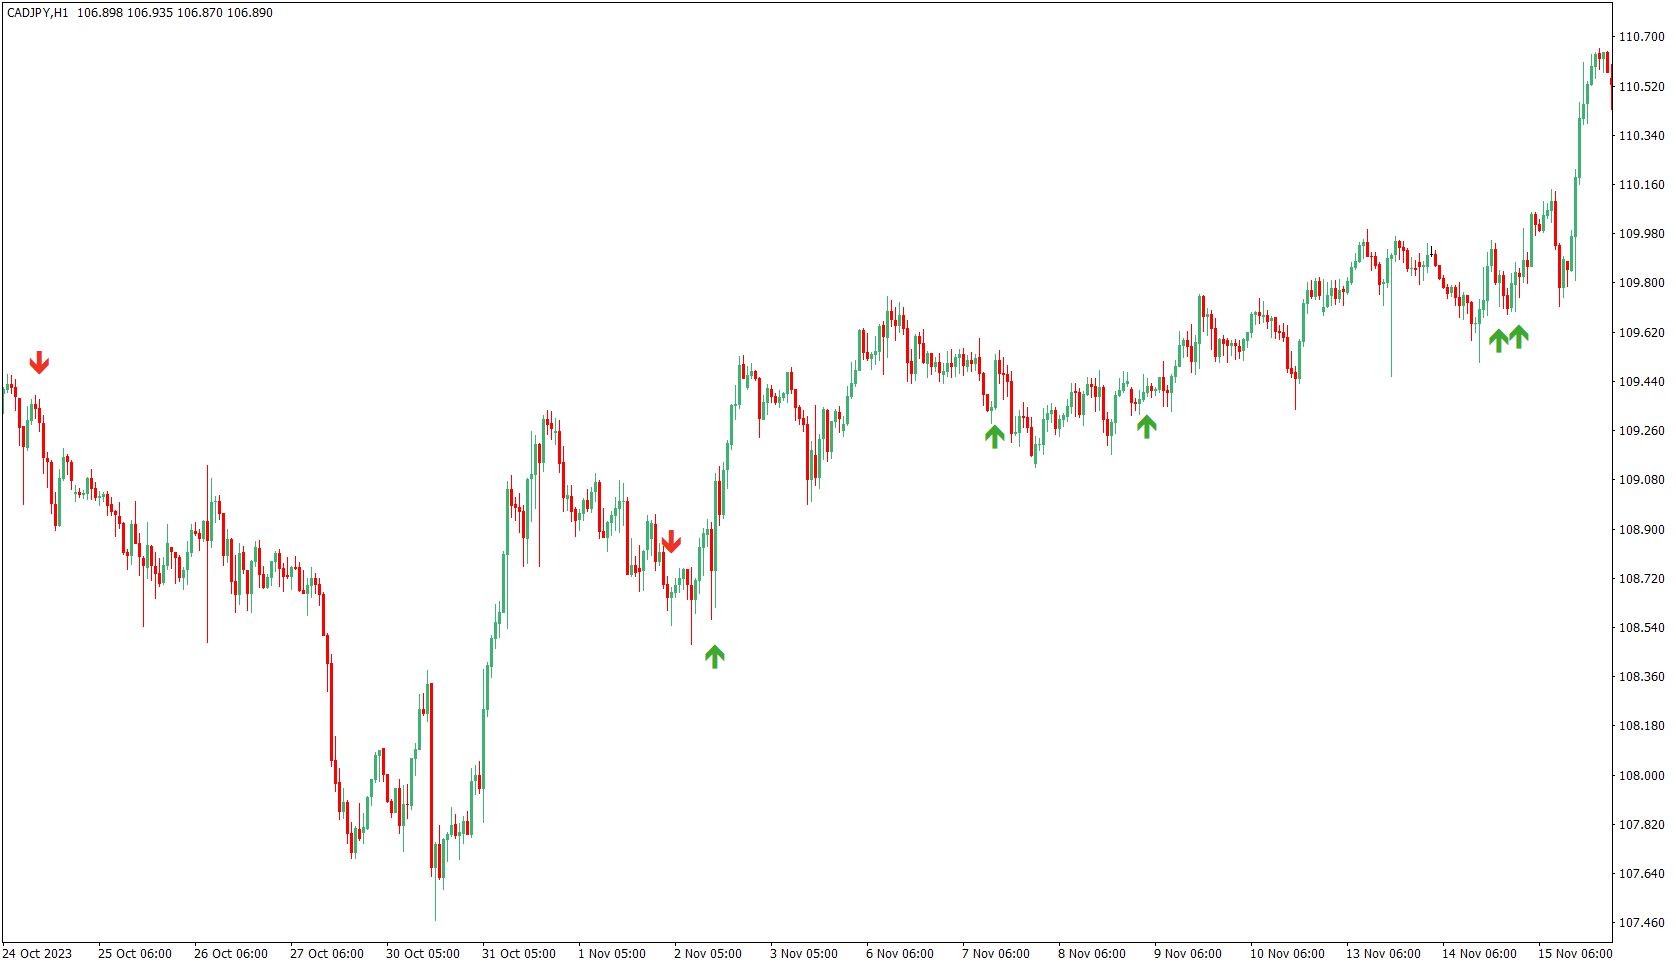
これはMACDに基づくトレンドフォローイングインディケーターで、200MAより上では買いのサイン、200MAより下では売りのサインを提供します。
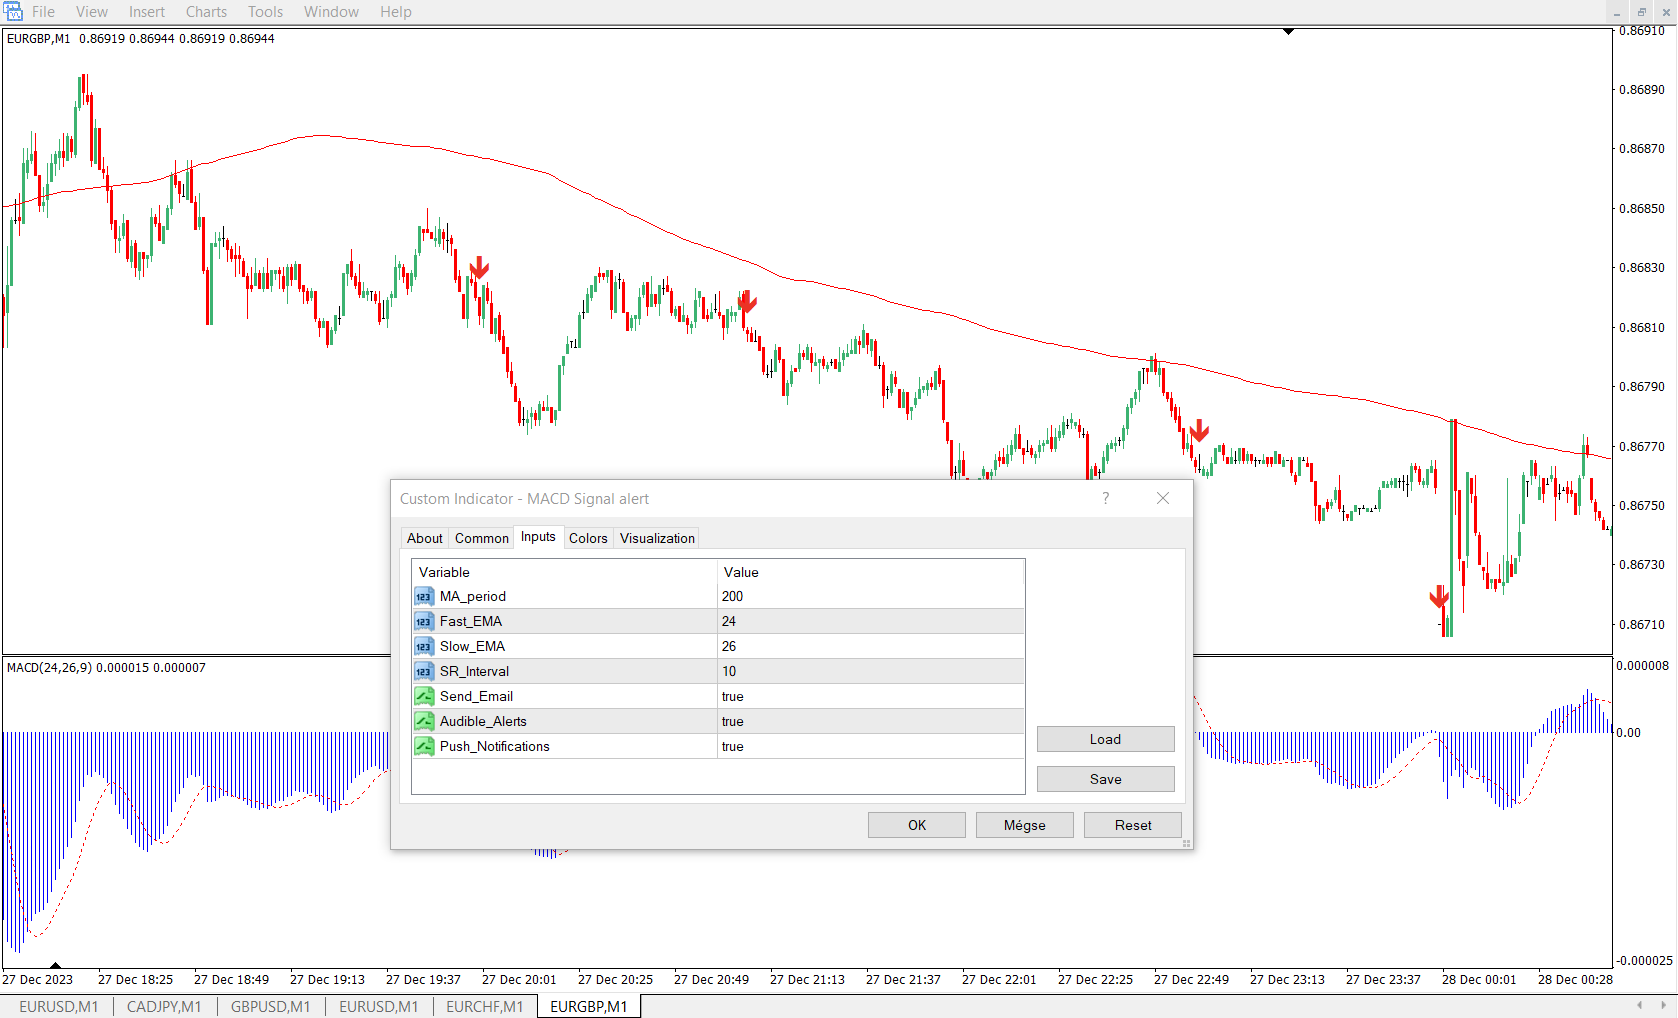
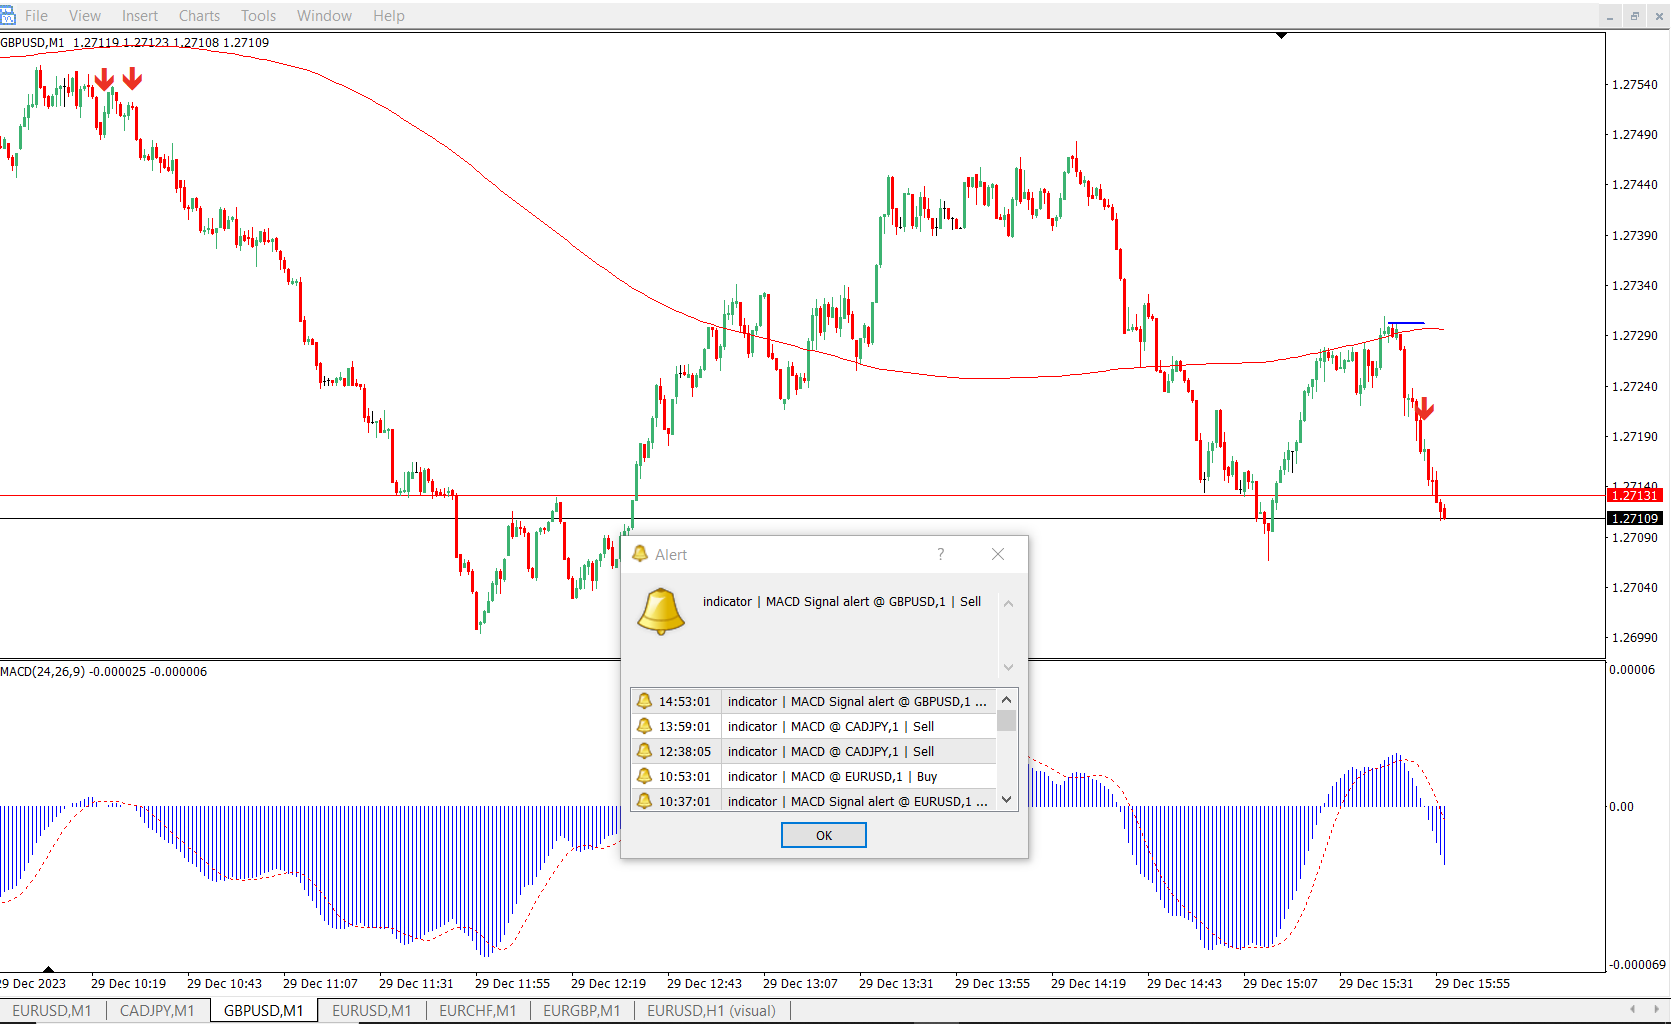
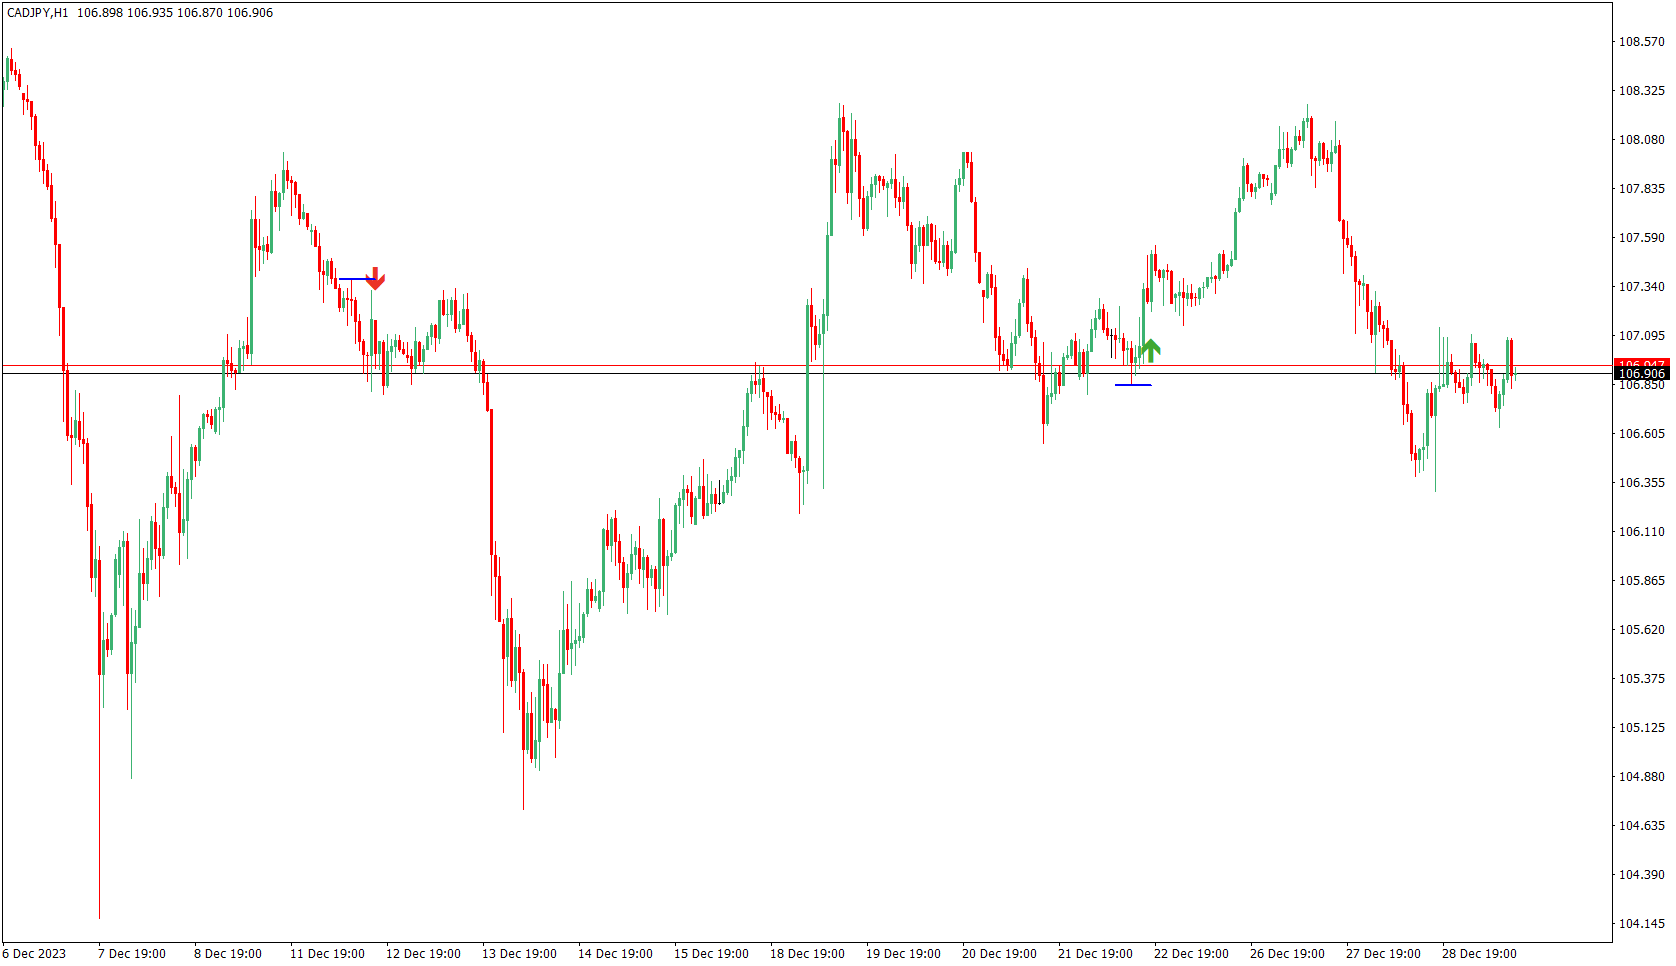
MACDがゼロラインをクロスすると信号が生成されます。インディケーターはサポートとレジスタンスのレベルも表示し、これはストップロスとして使用できます。調整可能なパラメータにはMA期間、MACDの高速EMA、遅速EMA、サポートレジスタンスの間隔が含まれます。最近のローソク足の最低点と最高点にプロットされます。
デフォルトの設定:
- SR間隔:10
- MA期間:200
- Fast EMA:24
- Slow EMA:26
- アラーム機能も含まれています。
これらの値を変更すると、より頻繁または少ない信号が発生する可能性があり、最も効果的な構成を確定するためにテストすることが推奨されています。
1または4時間の時間枠が推奨されていますが、任意の時間枠で機能することができます。このインディケーターは、Forex、株式、商品などを含むすべての取引インストゥルメントで機能します。
他の製品もこちらでチェックしてください:https://www.mql5.com/en/users/8587359/seller


Nice work