
PythonとMQL5を使用して初めてのグラスボックスモデルを作る
はじめに
グラスボックスアルゴリズムとは、完全に透明で本質的に理解しやすい機械学習アルゴリズムのことです。機械学習における予測精度と解釈可能性はトレードオフの関係にあるという従来の常識を覆し、比類ないレベルの精度と透明性を提供するからです。つまり、私たちがよく知っているブラックボックスアルゴリズムに比べ、デバッグやメンテナンス、反復の改善が飛躍的に容易です。ブラックボックスモデルとは、内部構造が複雑で容易に解釈できない機械学習モデルのことです。これらのモデルは、私たち人間には容易に理解できない、高次元で非線形な関係を表すことができます。
経験則として、ブラックボックスモデルは、グラスボックスモデルが同じレベルの精度を提供できないシナリオでのみ使用されるべきです。この記事では、グラスボックスモデルを構築し、それを採用することの潜在的な利点を理解します。グラスボックスモデルでMetaTrader 5端末を制御する2つの方法を探ります。
- レガシーアプローチ:これが最も簡単な方法です。MetaTrader 5に統合されたPythonライブラリを使用して、グラスボックスモデルをMetaTrader 5端末に接続するだけです。そこからMetaQuotes Language 5でエキスパートアドバイザー(EA)を構築し、グラスボックスモデルを支援し、効果を最大化します。
- 現代的アプローチ:これは、機械学習モデルをEAに統合するための推奨方法です。グラスボックスモデルをOpen Neural Network Exchange形式に書き出し、そのモデルをリソースとしてEAに直接読み込むことで、MetaTrader 5で利用可能なすべての便利な機能を活用し、グラスボックスモデルのパワーと融合させることができます。

図1:人工知能による人間の脳の模倣
ブラックボックスモデルとグラスボックスモデル
前述のように、従来の機械学習モデルのほとんどは、解釈や説明が難しいです。このクラスのモデルはブラックボックスモデルとして知られています。ブラックボックスモデルは、複雑で解釈しにくい内部構造を持つすべてのモデルを包含します。これは、モデルの主要なパフォーマンス指標を改善しようとする私たちにとって大きな問題となります。一方、グラスボックスモデルは、内部構造が透明でわかりやすく、さらに予測精度も高くて信頼できる機械学習モデルの集合体です。
Microsoft Researchの研究者、開発者、ドメインエクスパートのチームは、InterpretMLと呼ばれるPythonパッケージをオープンソース化し、この記事を書いている時点ではアクティブに維持しています。このパッケージには、ブラックボックスexplainerとグラスボックスモデルの包括的なスイートが含まれています。ブラックボックスexplainerは、ブラックボックスモデルの内部構造を理解しようとする一連のアルゴリズムです。InterpretMLに含まれるブラックボックスexplainer明アルゴリズムのほとんどは、モデル非依存的です。しかし、これらのブラックボックスexplainerは、ブラックボックスモデルの推定値しか与えることができません。このことがなぜ問題になるかは、この記事の次のセクションで説明します。InterpretMLにはグラスボックスモデルのスイートも含まれており、これらのモデルは、前例のない透明性でブラックボックスモデルの予測精度に匹敵します。これは、初心者であろうと専門家であろうと、機械学習を使用するすべての人に最適です。モデルの解釈可能性の価値は、ドメインや経験レベルを超越したものです。
詳細は次をご覧ください。
1.興味のある方は、InterpretMLドキュメントをご覧ください。
2.さらに、InterpretML白書を読むこともできます。
本稿ではInterpretMLを使い、pythonでグラスボックスモデルを構築します。グラスボックスモデルが、特徴エンジニアリングプロセスを導き、モデルの内部構造の理解を向上させるために、どのように重要な洞察を与えてくれるかを見ていきます。
ブラックボックスモデルの課題:不一致問題(Disagreement Problem)
ブラックボックスモデルの使用を止めたくなる理由のひとつは、「不一致問題」と呼ばれるものです。一言で言えば、同じモデルを評価する場合でも、説明の手法が異なれば、モデルの説明が大きく異なることがあるのです。説明技法は、ブラックボックスモデルの根本的な構造を洞察しようとするものです。モデルの説明には様々な考え方があり、それぞれの説明手法はモデルの動作の異なる側面に焦点を当てることができるため、基礎となるブラックボックスモデルについてそれぞれ異なる指標を推論することができます。不一致問題は未解決の研究分野であり、認識し、積極的に軽減すべき注意点です。
本稿では、読者がこの現象を独自に観察したことがない場合に備えて、不一致問題の実際のデモンストレーションをみます。
詳細は次をご覧ください。
1.不一致問題についてもっと知りたい方は、ハーバード大学、マサチューセッツ工科大学、ドレクセル大学、カーネギーメロン大学の優秀な卒業生たちによるこの優れた論文を読むことをお勧めします。
では、早速、不一致問題を実際に見てみましょう。
まず、分析に役立つpythonパッケージをインポートします。
#Import MetaTrader5 Python package
#pip install --upgrade MetaTrader5, if you don't have it installed
import MetaTrader5 as mt5

#Import datetime for selecting data
#Standard python package, no installation required
from datetime import datetime

#Plotting Data
#pip install --upgrade matplotlib, if you don't have it installed
import matplotlib.pyplot as plt

#Import pandas for handling data
#pip install --upgrade pandas, if you don't have it installed
import pandas as pd

#Import library for calculating technical indicators
#pip install --upgrade pandas-ta, if you don't have it installed
import pandas_ta as ta

#Scoring metric to assess model accuracy
#pip install --upgrade scikit-learn, if you don't have it installed
from sklearn.metrics import precision_score

#Import mutual information, a black-box explanation technique
from sklearn.feature_selection import mutual_info_classif

#Import permutation importance, another black-box explanation technique
from sklearn.inspection import permutation_importance

#Import our model
#pip install --upgrade xgboost, if you don't have it installed
from xgboost import XGBClassifier

#Plotting model importance
from xgboost import plot_importance
ここからMetaTrader 5端末への接続に移りますが、その前にログイン認証情報を指定する必要があります。
#Enter your account number
login = 123456789

#Enter your password
password = '_enter_your_password_'

#Enter your Broker's server
server = 'Deriv-Demo'
これで、MetaTrader 5端末を初期化し、同じ手順で取引口座にログインできます。
#We can initialize the MT5 terminal and login to our account in the same step
if mt5.initialize(login=login,password=password,server=server):
    print('Logged in successfully')
else:
    print('Failed To Log in')
ログインに成功しました。
MetaTrader 5端末にフルアクセスできるようになり、チャートデータ、ティックデータ、現在の気配値などをリクエストできるようになりました。
#To view all available symbols from your broker
symbols = mt5.symbols_get()

for index,value in enumerate(symbols):
    print(value.name)
Volatility 10 Index
Volatility 25 Index
Volatility 50 Index
Volatility 75 Index
Volatility 100 Index
Volatility 10 (1s) Index
Boom 1000 Index
Boom 500 Index
Crash 1000 Index
Crash 500 Index
Step Index
...
モデル化したい銘柄を特定したら、その銘柄のチャートデータをリクエストできるが、その前に、取り出したい日付の範囲を指定する必要があります。
#We need to specify the dates we want to use in our dataset
date_from = datetime(2019,4,17)
date_to = datetime.now()
これで、その銘柄のチャートデータをリクエストできます。
#Fetching historical data
data = pd.DataFrame(mt5.copy_rates_range('Boom 1000 Index',mt5.TIMEFRAME_D1,date_from,date_to))
プロットするために、データフレームの時間列を書式設定する必要があります。
#Let's convert the time from seconds to year-month-date
data['time'] = pd.to_datetime(data['time'],unit='s')

data
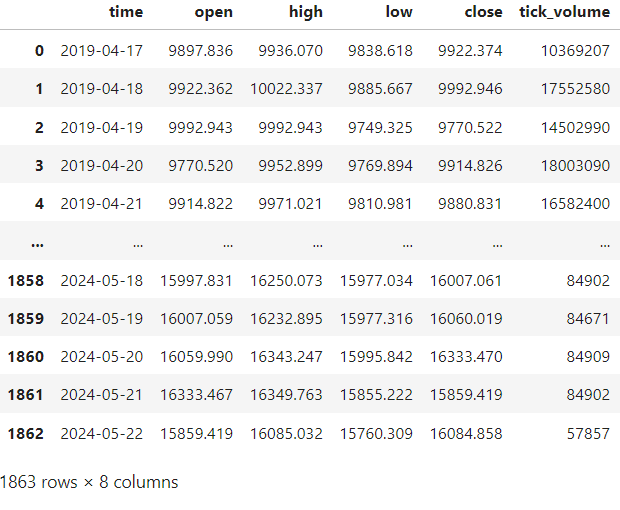
図2:データフレームでの人間が読める形式での時間表示 - real_volume列がゼロで埋められている
次に、データフレームに新しい機能を追加したり、テクニカル指標を計算したり、データフレームをクリーンアップしたりするのに役立つヘルパー関数を作成する必要があります。
#Let's create a function to preprocess our data
def preprocess(df):
    #All values of real_volume are 0 in this dataset, we can drop the column
    df.drop(columns={'real_volume'},inplace=True)
    #Calculating 14 period ATR
    df.ta.atr(length=14,append=True)
    #Calculating the growth in the value of the ATR, the second difference
    df['ATR Growth'] = df['ATRr_14'].diff().diff()
    #Calculating 14 period RSI
    df.ta.rsi(length=14,append=True)
    #Calculating the rolling standard deviation of the RSI
    df['RSI Stdv'] = df['RSI_14'].rolling(window=14).std()
    #Calculating the mid point of the high and low price
    df['mid_point'] = ( ( df['high'] + df['low'] ) / 2 )
    #We will keep track of the midpoint value of the previous day
    df['mid_point - 1'] = df['mid_point'].shift(1)
    #How far is our price from the midpoint?
    df['height'] = df['close'] - df['mid_point']
    #Drop any rows that have missing values
    df.dropna(axis=0,inplace=True)
データフレームの前処理関数を呼び出してみましょう。
preprocess(data)

data
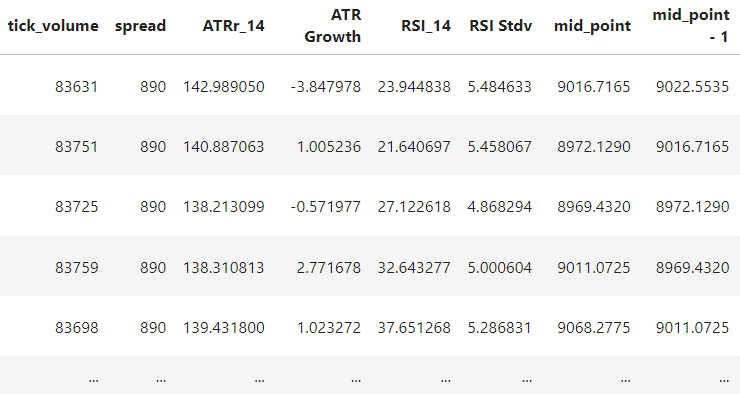
図3:前処理済みのデータフレーム
次の終値が今日の終値より大きいかどうかが目標となります。明日の終値が今日の終値より大きければ、目標は1になります。そうでなければ、目標は0となります。
#We want to predict whether tomorrow's close will be greater than today's close
#We can encode a dummy variable for that:
#1 means tomorrow's close will be greater.
#0 means today's close will be greater than tomorrow's.

data['target'] = (data['close'].shift(-1) > data['close']).astype(int)

data

#The first date is 2019-05-14, and the first close price is 9029.486, the close on the next day 2019-05-15 was 8944.461
#So therefore, on the first day, 2019-05-14, the correct forecast is 0 because the close price fell the following day.
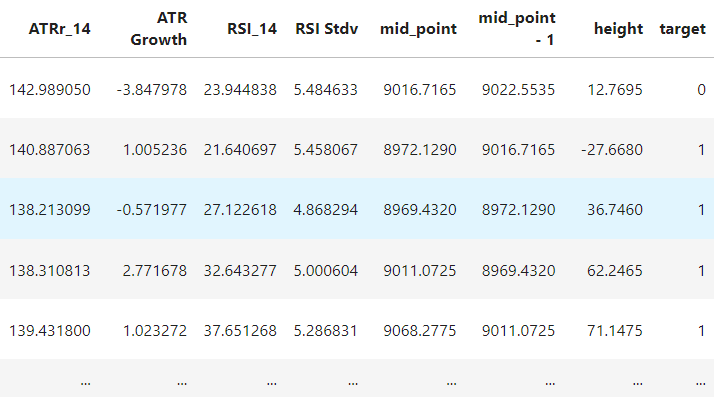
図4:目標作成
次に、ターゲットと予測因子を明確に定義してから、データを訓練セットとテストセットに分けます。これは時系列データであるため、無作為に2つのグループに分けることはできません。
#Seperating predictors and target
predictors = ['open','high','low','close','tick_volume','spread','ATRr_14','ATR Growth','RSI_14','RSI Stdv','mid_point','mid_point - 1','height']
target     = ['target']

#The training and testing split definition
train_start = 27
train_end = 1000

test_start = 1001
次に、訓練セットとテストセットを作成します。
#Train set
train_x = data.loc[train_start:train_end,predictors]
train_y = data.loc[train_start:train_end,target]

#Test set
test_x = data.loc[test_start:,predictors]
test_y = data.loc[test_start:,target]
これでブラックボックスモデルを適合させることができます。
#Let us fit our model
black_box = XGBClassifier()
black_box.fit(train_x,train_y)
テストセットでのモデルの予測を見てみましょう。
#Let's see our model predictions
black_box_predictions = pd.DataFrame(black_box.predict(test_x),index=test_x.index)
モデルの精度を評価しましょう。
#Assesing model prediction accuracy
black_box_score = precision_score(test_y,black_box_predictions)

#Model precision score
black_box_score
0.4594594594594595
モデルの精度は45%ですが、どの特徴がこれを達成するのに役立っていて、どの特徴が役立っていないのでしょうか。幸いなことに、XGBoostには特徴の重要度を測定する関数が内蔵されており、物事が簡単になっています。しかし、これはXGBoostのこの実装に特有のものであり、すべてのブラックボックスにこのような方法で特徴の重要性を簡単に示す便利な関数が含まれているわけではありません。 例えば、ニューラルネットワークやサポートベクトルマシンにはそれに相当する関数がないので、モデルをよりよく理解するためには、自分でモデルの重みを冷静に分析し、注意深く解釈する必要があります。XGBoostのplot_importance関数を使用すれば、モデルの内部を覗き見ることができます。
plot_importance(black_box)
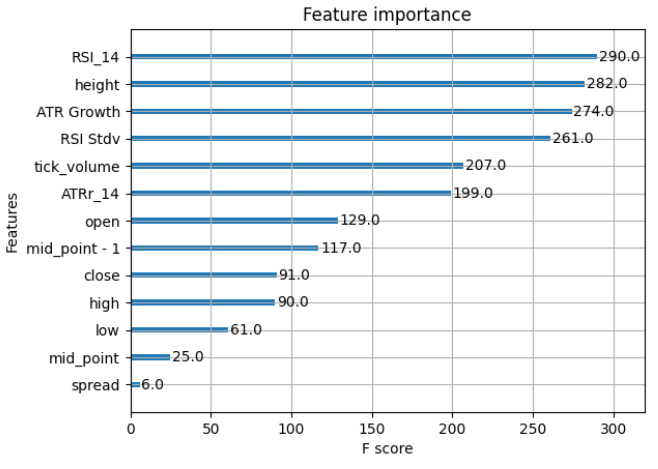
図5:XGBClassifierの特徴の重要性 - 表には交互作用項が含まれていないが、これは必ずしもそれらが存在しないということではない
さて、グランドトゥルースを確立したところで、「Permutation Importance」と呼ばれる最初のブラックボックス説明技法を見てみましょう。 Permutation Importanceは、各特徴の値を無作為にシャッフルし、モデルの損失関数の変化を測定することで、各特徴の重要度を推定しようとするものです。モデルがその特徴に依存すればするほど、それらの値を無作為にシャッフルした場合、そのパフォーマンスは悪化するからです。Permutation Importanceの利点と欠点について説明しましょう。
利点
- モデルにとらわれない:Permutation Importanceは、モデルやPermutation Importance関数のいずれにも前処理を必要とせず、どのようなブラックボックスモデルにも使用することができます。
- 解釈可能性:Permutation Importanceの結果は解釈しやすく、評価される基礎モデルに関係なく一貫して解釈されます。そのため、使いやすいツールとなっています。
- 非線形性に対応:Permutation Importanceが堅牢であり,予測変数と応答との間の非線形関係を捕捉するのに適しています。
- 異常値に対応:Permutation importanceは,予測変数の生の値に依存せず、モデルのパフォーマンスに対する特徴の影響に関係します。このアプローチは、生データに含まれる可能性のある異常値に対して堅牢です。
欠点
- 計算コスト:多くの特徴を持つ大規模なデータセットの場合、Permutation Importanceを計算するのは計算コストがかかります。各特徴を繰り返し、順列を計算し、モデルを評価し、次の特徴に移ってそのプロセスを繰り返さなければならないからです。
- 相関性のある特徴の課題:Permutation Importanceは、相関の強い特徴を評価するときに偏った結果を与えることがあります。
- モデルの複雑さに敏感:Permutation Importanceはモデルを問いませんが、複雑すぎるモデルは、その特徴が並べ替えられたときに高い分散を示す可能性があり、信頼できる結論を導き出すことが難しくなります。
- 特徴の独立性:Permutation Importanceは、データセットの特徴が独立であり、結果なしに無作為に並べ替えられることを仮定しています。計算は簡単になりますが、現実の世界ではほとんどの特徴が互いに依存しており、Permutation Importanceでは拾いきれない相互作用があります。
ブラックボックス分類器のPermutation Importanceを計算してみましょう。
#Now let us observe the disagreement problem
black_box_pi = permutation_importance(black_box,train_x,train_y)

# Get feature importances and standard deviations
perm_importances = black_box_pi.importances_mean
perm_std = black_box_pi.importances_std

# Sort features based on importance
sorted_idx = perm_importances.argsort()
計算されたPermutation Importanceの値をプロットしてみましょう。
#We're going to utilize a bar histogram
plt.barh(range(train_x.shape[1]), perm_importances[sorted_idx], xerr=perm_std[sorted_idx])
plt.yticks(range(train_x.shape[1]), train_x.columns[sorted_idx])
plt.xlabel('Permutation Importance')
plt.title('Permutation Importances')
plt.show() 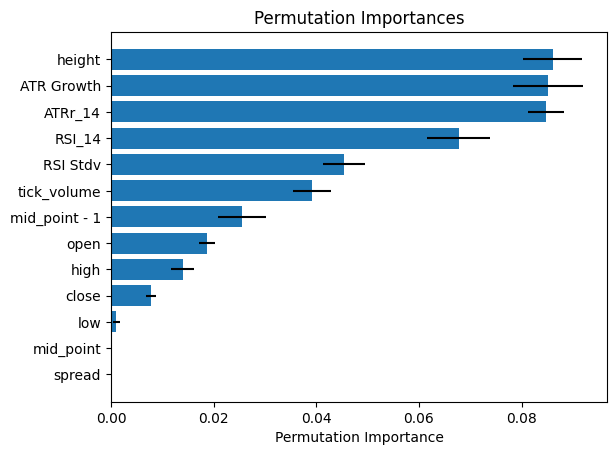
図6:ブラックボックスのPermutation Importance
Permutation Importanceアルゴリズムによる計算によると、ATRの読み取り値は私たちが設計した中で最も情報量の多い特徴ですが、グランドトゥルースから、そうではないことがわかっています。ATRは6位にランクされています。ATR Growthが最も重要な特徴です。2番目に重要な特徴はheightでしたが、Permutation ImportanceではATR Growthの方が重要でした。3番目に重要な特徴はRSIの測定値でしたが、Permutation Importanceではheightがより重要であると算出されました。
これはブラックボックス説明技法の問題点です。ブラックボックス説明技法は、特徴の重要性の推定には非常に適していますが、せいぜい推定に過ぎないため、間違いが生じやすくなります。それだけでなく、同じモデルを評価する際にも意見が食い違うことがあります。自分の目で確かめましょう。
第2のブラックボックス説明技法として、相互情報アルゴリズムを使用します。 相互情報は、ある特徴の価値を認識することによってもたらされる不確実性の減少を測定します。
#Let's see if our black-box explainers will disagree with each other by calculating mutual information
black_box_mi = mutual_info_classif(train_x,train_y)
black_box_mi = pd.Series(black_box_mi, name="MI Scores", index=train_x.columns)
black_box_mi = black_box_mi.sort_values(ascending=False)

black_box_mi
RSI_14: 0.014579
open: 0.010044
low: 0.005544
mid_point-1: 0.005514
close: 0.002428
tick_volume: 0.001402
high: 0.000000
spread: 0.000000
ATRr_14: 0.000000
ATR Growth: 0.000000
RSIStdv: 0.000000
mid_point: 0.000000
height: 0.000000
Name:MI Scores, dtype: float64
ご覧のように、重要度ランキングは大きく異なっています。相互情報は、私たちのグランドトゥルースやPermutation Importance計算と比較して、ほぼ逆の順序で特徴量をランク付けしています。もし、この例のようなグランドトゥルースがなかったら、どちらのexplainerに頼ることになるでしょうか。 さらに、5つの異なる説明技法を使用して、それぞれが異なる重要度ランキングを出したとしたらどうするでしょうか。現実世界の仕組みに関する自分の信念に沿ったランキングを選択すれば、確証バイアスと呼ばれる別の問題への扉を開くことになります。確証バイアスとは、自分の既存の信念と矛盾する証拠を無視し、たとえそれが真実でなくても、自分が真実だと信じていることを積極的に正当化しようとすることです。
グラスボックスモデルの利点
グラスボックスモデルは、完全に透明で非常に分かりやすいため、ブラックボックス説明技法の必要性を完全に代替します。これらは、金融領域を含む多くの領域における不一致問題を解決する可能性を秘めています。それだけで十分な理由にならないとすれば、グラスボックスモデルのデバッグは、同レベルの柔軟性を持つブラックボックスモデルのデバッグよりも指数関数的に簡単だということです。これによって、最も重要な資源である時間を節約することができます。そして何より素晴らしいのは、グラスボックスであることでモデルの精度を損なうことがなく、両方の長所を兼ね備えていることです。経験則として、ブラックボックスは、グラスボックスでは同レベルの精度を達成できないシナリオでのみ使用されるべきです。
さて、最初のグラスボックスモデルを作り、そのパフォーマンスを分析し、精度を向上させることに目を向けましょう。ここから、グラスボックスモデルをMetaTrader 5端末に接続し、グラスボックスモデルを使った取引を開始する方法について説明します。次に、MetaQuotes Language 5を使用して、グラスボックスモデルを支援するEAを構築します。そして最後に、MetaTrader 5とグラスボックスモデルの可能性を最大限に発揮できるように、グラスボックスモデルをOpen Neural Network Exchange形式に書き出します。
Pythonを使用した初めてのグラスボックスモデルの構築は簡単
コードを読みやすくするために、ブラックボックスモデルを構築するために使用したPythonスクリプトとは別のPythonスクリプトでグラスボックスを構築します。ただし、ログイン、データの取得、データの前処理など、ほとんどのことは変わりません。したがって、これらのステップをもう一度説明することはせず、グラスボックスモデル特有のステップのみに焦点を当てることにします。
まずはInterpretMLをインストールします。
#Installing Interpret ML
pip install --upgrade interpret
次に依存関係を読み込みます。この記事では、interpretパッケージの3つのモジュールに焦点を当てます。1つ目はグラスボックスモデルそのものであり、2つ目はモデルの内部を見ることができる便利なモジュールで、この情報をインタラクティブなGUIダッシュボードで表示します。最後のパッケージを使用すると、モデルのパフォーマンスを1つのグラフで視覚化することができます。その他のパッケージについてはすでに述べたとおりです。
#Import MetaTrader5 package
import MetaTrader5 as mt5

#Import datetime for selecting data
from datetime import datetime

#Import matplotlib for plotting
import matplotlib.pyplot as plt

#Intepret glass-box model for classification
from interpret.glassbox import ExplainableBoostingClassifier

#Intepret GUI dashboard utility
from interpret import show

#Visualising our model's performance in one graph
from interpret.perf import ROC

#Pandas for handling data
import pandas as pd

#Pandas-ta for calculating technical indicators
import pandas_ta as ta

#Scoring metric to assess model accuracy
from sklearn.metrics import precision_score
次に、ログイン認証情報を作成し、前回と同じようにMT5端末にログインします。このステップは省略されます。
そこから、先ほどと同じようにモデル化したい銘柄を選択します。このステップは省略されます。
次に、先ほどと同じように、モデル化したいデータの日付範囲を指定します。このステップは省略されます。
そして、前と同じように過去のデータを取得することができます。このステップは省略されます。
そこからは、上で説明したのと同じ前処理ステップを踏みます。このステップは省略されます。
データが前処理されたら、先ほどと同じようにターゲットを追加します。このステップは省略されます。
その後、前回と同じように訓練テストの分割をおこないます。このステップは省略されます。訓練テストの分割がランダムでないことを確認してください。自然な時間順序を守らなければ、結果は損なわれ、将来のパフォーマンスについて過度に楽観的なイメージを描くことになります。
これでグラスボックスモデルが完成しました。
#Let us fit our glass-box model
#Please note this step can take a while, depending on your computational resources
glass_box = ExplainableBoostingClassifier()
glass_box.fit(train_x,train_y)
グラスボックスモデルの内部を見ることができます。
#The show function provides an interactive GUI dashboard for us to interface with out model
#The explain_global() function helps us find what our model found important and allows us to identify potential bias or unintended flaws
show(glass_box.explain_global())
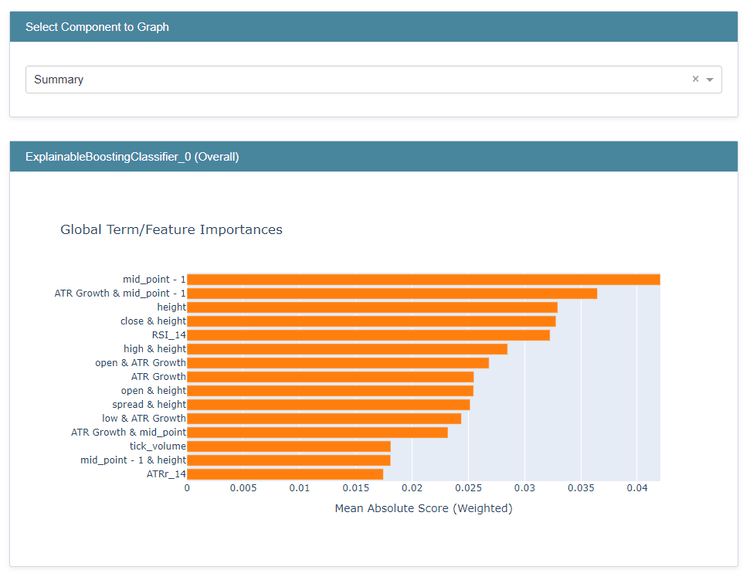
図7:グラスボックスの大域的な状態
要約統計の解釈は非常に重要ですが、その前にまず重要な命名法を確認しておきましょう。「大域的なターム」または「大域的な状態」は、モデル全体の状態を要約します。これは、モデルがどの特徴を有益と判断したかの概要を示してくれます。これは「局所的なターム」や「局所的な状態」と混同してはなりません。局所的な状態は、個々のモデルの予測を説明するために使われ、モデルがなぜその予測をしたのか、どの特徴が個々の予測に影響を与えたのかを理解するのに役立ちます。
グラスボックスモデルの大域的な状態に戻ります。見てわかるように、このモデルは遅行中間点の値が非常に有益であることを発見しました。それだけでなく、ATR Growthと遅行中間点値の間に相互作用項がある可能性も発見しました。heightは3番目に重要な特徴で、終値とheightの交互作用項がそれに続きました。このグラスボックスモデルを理解するために、追加のツールは一切必要ありません。これにより、意見の不一致問題と確証バイアスに対する扉が完全に閉ざされます。大域的な状態の情報は、特徴エンジニアリングにおいて非常に貴重です。より良い機能をエンジニアリングするために、今後の取り組みをどこに向けるべきかが示されているからです。グラスボックスのパフォーマンスを見てみましょう。
グラスボックス予想を入手します。
#Obtaining glass-box predictions
glass_box_predictions = pd.DataFrame(glass_box.predict(test_x))
次にグラスボックスの精度を測定します。
glass_box_score = precision_score(test_y,glass_box_predictions)

glass_box_score
0.49095022624434387
私たちのグラスボックスの精度は49%です。XGBClassifierと比較すると、明らかにExplainable Boosting Classifierの方が自重があります。これは、明瞭度を損なうことなく高い精度を実現するグラスボックスモデルの威力を証明するものです。
また、グラスボックスモデルから各予測に対する個別の説明を取得し、どの特徴がその予測に影響を与えたかを粒度レベルで理解することができます。これらは局所的な説明と呼ばれ、Explainable Boosting Classifierから取得するのは簡単です。
#We can also obtain individual explanations for each prediction
show(glass_box.explain_local(test_x,test_y))
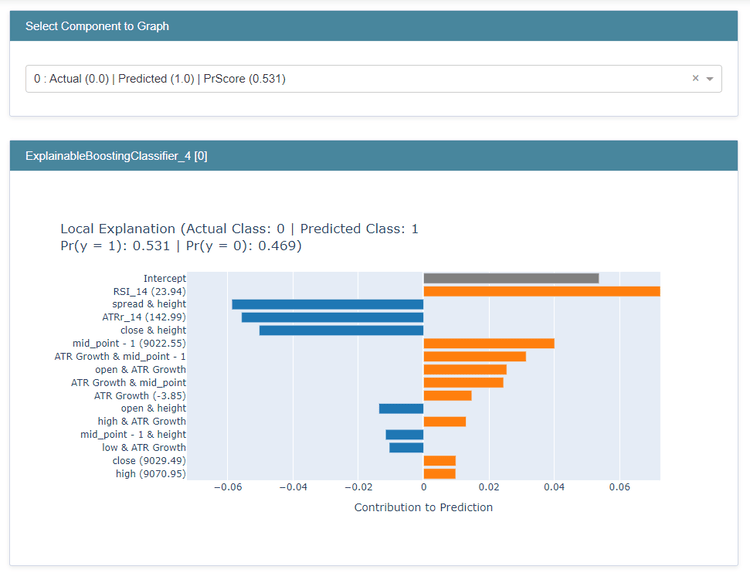
図8:Explainable Boosting Classifierによる局所的説明
最初のドロップダウンメニューで、それぞれの予測をスクロールし、より理解したい予測を選択することができます。
そこから、実際のクラスと予測されたクラスを見ることができます。この場合、実際のクラスは0であり、終値が下落したことを意味しますが、私たちはそれを1と分類しました。また、各クラスの推定確率もそれぞれ表示され、私たちのモデルが次のローソク足が高く閉じる確率を53%と誤って推定していることがわかります。推定確率に対する各特徴の寄与の内訳も示されています。青で示した特徴は、私たちのモデルによる予測に対して貢献しており、オレンジで示した特徴は、私たちのモデルによる予測に貢献しています。つまり、RSIがこの誤判定に最も寄与しているが、スプレッドとheightの交互作用項が正しい方向を指し示していたことを意味します。これらの特徴はさらに設計する価値があるかもしれませんが、結論に達する前に、局所的な説明をより厳密に調査する必要があります。
ここでは、ROC(Receiver Operating Characteristic、受受信者操作特性)として知られる1つのグラフを用いて、モデルのパフォーマンスを検証します。ROCグラフによって、分類器のパフォーマンスを簡単に評価することができます。曲線下面積(AUC)に注目しています。理論的には、完璧な分類器は曲線下面積の合計が1になります。このため、1つのグラフだけで簡単に分類器を評価することができます。
glass_box_performance = ROC(glass_box.predict_proba).explain_perf(test_x,test_y, name='Glass Box')
show(glass_box_performance)
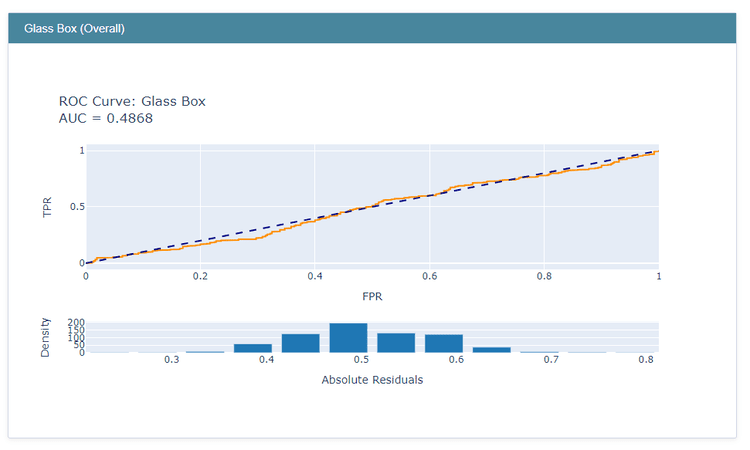
図9:グラスボックスモデルのROCチャート
グラスボックスモデルのAUCは0.49でした。この単純な指標で、私たち人間にとって解釈可能な単位を使用してモデルのパフォーマンスを評価することができます。さらに、この曲線はモデルに依存しないので、基礎となる分類技法に関係なく、異なる分類器を比較するために使用することができます。
ガラスボックスモデルをMT5端末に接続する
ここが踏ん張りどころで、まずはシンプルな方法でグラスボックスモデルをMT5端末に接続します。
まず、経常収支の状況を追ってみましょう。
#Fetching account Info
account_info = mt5.account_info()

# getting specific account data
initial_balance = account_info.balance
initial_equity = account_info.equity

print('balance: ', initial_balance)
print('equity: ', initial_equity)
balance:912.11 equity:912.11
すべての銘柄を取得します。
symbols = mt5.symbols_get()
グローバル変数をいくつか設定します。
#Trading global variables
#The symbol we want to trade
MARKET_SYMBOL = 'Boom 1000 Index'

#This data frame will store the most recent price update
last_close = pd.DataFrame()

#We may not always enter at the price we want, how much deviation can we tolerate?
DEVIATION = 100

#For demonstrational purposes we will always enter at the minimum volume
#However,we will not hardcode the minimum volume, we will fetch it dynamically
VOLUME = 0
#How many times the minimum volume should our positions be
LOT_MUTLIPLE = 1

#What timeframe are we working on?
TIMEFRAME = mt5.TIMEFRAME_D1
取引数量をハードコードするのではなく、証券会社から動的に最小許容取引数量を取得し、無効な注文を送らないようにするため、それに何らかの係数を掛けます。そこで本稿では、注文の大きさを最小量との相対的な関係で考えることにします。
この場合、すべての取引を最小取引数量で、またはファクター1を使用して開始します。
for index,symbol in enumerate(symbols):
    if symbol.name == MARKET_SYMBOL:
        print(f"{symbol.name} has minimum volume: {symbol.volume_min}")
        VOLUME = symbol.volume_min * LOT_MULTIPLE
ブーム1000指数の出来高は最小:0.2
次に、取引を開始するヘルパー関数を定義します。
# function to send a market order
def market_order(symbol, volume, order_type, **kwargs):
    #Fetching the current bid and ask prices
    tick = mt5.symbol_info_tick(symbol)

    #Creating a dictionary to keep track of order direction
    order_dict = {'buy': 0, 'sell': 1}
    price_dict = {'buy': tick.ask, 'sell': tick.bid}

    request = {
        "action": mt5.TRADE_ACTION_DEAL,
        "symbol": symbol,
        "volume": volume,
        "type": order_dict[order_type],
        "price": price_dict[order_type],
        "deviation": DEVIATION,
        "magic": 100,
        "comment": "Glass Box Market Order",
        "type_time": mt5.ORDER_TIME_GTC,
        "type_filling": mt5.ORDER_FILLING_FOK,
    }

    order_result = mt5.order_send(request)
    print(order_result)
    return order_result
次に、チケット番号に基づいて取引をクローズするヘルパー関数を定義します。
# Closing our order based on ticket id
def close_order(ticket):
    positions = mt5.positions_get()

    for pos in positions:
        tick = mt5.symbol_info_tick(pos.symbol) #validating that the order is for this symbol
        type_dict = {0: 1, 1: 0}  # 0 represents buy, 1 represents sell - inverting order_type to close the position
        price_dict = {0: tick.ask, 1: tick.bid} #bid ask prices

        if pos.ticket == ticket:
            request = {
                "action": mt5.TRADE_ACTION_DEAL,
                "position": pos.ticket,
                "symbol": pos.symbol,
                "volume": pos.volume,
                "type": type_dict[pos.type],
                "price": price_dict[pos.type],
                "deviation": DEVIATION,
                "magic": 100,
                "comment": "Glass Box Close Order",
                "type_time": mt5.ORDER_TIME_GTC,
                "type_filling": mt5.ORDER_FILLING_FOK,
            }

            order_result = mt5.order_send(request)
            print(order_result)
            return order_result

    return 'Ticket does not exist'
サーバーに大量のデータをリクエストし続ける必要はないので、日付の範囲も更新します。
#Update our date from and date to
date_from = datetime(2023,11,1)
date_to = datetime.now()
また、グラスボックスモデルから予測を取得し、その予測を売買シグナルとして使用する関数も必要です。
#Get signals from our glass-box model
def ai_signal():
    #Fetch OHLC data
    df = pd.DataFrame(mt5.copy_rates_range(market_symbol,TIMEFRAME,date_from,date_to))
    #Process the data
    df['time'] = pd.to_datetime(df['time'],unit='s')
    df['target'] = (df['close'].shift(-1) > df['close']).astype(int)
    preprocess(df)
    #Select the last row
    last_close = df.iloc[-1:,1:]
    #Remove the target column
    last_close.pop('target')
    #Use the last row to generate a forecast from our glass-box model
    #Remember 1 means buy and 0 means sell
    forecast = glass_box.predict(last_close)
    return forecast[0]
次に、Pythonグラスボックス取引ボットの本体を定義します。
#Now we define the main body of our Python Glass-box Trading Bot
if __name__ == '__main__':
    #We'll use an infinite loop to keep the program running
    while True:
        #Fetching model prediction
        signal = ai_signal()

        #Decoding model prediction into an action
        if signal == 1:
            direction = 'buy'
        elif signal == 0:
            direction = 'sell'

        print(f'AI Forecast: {direction}')

        #Opening A Buy Trade
        #But first we need to ensure there are no opposite trades open on the same symbol
        if direction == 'buy':
            #Close any sell positions
            for pos in mt5.positions_get():
                if pos.type == 1:
                    #This is an open sell order, and we need to close it
                    close_order(pos.ticket)

            if not mt5.positions_totoal():
                #We have no open positions
                market_order(MARKET_SYMBOL,VOLUME,direction)

        #Opening A Sell Trade
        elif direction == 'sell':
            #Close any buy positions
            for pos in mt5.positions_get():
                if pos.type == 0:
                    #This is an open buy order, and we need to close it
                    close_order(pos.ticket)

            if not mt5.positions_get():
                #We have no open positions
                market_order(MARKET_SYMBOL,VOLUME,direction)

        print('time: ', datetime.now())
        print('-------\n')
        time.sleep(60)
AI Forecast: sell
time: 2023-12-0415:31:31.569495
-------
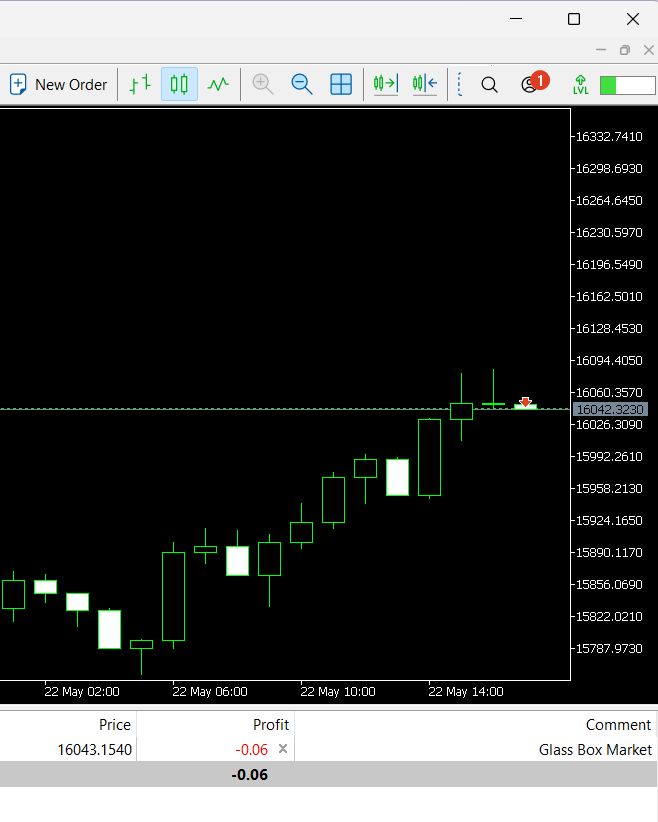
図10:Pythonで作られたグラスボックス取引ボットが利益を上げている
グラスボックスモデルを支援するEAの構築
次に、MQL5を使用したグラスボックスモデルのアシスタントの構築に移ります。ATRの読みに基づいて損切り(SL)と利益確定(TP)を動かすEAを作ります。Pythonの統合モジュールを使用してこのタスクを実行するのは、1分ごとや1時間ごとといった低い頻度で更新しない限り、悪夢となるでしょう。SLとTPは刻々と更新され、それ以外は私たちの厳しい要求を満たしません。エントリからSL/TPまでのギャップの大きさを指定する、ユーザーからの2つの入力が必要です。ATRの読みにユーザー入力を掛けて、SLまたはTPからエントリーポイントまでの高さを計算します。そして2つ目の入力は、単純にATRの期間です。
//Meta Properties
#property copyright "Gamuchirai Ndawana"
#property link "https://twitter.com/Westwood267"

//Classes for managing Trades And Orders
#include  <Trade\Trade.mqh>
#include <Trade\OrderInfo.mqh>

//Instatiating the trade class and order manager
CTrade trade;
class COrderInfo;

//Input variables
input double atr_multiple =0.025;  //How many times the ATR should the SL & TP be?
input int atr_period = 200;      //ATR Period

//Global variables
double ask, bid,atr_stop; //We will use these variables to determine where we should place our ATR
double atr_reading[];     //We will store our ATR readings in this arrays
int    atr;               //This will be our indicator handle for our ATR indicator
int min_volume;

int OnInit(){
                  //Check if we are authorized to use an EA on the terminal
                  if(!TerminalInfoInteger(TERMINAL_TRADE_ALLOWED)){
                           Comment("Press Ctrl + E To Give The Robot Permission To Trade And Reload The Program");
                           //Remove the EA from the terminal
                           ExpertRemove();
                           return(INIT_FAILED);
                  }

                  //Check if we are authorized to use an EA on the terminal
                  else if(!MQLInfoInteger(MQL_TRADE_ALLOWED)){
                            Comment("Reload The Program And Make Sure You Clicked Allow Algo Trading");
                            //Remove the EA from the terminal
                            ExpertRemove();
                            return(INIT_FAILED);
                  }

                  //If we arrive here then we are allowed to trade using an EA on the Terminal
                  else{
                        //Symbol information
                        //The smallest distance between our point of entry and the stop loss
                        min_volume = SymbolInfoInteger(_Symbol,SYMBOL_TRADE_STOPS_LEVEL);//SymbolInfoDouble(_Symbol,SYMBOL_VOLUME_MIN)
                        //Setting up our ATR indicator
                        atr = iATR(_Symbol,PERIOD_CURRENT,atr_period);
                        return(INIT_SUCCEEDED);
                  }
}

void OnDeinit(const int reason){

}

void OnTick(){
               //Get the current ask
               ask = SymbolInfoDouble(_Symbol,SYMBOL_ASK);
               //Get the current bid
               bid = SymbolInfoDouble(_Symbol,SYMBOL_BID);
               //Copy the ATR reading our array for storing the ATR value
               CopyBuffer(atr,0,0,1,atr_reading);
               //Set the array as series so the natural time ordering is preserved
               ArraySetAsSeries(atr_reading,true);

               //Calculating where to position our stop loss
               //For now we'll keep it simple, we'll add the minimum volume and the current ATR reading and multiply it by the ATR multiple
               atr_stop = ((min_volume + atr_reading[0]) * atr_multiple);

               //If we have open positions we should adjust the stop loss and take profit
               if(PositionsTotal() > 0){
                        check_atr_stop();
               }
}

//--- Functions
//This funciton will update our S/L & T/P based on our ATR reading
void check_atr_stop(){

      //First we iterate over the total number of open positions
      for(int i = PositionsTotal() -1; i >= 0; i--){

            //Then we fetch the name of the symbol of the open position
            string symbol = PositionGetSymbol(i);

            //Before going any furhter we need to ensure that the symbol of the position matches the symbol we're trading
                  if(_Symbol == symbol){
                           //Now we get information about the position
                           ulong ticket = PositionGetInteger(POSITION_TICKET); //Position Ticket
                           double position_price = PositionGetDouble(POSITION_PRICE_OPEN); //Position Open Price
                           double type = PositionGetInteger(POSITION_TYPE); //Position Type
                           double current_stop_loss = PositionGetDouble(POSITION_SL); //Current Stop loss value

                           //If the position is a buy
                           if(type == POSITION_TYPE_BUY){
                                  //The new stop loss value is just the ask price minus the ATR stop we calculated above
                                  double atr_stop_loss = (ask - (atr_stop));
                                  //The new take profit is just the ask price plus the ATR stop we calculated above
                                  double atr_take_profit = (ask + (atr_stop));

                                  //If our current stop loss is less than our calculated ATR stop loss
                                  //Or if our current stop loss is 0 then we will modify the stop loss and take profit
                                 if((current_stop_loss < atr_stop_loss) || (current_stop_loss == 0)){
                                       trade.PositionModify(ticket,atr_stop_loss,atr_take_profit);
                                 }
                           }

                            //If the position is a sell
                           else if(type == POSITION_TYPE_SELL){
                                     //The new stop loss value is just the bid price plus the ATR stop we calculated above
                                     double atr_stop_loss = (bid + (atr_stop));
                                     //The new take profit is just the bid price minus the ATR stop we calculated above
                                     double atr_take_profit = (bid - (atr_stop));

                                 //If our current stop loss is greater than our calculated ATR stop loss
                                 //Or if our current stop loss is 0 then we will modify the stop loss and take profit
                                 if((current_stop_loss > atr_stop_loss) || (current_stop_loss == 0)){
                                       trade.PositionModify(ticket,atr_stop_loss,atr_take_profit);
                                 }
                           }
                  }
            }
}
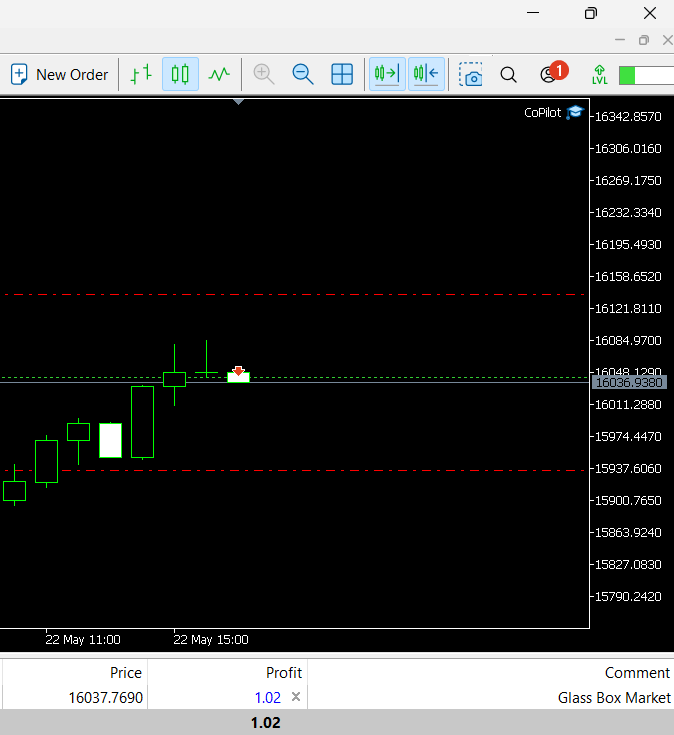
図11:EAはグラスボックスモデルと密接に連携している
グラスボックスモデルをOpen Neural Network Exchange (ONNX)形式に書き出します。

図12:Open Neural Network Exchangeのロゴ
Open Neural Network Exchange (ONNX)は、あらゆる機械学習モデルを表現するためのオープンソースプロトコルです。世界中のさまざまな業種の企業による大規模で広範な集団的努力によって、広くサポートされ、維持されています。マイクロソフト、フェイスブック、MATLAB、IBM、クアルコム、ファーウェイ、インテル、AMDなどの企業が名を連ねています。本稿執筆時点では、ONNXは、どのフレームワークで開発されたかにかかわらず、あらゆる機械学習モデルを表現するための普遍的な標準形式であり、さらに、機械学習モデルを異なるプログラミング言語や環境で開発展開することを可能にしています。どうしてこんなことが可能なのか不思議に思われるかもしれませんが、核となる考え方は、どんな機械学習モデルもノードとエッジのグラフとして表現できるということです。各ノードは数学的演算を表し、各エッジはデータの流れを表します。このシンプルな表現を使用すれば、どのような機械学習モデルも、それを作ったフレームワークに関係なく表現することができます。
ONNXモデルができたら、ONNXモデルを実行するエンジンが必要です。これはONNXランタイムの責任です。ONNXランタイムは、データセンターのスーパーコンピュータからポケットの中の携帯電話、そしてその間にあるあらゆるものまで、さまざまなデバイス上でONNXモデルを効率的に実行し、展開する役割を担っています。
私たちの場合、ONNXによって機械学習モデルをEAに統合し、本質的にそれ自身の頭脳を持つEAを構築することができます。MetaTrader 5端末は、履歴データで安全かつ確実にアドバイザーをテストするための一連のツールを提供し、さらには、EAをテストする推奨方法であるウォークフォワードテストを実行するためのツールも提供します。ウォークフォワードテストとは、EAをリアルタイムで、あるいはモデルが見た最後の訓練日より前の任意の期間で実行することです。これは、訓練で見たことのないデータに扱うモデルの頑健性をテストするのに最適な方法であり、さらに、訓練したデータを使用してモデルをバックテストすることで、自分自身を欺くことを防ぐことができます。
前回と同じように、ONNXモデルを書き出しするためのコードを、この記事でこれまで使用してきた残りのコードから分離して、コードを読みやすくしておきます。さらに、実用的な実装を単純化するために、入力として必要なパラメータの数を減らします。ONNXモデルの入力として、以下の特徴だけを選択しました。
1.ラグの高さ:この場合の高さは、次のように定義されることを覚えておいてください:(((高値+安値)/2)-終値)と定義されるので、遅行高値は高値の前回の値です。
2.高さの伸び:高さの伸びは、高さの測定値の二次導関数の推定値として機能します。これは、連続する過去の高さの値の差を2回取ることによって達成されます。得られた値から、高さの変化率を知ることができます。もっと簡単に言えば、高さが時間とともに加速度的に伸びているのか、それとも減速しているのかを理解するのに役立ちます。
3.中間点:この場合の中間点は((High + Low) / 2)として定義されることを覚えておいてください。
4.中間点の伸び:中間点の伸びは、中間点の測定値の二次微分を表す派生特徴です。これは、連続する過去の中間値の差を2回取ることによって達成されます。その結果、中間点の変化率を知ることができます。具体的には、中間点が加速度的に伸びているのか、それとも減速しているのかを示します。より簡単で専門的でない言葉で言えば、中間点がゼロからどんどん離れていくのか、ゼロにどんどん近づいていくのかを理解するのに役立ちます。
記事の前半では「Boom 1000 Index」の銘柄をモデル化しましたが、今回は「Volatility 75 Index」銘柄をモデル化します。
また、EAは、前に見たようにATR読み取り値を使用して動的にSL/TPポジションを自動的に配置します。さらに、利益が特定のしきい値を超えた場合に別のポジションを自動的に追加する機能も提供します。
ONNXとebm2onnxの2つの新しいインポートを除き、ほとんどのインポートは変わりません。これら2つのパッケージで、Explainable Boosting MachineをONNX形式に変換できます。
#Import MetaTrader5 package
import MetaTrader5 as mt5

#Import datetime for selecting data
from datetime import datetime

#Keeping track of time
import time

#Import matplotlib
import matplotlib.pyplot as plt

#Intepret glass-box model
from interpret.glassbox import ExplainableBoostingClassifier

#Intepret GUI dashboard utility
from interpret import show

#Pandas for handling data
import pandas as pd

#Pandas-ta for calculating technical indicators
import pandas_ta as ta

#Scoring metric to assess model accuracy
from sklearn.metrics import precision_score

#ONNX
import onnx

#Import ebm2onnx
import ebm2onnx

#Path handling
from sys import argv
そこから、上で説明したのと同じステップを繰り返してログインし、データを取得します。唯一の違いは、カスタム特徴を準備するためのステップです。
#Let's create a function to preprocess our data
def preprocess(data):
    data['mid_point'] = ((data['high'] + data['low']) / 2)

    data['mid_point_growth'] = data['mid_point'].diff().diff()

    data['mid_point_growth_lag'] = data['mid_point_growth'].shift(1)

    data['height'] = (data['mid_point'] - data['close'])

    data['height - 1'] = data['height'].shift(1)

    data['height_growth'] = data['height'].diff().diff()

    data['height_growth_lag'] = data['height_growth'].shift(1)

    data['time'] = pd.to_datetime(data['time'],unit='s')

    data.dropna(axis=0,inplace=True)

    data['target'] = (data['close'].shift(-1) > data['close']).astype(int)
いったんデータが収集されれば、データを訓練セットとテストセットに分割するために必要なステップと、グラスボックスモデルを適合させるために必要なステップは同じです。
グラスボックスモデルのフィッティングが完了したら、次はONNX形式への書き出しです。
まず、モデルを保存するパスを指定する必要があります。MetaTrader 5をインストールすると、端末で使用できるファイル専用のフォルダが作成されます。Pythonライブラリを使用すると、絶対パスを非常に簡単に取得できます。
terminal_info=mt5.terminal_info()
print(terminal_info)
探しているパスは、上で作成したterminal_infoオブジェクトの「データパス」として保存されています。
file_path=terminal_info.data_path+"\\MQL5\\Files\\"
print(file_path)
C:\Users\Westwood\AppData\Roaming\MetaQuotes\Terminal\D0E8209F77C8CF37AD8BF550E51FF075\MQL5\Files\
そこから、使用するパスを準備する必要があります。コードは端末から取得したファイルパスを取り込み、ファイル名を除外してパスのディレクトリを分離します。
data_path=argv[0]
last_index=data_path.rfind("\\")+1
data_path=data_path[0:last_index]
print("data path to save onnx model",data_path)
onnxモデルを保存するデータパスC:\Users\Westwood\AppData\Local\Programs\Python\Python311\Lib\site-packages\
そこからebm2onnxパッケージを使用して、グラスボックスモデルをONNXフォーマットに変換する準備をします。ebm2onnx.get_dtype_from_pandas関数を使用して動的におこなうのが望ましいので、先ほど使用した訓練データフレームを渡します。
onnx_model = ebm2onnx.to_onnx(glass_box,ebm2onnx.get_dtype_from_pandas(train_x))
#Save the ONNX model in python
output_path = data_path+"Volatility_75_EBM.onnx"
onnx.save_model(onnx_model,output_path)
#Save the ONNX model as a file to be imported in our MetaEditor
output_path = file_path+"Volatility_75_EBM.onnx"
onnx.save_model(onnx_model,output_path)
これでMetaEditor 5でONNXファイルを扱う準備が整いました。MetaEditorは、MetaQuotes Languageを使用してコードを書くための統合開発環境です。
最初にMetaEditor 5統合開発環境を開き、[Volatility Doctor 75 EBM]をダブルクリックすると、このように表示されます。
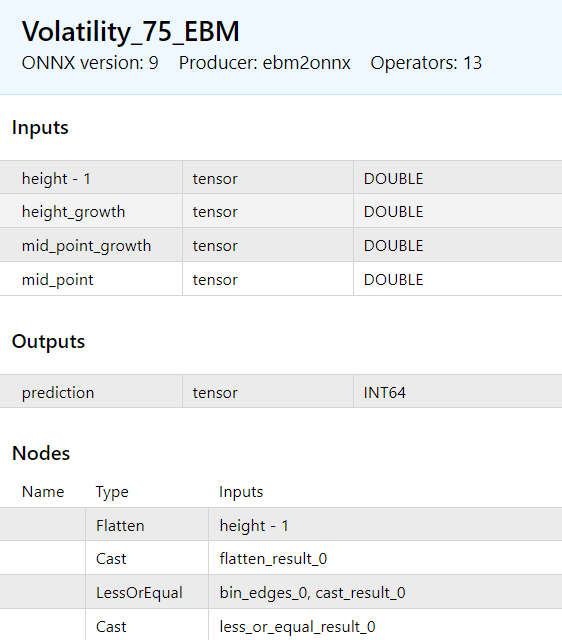
図13:ONNXモデルの入出力
EAを作成し、ONNXモデルを読み込みます。
まず、一般的なファイル情報を指定します。
//+------------------------------------------------------------------+
//|                                                         ONNX.mq5 |
//|                                  Copyright 2023, MetaQuotes Ltd. |
//|                                             https://www.mql5.com |
//+------------------------------------------------------------------+
//Meta properties
#property copyright "Gamuchirai Zororo Ndawana"
#property link      "https://www.mql5.com/ja/users/gamuchiraindawa"
#property version   "1.00"
そこから、いくつかのグローバル変数を指定する必要があります。
//Trade Library
#include <Trade\Trade.mqh>           //We will use this library to modify our positions

//Global variables
//Input variables
input double atr_multiple =0.025;    //How many times the ATR should the SL & TP be?
int input lot_mutliple = 1;          //How many time greater than minimum lot should we enter?
const int atr_period = 200;          //ATR Period

//Trading variables
double ask, bid,atr_stop;            //We will use these variables to determine where we should place our ATR
double atr_reading[];                //We will store our ATR readings in this arrays
int    atr;                          //This will be our indicator handle for our ATR indicator
long min_distance;                   //The smallest distance allowed between our entry position and the stop loss
double min_volume;                   //The smallest contract size allowed by the broker
static double initial_balance;       //Our initial trading balance at the beginning of the trading session
double current_balance;              //Our trading balance at every instance of trading
long     ExtHandle = INVALID_HANDLE; //This will be our model's handler
int      ExtPredictedClass = -1;     //This is where we will store our model's forecast
CTrade   ExtTrade;                   //This is the object we will call to open and modify our positions

//Reading our ONNX model and storing it into a data array
#resource "\\Files\\Volatility_75_EBM.onnx" as uchar ExtModel[] //This is our ONNX file being read into our expert advisor

//Custom keyword definitions
#define  PRICE_UP 1
#define  PRICE_DOWN 0
そこからOnInit()関数を指定します。OnInit関数を使用してONNXモデルをセットアップします。ONNXモデルをセットアップするには、3つの簡単なステップを踏むだけです。まず、ONNXモデルをリソースとして必要とするときに、上記のグローバル変数で使用したバッファからONNXモデルを作成します。それを読み込んだ後、個々の入力の形状を指定し、次に個々の出力の形状を指定する必要があります。入出力の形状を設定しようとしたときに、エラーが投げられたかどうかを確認します。すべてがうまくいったら、証券会社が許容する最小取引数量、損切りとエントリポジションの間の最小距離を取得し、ATR指標も設定します。
int OnInit()
  {
   //Check if the symbol and time frame conform to training conditions
   if(_Symbol != "Volatility 75 Index" || _Period != PERIOD_M1)
       {
            Comment("Model must be used with the Volatility 75 Index on the 1 Minute Chart");
            return(INIT_FAILED);
       }

    //Create an ONNX model from our data array
    ExtHandle = OnnxCreateFromBuffer(ExtModel,ONNX_DEFAULT);
    Print("ONNX Create from buffer status ",ExtHandle);

    //Checking if the handle is valid
    if(ExtHandle == INVALID_HANDLE)
      {
            Comment("ONNX create from buffer error ", GetLastError());
            return(INIT_FAILED);
      }

   //Set input shape
   long input_count = OnnxGetInputCount(ExtHandle);
   const long input_shape[] = {1};
   Print("Total model inputs : ",input_count);

   //Setting the input shape of each input
   OnnxSetInputShape(ExtHandle,0,input_shape);
   OnnxSetInputShape(ExtHandle,1,input_shape);
   OnnxSetInputShape(ExtHandle,2,input_shape);
   OnnxSetInputShape(ExtHandle,3,input_shape);

   //Check if anything went wrong when setting the input shape
   if(!OnnxSetInputShape(ExtHandle,0,input_shape) || !OnnxSetInputShape(ExtHandle,1,input_shape) || !OnnxSetInputShape(ExtHandle,2,input_shape) || !OnnxSetInputShape(ExtHandle,3,input_shape))
      {
            Comment("ONNX set input shape error ", GetLastError());
            OnnxRelease(ExtHandle);
            return(INIT_FAILED);
      }

   //Set output shape
   long output_count = OnnxGetOutputCount(ExtHandle);
   const long output_shape[] = {1};
   Print("Total model outputs : ",output_count);
   //Setting the shape of each output
   OnnxSetOutputShape(ExtHandle,0,output_shape);
   //Checking if anything went wrong when setting the output shape
   if(!OnnxSetOutputShape(ExtHandle,0,output_shape))
      {
            Comment("ONNX set output shape error ", GetLastError());
            OnnxRelease(ExtHandle);
            return(INIT_FAILED);
      }
    //Get the minimum trading volume allowed
    min_volume = SymbolInfoDouble(_Symbol,SYMBOL_VOLUME_MIN);
    //Symbol information
    //The smallest distance between our point of entry and the stop loss
    min_distance = SymbolInfoInteger(_Symbol,SYMBOL_TRADE_STOPS_LEVEL);
    //Initial account balance
    initial_balance = AccountInfoDouble(ACCOUNT_BALANCE);
    //Setting up our ATR indicator
    atr = iATR(_Symbol,PERIOD_CURRENT,atr_period);
    return(INIT_SUCCEEDED);
//---
  }
DeInit関数はとてもシンプルで、ONNXハンドラを削除し、使用していないリソースを占有しないようにします。
void OnDeinit(const int reason)
  {
//---
   if(ExtHandle != INVALID_HANDLE)
      {
         OnnxRelease(ExtHandle);
         ExtHandle = INVALID_HANDLE;
      }
  }
OnTick関数はEAの心臓部であり、証券会社から新しいティックを受信するたびに呼び出されます。私たちの場合、まず時間を記録することから始める。これにより、ティックごとに実行したい処理と、新しいローソク足が形成されるたびに実行したい処理を分けることができます。ティックごとに買値と売値を更新し、ティックごとに利食いと損切りのポジションを更新したいのですが、未決済のポジションがない場合は、新しいローソク足が形成された時点で一度だけモデル予測をおこないたいのです。
void OnTick()
  {
//---
   //Time trackers
   static datetime time_stamp;
   datetime time = iTime(_Symbol,PERIOD_M1,0);

   //Current bid price
   bid = SymbolInfoDouble(_Symbol,SYMBOL_BID);
   //Current ask price
   ask = SymbolInfoDouble(_Symbol,SYMBOL_ASK);

   //Copy the ATR reading our array for storing the ATR value
   CopyBuffer(atr,0,0,1,atr_reading);

   //Set the array as series so the natural time ordering is preserved
   ArraySetAsSeries(atr_reading,true);

   //Calculating where to position our stop loss
   //For now we'll keep it simple, we'll add the minimum volume and the current ATR reading and multiply it by the ATR multiple
   atr_stop = ((min_distance + atr_reading[0]) * atr_multiple);

   //Current Session Profit and Loss Position
   current_balance = AccountInfoDouble(ACCOUNT_BALANCE);
   Comment("Current Session P/L: ",current_balance - initial_balance);

   //If we have a position open we need to update our stoploss
   if(PositionsTotal() > 0){
        check_atr_stop();
   }

    //Check new bar
     if(time_stamp != time)
      {
         time_stamp = time;

         //If we have no open positions let's make a forecast and open a new position
         if(PositionsTotal() == 0){
            Print("No open positions making a forecast");
            PredictedPrice();
            CheckForOpen();
         }
      }

  }
そこから、ATRの利食いと損切りのポジションを更新する関数を定義します。この関数は、開いているすべてのポジションを繰り返し、そのポジションが取引中の銘柄と一致するかどうかを確認します。そうすれば、ポジションに関する詳細な情報を取得し、そこからポジションの方向性に応じて、ポジションの損切りと利食いを調整します。取引がポジションと反対に動いている場合、利食いと損切りはそのままにされることに注意してください。
//--- Functions
//This function will update our S/L & T/P based on our ATR reading
void check_atr_stop(){

      //First we iterate over the total number of open positions
      for(int i = PositionsTotal() -1; i >= 0; i--){

            //Then we fetch the name of the symbol of the open position
            string symbol = PositionGetSymbol(i);

            //Before going any further we need to ensure that the symbol of the position matches the symbol we're trading
                  if(_Symbol == symbol){
                           //Now we get information about the position
                           ulong ticket = PositionGetInteger(POSITION_TICKET); //Position Ticket
                           double position_price = PositionGetDouble(POSITION_PRICE_OPEN); //Position Open Price
                           long type = PositionGetInteger(POSITION_TYPE); //Position Type
                           double current_stop_loss = PositionGetDouble(POSITION_SL); //Current Stop loss value

                           //If the position is a buy
                           if(type == POSITION_TYPE_BUY){
                                  //The new stop loss value is just the ask price minus the ATR stop we calculated above
                                  double atr_stop_loss = (ask - (atr_stop));
                                  //The new take profit is just the ask price plus the ATR stop we calculated above
                                  double atr_take_profit = (ask + (atr_stop));

                                  //If our current stop loss is less than our calculated ATR stop loss
                                  //Or if our current stop loss is 0 then we will modify the stop loss and take profit
                                 if((current_stop_loss < atr_stop_loss) || (current_stop_loss == 0)){
                                       ExtTrade.PositionModify(ticket,atr_stop_loss,atr_take_profit);
                                 }
                           }

                            //If the position is a sell
                           else if(type == POSITION_TYPE_SELL){
                                     //The new stop loss value is just the bid price plus the ATR stop we calculated above
                                     double atr_stop_loss = (bid + (atr_stop));
                                     //The new take profit is just the bid price minus the ATR stop we calculated above
                                     double atr_take_profit = (bid - (atr_stop));

                                 //If our current stop loss is greater than our calculated ATR stop loss
                                 //Or if our current stop loss is 0 then we will modify the stop loss and take profit
                                 if((current_stop_loss > atr_stop_loss) || (current_stop_loss == 0)){
                                       ExtTrade.PositionModify(ticket,atr_stop_loss,atr_take_profit);
                                 }
                           }
                  }
            }
}
新しいポジションを建てるための別の関数も必要です。上で宣言したグローバル変数bidとaskを使用することにご注意ください。これにより、プログラム全体が同じ価格を使用していることが保証されます。さらに、check_atr_stop関数によって管理されるため、損切りと利食いをともに0に設定します。
void CheckForOpen(void)
   {
      ENUM_ORDER_TYPE signal = WRONG_VALUE;

      //Check signals
      if(ExtPredictedClass == PRICE_DOWN)
         {
            signal = ORDER_TYPE_SELL;
         }
      else if(ExtPredictedClass == PRICE_UP)
         {
            signal = ORDER_TYPE_BUY;
         }

      if(signal != WRONG_VALUE && TerminalInfoInteger(TERMINAL_TRADE_ALLOWED))
         {
            double price, sl = 0 , tp = 0;

            if(signal == ORDER_TYPE_SELL)
               {
                  price = bid;
               }

           else
               {
                  price = ask;
               }

            Print("Opening a new position: ",signal);
            ExtTrade.PositionOpen(_Symbol,signal,min_volume,price,0,0,"ONNX Order");
         }
   }
最後に、EA内でONNXモデルを使用して予測をおこなう関数が必要です。この関数は、訓練時に前処理されたのと同じように、データの前処理も担当します。この点はいくら強調してもしすぎることはありません。訓練でも本番でも、一貫した方法でデータが処理されるように注意しなければなりません。モデルへの各入力はそれぞれのベクトルに格納され、各ベクトルは訓練中にモデルに渡されたのと同じ順番でONNXRun関数に渡されます。プロジェクト全体を通して一貫性を保つことが最も重要です。そうでなければ、モデルをコンパイルするときに例外をスローしないかもしれない実行時エラーが発生することがあります。各入力ベクトルのデータ型が、モデルが期待する入力型と一致していること、さらに出力型がモデルの出力型と一致していることを確認します。
void PredictedPrice(void)
   {
      long output_data[] = {1};

      double lag_2_open = double(iOpen(_Symbol,PERIOD_M1,3));
      double lag_2_high = double(iOpen(_Symbol,PERIOD_M1,3));
      double lag_2_close = double(iClose(_Symbol,PERIOD_M1,3));
      double lag_2_low = double(iLow(_Symbol,PERIOD_M1,3));
      double lag_2_mid_point = double((lag_2_high + lag_2_low) / 2);
      double lag_2_height = double(( lag_2_mid_point - lag_2_close));

      double lag_open = double(iOpen(_Symbol,PERIOD_M1,2));
      double lag_high = double(iOpen(_Symbol,PERIOD_M1,2));
      double lag_close = double(iClose(_Symbol,PERIOD_M1,2));
      double lag_low = double(iLow(_Symbol,PERIOD_M1,2));
      double lag_mid_point = double((lag_high + lag_low) / 2);
      double lag_height = double(( lag_mid_point - lag_close));

      double   open  =  double(iOpen(_Symbol,PERIOD_M1,1));
      double   high  = double(iHigh(_Symbol,PERIOD_M1,1));
      double   low   = double(iLow(_Symbol,PERIOD_M1,1));
      double   close = double(iClose(_Symbol,PERIOD_M1,1));
      double   mid_point = double( (high + low) / 2 );
      double   height =  double((mid_point - close));

      double first_height_delta = (height - lag_height);
      double second_height_delta = (lag_height - lag_2_height);
      double height_growth = first_height_delta - second_height_delta;

      double first_midpoint_delta = (mid_point - lag_mid_point);
      double second_midpoint_delta = (lag_mid_point - lag_2_mid_point);
      double mid_point_growth = first_midpoint_delta - second_midpoint_delta;

      vector input_data_lag_height = {lag_height};
      vector input_data_height_grwoth = {height_growth};
      vector input_data_midpoint_growth = {mid_point_growth};
      vector input_data_midpoint = {mid_point};

       if(OnnxRun(ExtHandle,ONNX_NO_CONVERSION,input_data_lag_height,input_data_height_grwoth,input_data_midpoint_growth,input_data_midpoint,output_data))
         {
            Print("Model Inference Completed Successfully");
            Print("Model forecast: ",output_data[0]);
         }
       else
       {
            Print("ONNX run error : ",GetLastError());
            OnnxRelease(ExtHandle);
       }

       long predicted = output_data[0];

       if(predicted == 1)
         {
            ExtPredictedClass = PRICE_UP;
         }

       else if(predicted == 0)
         {
            ExtPredictedClass = PRICE_DOWN;
         }
   }
これが完了したら、モデルをコンパイルし、MetaTrader 5端末でデモ口座を使用してフォワードテストする準備が整いました。
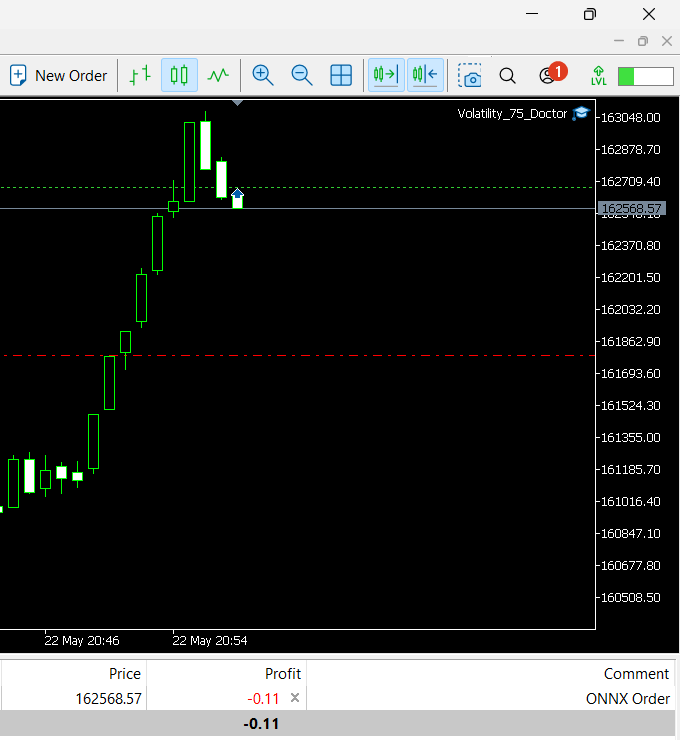
図14:グラスボックスONNXEAのフォワードテスト
EAタブと操作ログタブをチェックして、モデルがエラーなく動作していることを確認します。
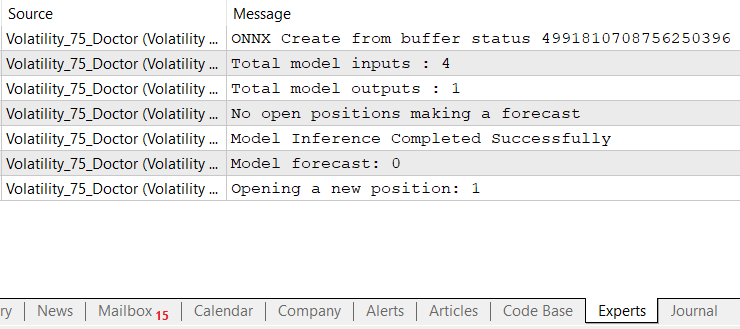
図15:EAタブでエラーを確認する
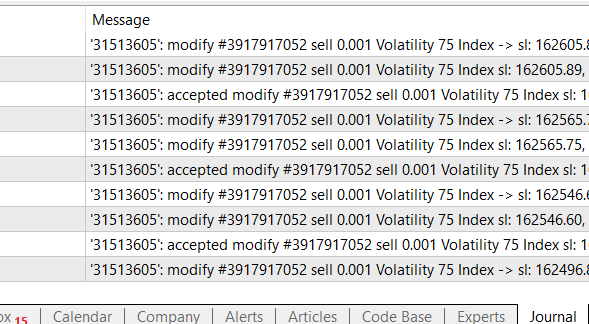
図16:操作ログタブでのエラーチェック
見ての通り、モデルは問題なく動いています。EAの設定はいつでも調整できることを覚えておいてください。
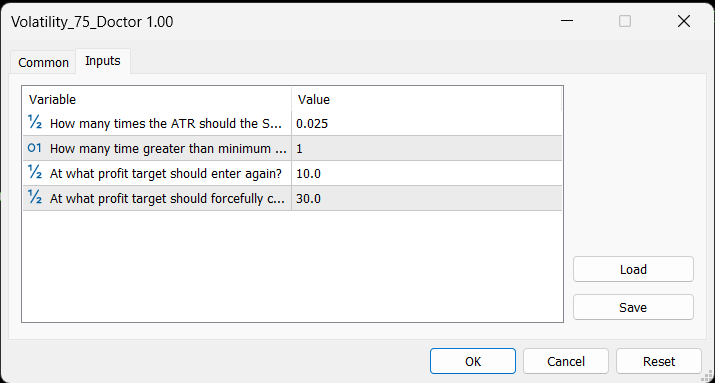
図17:EAの設定を調整する
よく遭遇する課題
このセクションでは、初めてセットアップをおこなう際に遭遇する可能性のあるエラーのいくつかを再現します。何がエラーを引き起こしているのかを検証し、最後にそれぞれの問題に対する解決策を1つずつ説明します。
入力または出力形状を正しく設定できない
最もよく発生する問題は、入力と出力の形状を正しく設定しなかったことに起因します。モデルが期待する各特徴の入力形状を定義しなければならないことを覚えておいてください。 各インデックスを繰り返し、そのインデックスの各特徴の入力形状を定義します。各特徴の形状を指定しなかった場合でも、以下のデモのようにエラーは発生せずにモデルはコンパイルされますが、そのモデルで推論を実行しようとするとエラーが発生します。エラーコードは5808で、MQL5のドキュメントには「Tensor dimension not set or invalid」と記述されています。この例では4つの入力がありますが、以下のコード例では1つの入力シェイプしか設定していないことを覚えておいてください。
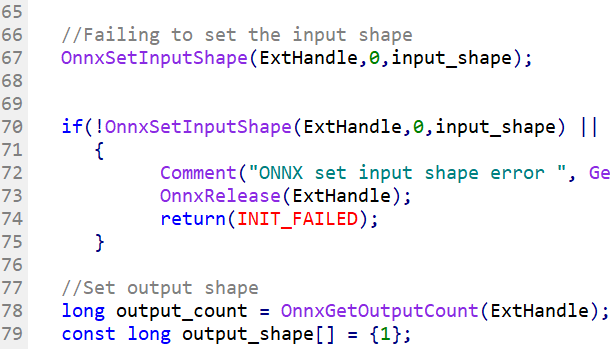
図18:例外をスローせずにコンパイルするEA
[エキスパート]タブを調べたときにエラーがどのように表示されるかを示すスクリーンショットも含まれています。正しいコードが記事に添付されていることを忘れないでください。

図19:エラーメッセージ5808
不適切なタイプキャスティング
タイプキャストを誤ると、データが完全に失われたり、EAがクラッシュしたりすることがあります。以下の例では、ONNXモデルの出力を格納するために整数配列を使用しています。ONNXモデルの出力がint64型であることを覚えておいてください。なぜエラーになると思いますか。 int型がモデルの出力を保存するのに十分なメモリを持っていないためにエラーが発生し、モデルが失敗してしまうからです。モデルの出力には8バイトが必要ですが、int配列には4バイトしかありません。解決策は簡単で、入力と出力を格納するために正しいデータ型を使用していることを確認し、タイプキャストする必要がある場合は、MQL5のドキュメントで指定されているタイプキャストルールに準拠していることを確認することです。エラーコードは5807で、説明は「Invalid parameter size」です。

図20:不適切なタイプキャスティング

図21:エラーメッセージ5807
ONNX Runの呼び出しに失敗
ONNX Run関数は、各モデル入力がそれぞれ独立した配列で渡されることを想定しています。以下のコード例では、すべての入力を1つの配列に結合し、その1つの配列をONNX Run関数に渡しています。コンパイル時には例外は発生しませんが、実行時に[エクスパート]タブでエラーが発生します。エラーコードは5804で、ドキュメントでは「Invalid number of parameters passed to OnnxRun」と簡潔に説明されています。

図22:ONNX Run関数の呼び出しに失敗
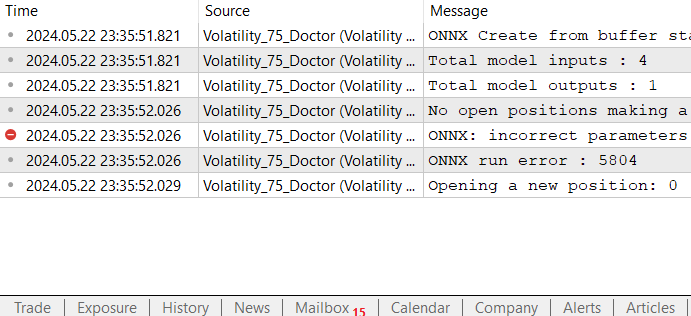
図23:エラーメッセージ5804
結論
グラスボックスモデルがなぜ私たちファイナンシャルエンジニアにとって有用なのかがお分かりいただけたと思います。ブラックボックスモデルから同じ情報を忠実に抽出するのにかかる労力に比べれば、グラスボックスモデルはわずかな労力で貴重な洞察を与えてくれます。さらに、グラスボックスモデルは、デバッグ、保守、解釈、説明が容易です。いわば「ボンネットの下を覗き込む」ことで、モデルが意図した通りに動いていることを検証しなければならないのです。
グラスボックスモデルには、これまで取り上げてこなかった大きな欠点があります。ブラックボックスモデルほど柔軟性がないということです。グラスボックスモデルは未開拓の研究分野であり、時が経つにつれて、将来的にはより柔軟なグラスボックスモデルが登場するかもしれませんが、この記事の執筆時点では、それらはそれほど柔軟ではありません。つまり、ブラックボックスモデルでより適切にモデル化される可能性のある関係が存在することということです。さらに、現在のグラスボックスモデルの実装は決定木をベースにしているため、InterpretMLのExplainableBoostingClassifiersの実装は決定木の欠点をすべて受け継いでいます。
また会う日まで、平和、愛、調和、そして有益な取引を祈ります。
MetaQuotes Ltdにより英語から翻訳されました。
元の記事: https://www.mql5.com/en/articles/13842
 母集団最適化アルゴリズム:焼きなまし(SA)アルゴリズム(第1部)
 母集団最適化アルゴリズム:ネルダー–ミード法、またはシンプレックス(NM)検索法
 ニューラルネットワークが簡単に(第67回):過去の経験を活かした新しい課題の解決
 ニューラルネットワークが簡単に(第66回):オフライン学習における探索問題
- 無料取引アプリ
- 8千を超えるシグナルをコピー
- 金融ニュースで金融マーケットを探索
ValueError:少なくとも1つの配列またはd型が必要です。
NZDCNHで試したが、いくつかの反復で動作するようだが、167行目のsklernmulticlassでdatahandlingで失敗した。
debugによると、204行目でvalueerrorが発生している。)
デフォルトのBoom1000インデックスでは、問題は日付と時刻の100行目です。 raise KeyError(key)
KeyError: 'time' .私のタイムゾーンはニュージーランドなので、おそらく問題でしょう。
今日はテストする時間がなかったので、明日もう一度やってみます。1) 'time'カラムは、私が取得したデータの各行を示すUNIXタイムスタンプにブローカーが付けた名前です。多分、あなたのブローカーは、'date'が一般的であるように、代わりに別の名前を使用しています。copy_rates_rangeを呼び出した後のデータフレームを確認してください。KeyError "がスローされるということは、データフレームが完全に空であるか、あるいは'time'という名前のカラムが存在せず、あなたの側で別の名前を使っている可能性があります。
2) copy_rates_rangeからの出力を検証してください。あなたの説明からすると、そこが原因かもしれません。
もしこれらの手順がうまくいかなかったら、私に知らせてください。
迅速なフィードバックとアドバイスをありがとう。
他の人の役に立つかもしれないので、ここに更新します。私の問題点 ;
1) 新しいデモ口座を 開設してテストしたところ、すべての通貨が利用可能ではありませんでした。 これは、口座を開設し、必要な通貨がアクティブになっていることを確認することで解決しました。
2)サーバーから提供されたBoom1000指数(データ)がなかった、それはリストにあったが、私は私のアカウントに反していなかった(あなたがアクセスできるものにデフォルトを変更し、それが結果を与えることができることを確認してください) .
3) 私の場合、解釈結果は標準のpythonでは表示されませんでした。
このハプニングの後、ドキュメントは明確で役に立ちました。
公開してくれて本当にありがとう。ニール
2)サーバーから提供されたBoom1000指数(データ)がなかった、それはリストにあったが、私は私のアカウントに反していなかった(あなたがアクセスできるものにデフォルトを変更し、それが結果を与えることができることを確認してください) .
3) 私の場合、解釈結果は標準のpythonでは表示されませんでした。
このハプニングの後、ドキュメントは明確で役に立ちました。
公開してくれて本当にありがとう。ニール
ニールが前進しているようで嬉しいよ。
意外なことに、この記事を理解するために最も重要なフレーズは、記事の一番最後にある:
текущие реализации моделей стеклянного ящика основаны на деревьях решений
意外なことに、この記事を理解するために最も重要なフレーズは、記事の一番最後にある: