Watch the Market tutorial videos on YouTube
How to buy а trading robot or an indicator
Run your EA on
virtual hosting
virtual hosting
Test аn indicator/trading robot before buying
Want to earn in the Market?
How to present a product for a sell-through
Free Expert Advisors and Indicators for MetaTrader 5 - 30

Dynamic Indicator --> YKL_DinDX Dynamic Indicator that creates a Band based on the distance from moving average specified by the user. The indicator considers the period entered by the user in order to calculate the average distance from moving average, creating an upper band and a lower band. This indicator is utilized by EA YKL_Scalper, version 2.0 or superior.
FREE
3つの時間軸を分析に使います。 3つの時間軸が、全て同じ方向になった場合、上昇方向または、下降方向になった場合 その方向にエントリーをします。 決済は、上記同様全て同じ方向になった場合、上昇方向または、下降方向になった場合 その方向に決済をかけます。
時間軸は、変数として定義されています。 移動平均も、各変数として定義されています。
基本的に、単発ポジションをもち、追加購入はしません。 途中決済は、手動で行うことも可能です。 その場合、EA内では、ポジションなしとして処理されます。
ロット数、利益確保、ストップロスも変数として設定できます。
使用する前に、最適化等を行ったほうが精度をあげてトレードできると思います。 また、100%任せきりにするのは、おすすめしません。
FREE

What is this script?
This script deletes all objects on all charts at once. You can delete all objects on all charts at once by running the script and allowing in the message box. This script is also a plugin of MT5's FX verification software " Knots Compositor ".
How to use
1. Run the script. 2. Allow it in the message box. 3. All objects will be deleted on all charts.
FREE
This indicator allows to hide Parabolic SAR (on all MT5 timeframes) from a date define by the user, with a vertical line (Alone) or a panel (with "Hidden Candles"). Indicator Inputs: Step Maximum Color Width Information on "Parabolic SAR" indicator is available here: https://www.metatrader4.com/en/trading-platform/help/analytics/tech_indicators/parabolic ************************************************************* Hey traders!! Give me your feeds! We are a community here and we have the sa
FREE

Indicador MAPS Indicador é um oscilador que faz o plot da Curva de Retorno de uma regressão de segundo grau para os preços de fechamento do ativo do gráfico. A Curva de Retorno é a linha central do indicador MAPS e representa a região de equilíbrio do preço entre vendedores e compradores. Os plots do indicador são: Linha central - C0 - cor da mesma varia de acordo com a tendência do mercado, sendo verde para tendência de alta e vermelho para baixa; Linhas superiores: S1, S2, S3 e S4, sendo que a
FREE
This indicator allows to hide Ichimoku Kinko Hyo (on all MT5 timeframes) from a date define by the user, with a vertical line (Alone) or a panel (with "Hidden Candles"). Indicator Inputs: Tenkan-sen Kijun-sen Senkou Span B Information on "Ichimoku Kinko Hyo" indicator is available here: https://www.metatrader4.com/en/trading-platform/help/analytics/tech_indicators/ichimoku ************************************************************* Hey traders!! Give me your feeds! We are a community here
FREE
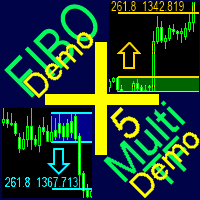
A ready-made multitimeframe trading system based on automatic plotting and tracking of Fibonacci levels for buying and selling any symbol. Demo version - calculation of the last 390 bars is not performed.
Advantages Determines the trend direction based on a complex of 14 indicators ( Cx ), extremums of ZigZag ( Z ), RSI ( R ), Impulse ( I ) Displaying the values of 14 indicators comprising the trend direction ( Cx ) Plotting horizontal levels, support and resistance lines, channels View the pl
FREE
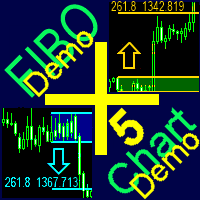
A ready-made trading system based on automatic plotting and tracking of Fibonacci levels for buying and selling any symbol on any timeframe. Demo version - calculation of the last 290 bars is not performed.
Advantages Determines the trend direction (14 indicators) Displays the trend strength and the values of indicators comprising the trend direction Plotting horizontal levels, support and resistance lines, channels Selection of the Fibonacci levels calculation type (6 different methods) Alert
FREE
This Expert Advisor is used to send messages from the PCT Multi indicator to Telegram.
The EA has 5 settings: - Channel name: The name of the Telegram channel. - Token: Your bot's Token. - Entries: Entry messages will be sent. - Results: Entry results will be sent. - Alerts: Alerts will be sent.
How to set up: In the Tools -> Options menu, in the "Expert Advisors" tab: - Check the "Allow WebRequest for listed URL:" option. - Click "add new URL" and add " https://api.telegram.org " (without t
FREE

This is a regression tree indicator for MT4/MT5.
This indicator classificate nodes on the time period so that the deviation becomes smaller,
and displays regression line and channel for each node.
It's free!
Attached CartDemo.ex4 and CartDemo.ex5 is a Demo version and has the following limitations:
Method is RandomForest only
Maximum number of bars is 200
Maximum number of trees is 2
Maximum tree depth is 2
Calculated waste lines are shown
Not display correlation coefficients
Fu
FREE

This EA automatically closes all Open Trades and Pending Orders at your specified Net Profit or Net Loss. The TP and SL for a single trade can easily be set in Meta Trader, on individual basis and on hitting that TP or SL, the trade is automatically closed. However, if you have multiple trades and you want to set a Net TP and Net SL (in terms of profit & loss) for all of them, then Meta Trader cannot help you. Here comes this EA “Net TP Net SL Setter” using which you can set a Net TP and Net SL
FREE

RCCMA is a general moving average indicator that works with ReviewCandleChart. Original is "Custom Moving Average" provided by MetaQuotes Software Corp. Based on that source code, I corresponded to ReviewCandleChart .
Advantages When ReviewCandleChart is ON, no line will be displayed on the right side from the vertical reference line. When ReviewCandleChart is ON and you press a key such as "Z" or "X" Following that, the MA is drawn. When ReviewCandleChart is OFF, the same drawing as the origi
FREE

Tick Speed Free povides a on-chart label of tick speed to allow you to see the ebb and flow of market activity. Observing rises and falls in tick speed may allow you to better time entries to reduce slippage and re-quotes.
Options include: - colores for low-mid-high tick speeds - placement and styling - prefix & suffix to customise the speed label
Troubleshooting: - Note, in the tester environment, tick timings are limited to what is supplied by the tester environment and it's speed
- If
FREE

A script for closing positions If you need to quickly close several positions, this script will make all the routine for you! The script does not have any input parameters. Allow AutoTrading before running the script. Usage:
Run the script on a chart. If you need to specify the maximal deviation and the number of attempts to close positions, use the script with input parameters https://www.mql5.com/en/market/product/625 You can download MetaTrader 4 version here: https://www.mql5.com/en/market
FREE

This indicator can be used to study the repeating daily volatility structure, and also find deviations from the historical means. Black line tells the average volatility of current hour from last 30 days. Blue bands tell the confidence interval (2 times standard deviation). Red line tells the current volatility, ATR.
Inputs: - days: the number of days where to calculate the average volatility - atrp: the ATR period used to measure volatility
FREE

The key to success is always good optimisation.
The system has a number of variables and in this case its simplicity is the key to its success. The system looks for the different "Gaps" as market entry failures and then debugs them through a stochastic analysis, i.e. the analysis of two moving averages to see if the price is overvalued or undervalued, and once this is done, the expert advisor will decide whether to perform an action or refrain from performing it. It is a very simple but power
FREE

Description of ADTGroup_Oscillator.mq5 Indicator
The ADTGroup_Oscillator.mq5 indicator is a custom technical analysis tool created by avydel. It is designed to provide insights into market trends and potential trading opportunities. Here is an overview of its key features and functionality:
- **Indicator Type:** This oscillator is designed to be displayed in a separate window on the trading platform. - **Indicator Plots:** It utilizes one buffer for plotting data. - **Plot Style:** The indi
FREE

Indicador Regressão Linear – Par de Ativos Indicador é um oscilador que faz o plot do Resíduo resultado da regressão linear entre os dois ativos inseridos como input do indicador, representado pela fórmula: Y = aX + b + R Onde Y é o valor do ativo dependente, X é o valor do ativo independente, a é a inclinação da reta entre os dois ativos, b é a intersecção da reta e R é o resíduo. O resíduo representa a quantidade da variabilidade que Y que o modelo ajustado não consegue explicar. E os resíduos
FREE

The indicator shows the number and ratio of ticks with the price growth and fall for each candle of the chart. The upper part of the histogram in the form of thin lines shows the number of price growth ticks (bullish strength), while the lower part shows the amount of price fall ticks (bearish strength). The thicker histogram bars is the difference between the strength of bulls and bears. A positive difference is displayed in green, and the negative one is red. The strength of bulls increases wh
FREE
Use Day Trading Tracker to keep a record of your earnings across accounts. This indicator will show a dashboard in the Meta Trader chart to show for the profit or loss money in your account. It’s easy to see just how much money you’re making matched betting with the Forex Trading Profit Tracker. Key features: Track your profit over time Check out your stats. Track expected profits against actual profits. Export account history to Excel. MT4 version: https://www.mql5.com/en/market/product/39113
FREE

This indicator uses the chart information and your inputs to display the lot size and associated stop for long or short positions. It uses an ATR based percent volatility position sizing calculation. You can use this indicator to learn more about a better position size calculation than a fixed lot system. The indicator adds text directly to the chart to show you the current position size calculation, the risk % input, the ATR Range input, the ATR value from the prior bar, the account equity at r
FREE

The "Takeandstop" script is a powerful tool designed to streamline your trading workflow by automatically setting Take Profit (TP) and Stop Loss (SL) levels on your MetaTrader 5 chart. This script is particularly useful for traders who want to efficiently manage their risk and reward without the hassle of manually calculating and entering these levels. Key Features: Effortless TP and SL Placement: With a few clicks, the script allows you to set predefined Take Profit and Stop Loss levels for you
FREE

MACD ******************** MACD для платформы секундных графиков Micro . ********************* Секундный график на порядок увеличит точность ваших входов и выходов. Секундный период , в привычном формате, позволит увидеть то, что ранее было скрыто. Бесплатные индикаторы, дополнят визуальную картину, что, в совокупности выведет вашу торговлю на новый уровень. Идеально подходит как скальперам, так и трейдерам торгующим внутри дня. Индикатор MACD для платформы Micro. Входные параметры:
FREE

TDO is a free utility for optimizing the Trading Direction indicator. In addition to signals for trading, the indicator also has an information vector that fully provides all the statistical information on the operation of the indicator; this effect can be used to ensure that the indicator is automatically optimized. You just need to select the instrument and timeframe and specify the hourly interval in the utility settings and drop it on the chart chart. That's all, now we are waiting for the
FREE

Fibonacci and RSI.
Demo versión only works with GBPUSD. For full version, please, visit visit https://www.mql5.com/en/market/product/52101
The indicator is a combination of the Fibonacci and RSI indicators.
Every time the price touches one of the fibonacci levels and the rsi condition is met, an audible alert and a text alert are generated.
Parameters number_of_candles : It is the number of candles that will be calculated. If you put 100, the indicator will give you the maximum and min
FREE

The indicator draws two simple moving averages using High and Low prices. The MA_High line is displayed when the moving average is directed downwards. It can be used for setting a stop order for a sell position. The MA_Low line is displayed when the moving average is directed upwards. It can be used for setting a stop order for a buy position. The indicator is used in the TrailingStop Expert Advisor. Parameters Period - period of calculation of the moving average. Deviation - rate of convergence
FREE
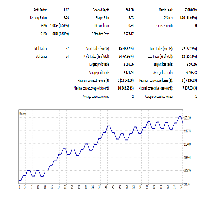
This Expert is developed to optimize parameters to trade in choppy markets. Simply use optimization to find the proper inputs for specific symbol you are interested in. This is a light load EA from processing point of view. You can easily run this on several charts simultaneously. Make sure to set a different magic number for each. note: The screenshot shows a 20% profitability in USDCAD for a period of 4-months and 5% draw-down using optimization to find best inputs.
FREE

Script for Metatrader 5. One click to Delete the background grid and object, all objects on the chart such as Trend lines you have drawn or created by another program arrows text Fibonacci lines removes the background grid making a clearer clean chart horizontal and vertical lines
Easy for clearing a chart or when opening new charts. Please leave a review on how its working.
FREE

An Adaptive Moving Average (AMA) is one more moving average overlay, just like EMA. It changes its sensitivity to price fluctuations . The Adaptive Moving Average becomes more sensitive during periods when price is moving in a certain direction and becomes less sensitive to price movement when price is volatile. For more information, welcome to our Telegram Group. https://t.me/InfinXx
FREE
如果产品有任何问题或者您需要在此产品上添加功能,请联系我 Contact/message me if you encounter any issue using the product or need extra feature to add on the base version.
Session TakeProfit StopLoss is basically helping to set the take profit and stop loss in dollar for the total open orders (session). Once the total profit is greater than session_tp or less than session_sl, the EA will help to close all open orders acting similarly to a take profit/stop loss for a single order.
Inputs session_tp: session take profit s
FREE
Equalizer MT5 is a trend indicator that can be used as: trend filter tigger entry trailing stop Trend filter : with blue histogram we have bull market; with red histogram we have bear market and; with gray histogram we have consolidated market. The tigger : with the increase in the size of the histogram bars we can have possible entry points into a trend. The trailing stop : in a trend, when the size of the histogram bars increases we can move the stop loss to the price bar corresponding to the
FREE

Что такое OsMA DA? Индикатор OsMA DA – это осциллятор, который построен на показаниях другого осциллятора – MACD. OsMA DA показывает расхождение между сигнальной линией MACD и его гистограммой. Момент пересечения гистограммы и линии – это нулевая отметка OsMA. Если гистограмма MACD поднимается выше линии, то гистограмма самого OsMA DA поднимается выше нулевой отметки. В обратной ситуации OsMA DA демонстрирует отрицательные значения. OsMA DA более узконаправленный индикатор, чем MACD. OsMA
FREE

This Doji indicator/ trading bot, developed by Profectus.AI, is a cutting-edge system harnessing the power of scalping. This pro bono product showcases our expertise and offers a competitive edge in financial markets.
CHAT WITH US! ===============================
YouTube ️ https://youtube.com/@profectusai
️ Instagram ️ https://www.instagram.com/profectusai
Telegram Trading Channel ️ https://t.me/ +ZFrbkNGIVLM2YjJk (Telegram)
WhatsApp ️ https://wa.me/message/C7PZY
FREE

We use Price Action and Japanese Candlesticks at important price zones and standard times to open positions and use Risk/Reward: 1/2 - 0.2%/trade. Recommended symbol: EURUSD, GBPUSD, AUDUSD, USDCAD, USDJPY, GBPJPY, EURJPY. Contact me: Gmail: fifund.cuscare@gmail.com, Facebook , Twitter , Instagram . Product: Metatrader4 , Metatrader5 . Broker references: Exness , ICMarket , FBS .
FREE

This indicator emulates volume delta (buy trades vs sell trades) based on per candle volume and candle shape (direction, size of body and wicks). Artificially separated buy and sell volumes then accumulated for specified number of bars. The indicator shows a histogram of volume delta per bar, as well as a sum of the delta for the given period. What is more important, the indicator allows you to combine current symbol quotes/volumes with quotes/volumes of other related symbols (futures, indices,
FREE

Good afternoon. Today we offer the maxlottomson indicator to determine the maximum volume that you can put up for purchase or sale, if you look at your deposit level. This indicator is convenient to use for News trading, when you need to determine the entry point on a high-speed movement and calculate the risk level as a percentage of the deposit, the maxlottomson indicator shows the maximum value of the LOT volume for your deposit that you can use for trading.
FREE

Critical Trading, Omni-Channel This indicator lets you create a unique channel from a base type and a range type. Channels are great for spotting over-extensions or the start of new trends. With an ever changing market it is important to create your own edge in the market that no one else has. Let Omni-Channel add to your unique trading strategy. Please contact criticaltrading@outlook.com for more info or advice on adding any other functionality.
FREE

Nueva entrega en la familia de los Baby EAs: Baby RSI es un EA Experto basado en el indicador RSI. No usa martingala ni grilla, estrategia basada en RSI, Estrategia conservadora. La oscilación relativa del indice del precio o RSI detecta sobrecompras y sobreventas, si estas revierten o hacen Pullback Baby RSI se posicionará a favor de esa corrección de precio, solo si esto ocurre, si no, no. Baby RSI es un Ea muy simple, no necesita mucho más y es una de mis favoritas estrategias automatizadas
FREE

*Used by MeditionSeed EA. Meditation is a practice in which an individual uses a technique – such as mindfulness, or focusing the mind on a particular object, thought, or activity – to train attention and awareness, and achieve a mentally clear and emotionally calm and stable state.[1][2][3][4][web 1][web 2] Plant a Meditation Seed to have wonderful future.
FREE

The Indicator indicator draws 2 clouds based on Bollinger Bands indicator values. The upper cloud is formed by the upper lines values and the lower cloud by the lowers lines values. The indicator allows to change the Bollinger Bands parameters and the clouds colors the period of the base line and the deviations of each Bollinger Bands instance. The indicator holds 5 buffer index as follow: [0] - Outer values of the upper cloud [1] - Inner values of the upper cloud [2] - Base/Center line values
FREE
Индикатор отображает изменение баланса В правом нижнем углу окна.
Отображаются следующие периоды Сегодня Вчера 3 дня Неделя 10 дней Месяц 3 месяца Полгода Год Все время Есть возможность выставить расчетное время. Удобно пользоваться для расчетов прибыли/убытков с определенного часа.
Будет полезен например ночным скальперам. Данные совпадают с расчетами отчета в терминалее.
FREE
This indicator allows to hide MACD oscillator (on all MT5 timeframes) from a date define by the user, with a vertical line (Alone) or a panel (with "Hidden Candles").\ Indicator Inputs: Fast EMA Period Slow EMA Period Signal SMA Period Apply To Information on "MACD" indicator is available here: https://www.metatrader4.com/en/trading-platform/help/analytics/tech_indicators/macd ************************************************************* Hey traders!! Give me your feeds! We are a community
FREE

Order Book, known also as Market Book, market depth, Level 2, - is a dynamically updated table with current volumes of orders to buy and to sell specific financial instument at price levels near Bid and Ask. MetaTrader 5 provides the means for receiving market book from your broker in real time. The expert OrderBook Recorder records market book changes and stores them in local files for further usage in indicators and expert adviser, including testing in the tester. The expert stores market book
FREE

Only Exponential Moving Average at Close Price is used in standard Bears Power limiting the possibilities of that indicator to some extent. Bears Power Mod enables you to select from four Moving Averages and seven applied prices, thus greatly expanding the indicator's functionality.
FREE

Finally, the interface has become convenient. Now you can control the indicator period with the mouse. Just click on the button and scroll the mouse wheel to increase or decrease the CCI period. The button can be placed in any convenient place, fixed and used with one click. You can set several indicators on one chart and manage them individually or all at once. A simple installation on the chart allows you not to worry about renaming or changing the parameters of each indicator, the automatic
FREE

Простой индикатор, показывающий цены Bid и Ask. Есть настройки отображения информации и возможность перетаскивать панель. Индикатор используется для наглядного отображения цен покупки и продажи актива.
Входные параметры : Support - Ссылка, на помощь проекту heigth - Высота формы width - Ширина формы size - Размер текста bidcol - Цвет текста bid askcol - Цвет текста
FREE

Hello everyone, this is another utility that I wrote specifically for users using my profile with a large number of experts and sets ( https://www.mql5.com/en/blogs/post/750723 ) . This utility is useful for working with a profile using grid strategies (averaging and martingale). As we know, such strategies periodically fall into a large drawdown and you need to be careful when opening averaging positions (do not open too many). In my profile, I use a limit of 3 positions for each EA, if this w
FREE

Export the news calendar from MT5 for precise EA backtesting
Harness the power of automated trading and optimise your Expert Advisors (EAs) with our latest tool: the MT5 News Calendar Exporter. This innovative programme has been specifically designed to export the news calendar directly from MetaTrader 5 (MT5) and save it in an easily accessible file. For programmers and traders who want to rigorously backtest their EAs, this is an indispensable tool.
With the MT5 News Calendar Exporter y
FREE

This is an alert based on a moving average convergence / divergence (MACD) and additional moving average indicator (for trend confirmation) similar to my other product where you find detailed description of how it works. You get a colored table where colors are related to trading conditions (see below) with possibility to customize all indicator parameters, including Heikin Ashi calculations. Meaning of cell COLORS (can be redefined by user): GREEN - buy signal, PINK - sell signal, YELLOW - pay
FREE
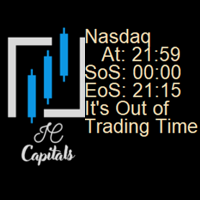
This indicator shows you the time of the opening and close of the trading time of every symbol. If it's out of the trading time it will show you a message in the screen, you can choose "PT-BR" or "ENG". For future updates i want to trigger a sound alarm in the preset value by the client for the opening of positions and closement of all positions.
If you want anything more than that just message me in the community ( https://discord.gg/P5mcttvXgw ) and I will update it for you!
FREE

--- StudentK Sync Chart --- 1. Move charts at the same time 2. Cross check among different Symbols and Timeframes 3. Plan your own trading strategies
=== Simple (Free) Version ===
1. Allow USDJPY only
2. Support M5 and M15
3. * Contact StudentK for unlocking all timeframes *
--- Context --- StudentK is not indicated as a master or K Sir for knowledgeable person who claims for winning all the time. (But lots of traders should know the fact that it is rarely truth, especially in fluctuat
FREE

Script to create arrows and lines on chart of history positions traded on account for the symbol where you launch the application. From inputs you can select: - Magic number (default is -1; -1 = all magics number) - "From" date and time (default is 1970.01.01 00:00; all positions) - "To" date and time (default is 1970.01.01 00:00; all positions) - Color for buy open positions (arrows and lines between open and close) - Color for buy closing positions (arrows) - Color for sell open positions
FREE

izi hedge is a tool that helps you manage risk, manage hedge orders and rebalance losing orders.
How it works It will place an order opposite to the order you placed with that currency pair. If the order you place is correct, the reverse order will be automatically deleted If the market unfortunately goes against your order and touches the hedge order, it will begin to calculate the hedging volume to limit the risk of the market going in reverse.
FREE

Dynamic Theoretical Stop
Histogram indicator that dynamically analyzes the theoretical Stop levels in real time.
Operation :
The DTS - Dynamic Theoretical Stop does a mapping of fractals in previous candles and suggests two levels of Stop: For purchase and for sale.
Suggested reading :
It is necessary to make the definition of Maximum Stop in points in the Trading Plan. In this way, the trader can decide the best entry point by analyzing the theoretical stop levels:
Stop for sales: S
FREE

Hello and welcome ladies & gentlemen :) this is the MT5 version of this free tool for my lovely people :) It's very simple tool to set Stoploss for your orders or positions within milliseconds whatever how much this orders count , Just drop the EA on the chart that you want to modify the SL for it's orders and fill the INPUTS as the following : - ( Order_Type ) Select the orders or positions types . - ( StopLoss ) Write the SL you want . - ( MagicNumber ) Use magic number 0 for manual cre
FREE
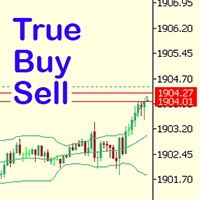
Have you ever noticed how on the forex symbols, the buy / sell button's price doesn't match the buy / sell lines on the chart? The spread always looks a lot tighter on the chart, you open a position and then realise the spread is huge. This is a very simple utility, it adds lines on the chart which match the buy / sell price on the buttons. Once installed I recommend right clicking the chart, go to Properties and uncheck "Show bid price line" and "Show ask price line", now click OK. Then righ
FREE

To download MT4 version please click here . This is the exact conversion from TradingView: "RSI versus SMA" By "JayRogers". This indicator lets you read the buffers for all Lines on chart. Note: This is an indicator, Not an expert. Meaning It does not take trades. If you want the EA please contact via message. You can easily use the indicator to understand the logic behind trades that the TradingView strategy takes. The strategy is profitable if this indicator is applied to the right symbol at
FREE

3 Moving averages crossover , with customizable Notifications and pop ups. Comment for any ideas. Its a demo version , could use some work, hope you at least find it useful. Hit me up with anything or any ideas you feel might be helpful and i will try and add them in if i get the time. Thank you. This version is free as of now . I can't promise anything about the future. But enjoy and have fun. Truly PVRPLE BLVCK. PS don't forget to share and like.
FREE

One of the simplest Pivot Point indicator, easy to operate, and most complete for a single chart in determining Resistance and Support level lines.
In single chart, it will show R&S Level Line with 5 popular types of Pivot Point, Highest&Lowest of closing price Include the Trend and up to 3 Time Frames.
Five types (Floor, Woodie, Camarilla, DeMark, & Fibonacci) of popular Pivot Points in determining Resistance and Support levels. With just using simple button on th
FREE

Non-proprietary study of Joe Dinapoli used for overbought/oversold evaluation. Uses of Detrended Oscillator indicator Profit taking. Filter for market entry technics. Stop placement. Part of volatility breakout pattern. Determining major trend changes. Part of Dinapoli Stretch pattern. Inputs lnpPeriod: Perid of moving average Method: Calculation method ********************************************************************************* If you want to know market Overb
FREE
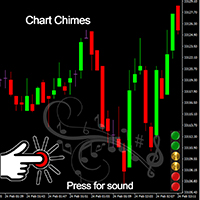
Introducing the Chart Chimes - the MT4/MT5 indicator that makes trading a symphony of sound! Tired of staring at charts all day? Need a little pick-me-up to keep your spirits high while trading? Well, Chart Chimes has got you covered!
With Chart Chimes, every time you hit that button, you'll hear a fun sound that will bring a smile to your face and a skip to your step. Imagine trading with the sound of a triumphant trumpet or a gentle harp in the background - it's like having your own persona
FREE

It is is your personal risk guard. Drop it on any chart on your VPS or trading computer and it will guard your total risk in any pair or asset and make sure the sum of all stops is within your risk. If you happened to exceed the risk, in a split second this EA will calculate the exact position for the combined risk of all open positions and place all stops at the exact same spot. If you open a new position with another lot size . No problem, all stoplosses will automatically adjust. Tired of man
FREE

This is the Demo version of the easy ea builder
With this version it takes 4 hours to create a robot and you cannot close the builder before you finish creating your robot other wise you will lose everything, this demo builder only works on demo accounts. The robots created on this builder only work on demo accounts and on EUR/USD only.
The easy ea builder enables you to build expert advisors/robots without writing a singe line of code. It can be used by anyone. you can combine as many indica
FREE

TrendFollowing is an multi-currency scanner that just indicates where to buy/sell: Abilities: Opens up the chart automatically with and arrow indicating where to take action. Send the signal to a telegram channel, see @fx_signal_com channel to get the idea. Configuration: No need to configure "Market Watch". Open a chart and attach the scanner to it. Trading Rules: Use only buystop/sellstop orders above/below arrow on the chart. Delete the pending order if price retraces below/above the moving
FREE

Hi you, I need your help! Be my Patron, let's make it possible!
https://www.patreon.com/joaopeuko https://github.com/Joaopeuko/Mql5-Python-Integration
Channel: English version - Versão Inglês:
https://www.mql5.com/en/channels/Mql5_Python_Integration_EN
Portuguese version - Versão Português:
https://www.mql5.com/en/channels/Mql5_Python_Integration_PT
Free version with 5 indicators: https://www.mql5.com/en/market/product/57574
This version has 38 indicators, 5 from the free vers
FREE

TRAILINATOR is a unique Solution to use different Trailing-Stop Variants and change your settings via Remotecontrol. You configure your Trailing-Stop for a specified Symbol only once. This setting will be used for all your Positions of the same Symbol. Currently we support these different Trailing-Stops: Standard : works like you use in Metatrader Terminal, starts trailing if your profit is greater than trailing stop Start after points : trailing stop will start after your defined points in p
FREE

SIMPLE AND QUICK CHART CLEANUP SCRIPT - FREE FOR ALL - EASY TO DRAG AND DROP ONTO THE CHART - A MUST HAVE IN MY EYES
Everybody loves to draw on a chart! But cleaning is nobodies favor. Most of the time it will be faster to dump all and redraw the important part. Repetition makes you good! ALWAYS think about that! KEEP IT GROWING, ;-) I wish you a good day, Traders!
If you need something, send me a message. Best wishes to you from Vienna!
FREE

Indicators are professional data statistics, position orders, historical order analysis->>>>>> <This version is in Chinese -> English version please move>
Necessary for traders: tools and indicators Waves automatically calculate indicators, channel trend trading Perfect trend-wave automatic calculation channel calculation , MT4 Perfect trend-wave automatic calculation channel calculation , MT5 Local Trading copying Easy And Fast Copy , MT4 Easy And Fast Copy , MT5 Local Trading copying For DE
FREE

"Elder Ray" or "Ray" indicator is based on the Dr. Alexander Elder's oscillators: Bulls & Bears Power. Both of them works with an EMA. This indicator is used by traders to identify divergence, market directions and more... Dr. Elder's method generally uses a 13-day EMA Period but this can be modified based on your personal demand. The calculations are: Bulls Power= high candle - EMA close Bears Poder= low candle - EMA close Lime line represents Bulls Power and OrangeRed line, shows Bears Power
FREE

Standard PVSR is based on Pivot Points.
Steps to Setup the Indicator: Install the Custom Indicator; Set all the Lines Color, Width and Styles; Set visualization to All Timeframe; and DONE
It can be used for: All Pairs: Forex, Cryptocurrencies, Metals, Stocks, Indices etc. All Timeframe All Brokers All type of Trading Style like Scalping, Swing, Intraday, Short-Term, Long-Term etc. Multiple Chart
-->> For any Type of Support, Guidance, Setup Issue, EA Optimization, Input Setup etc.
FREE
Learn how to purchase a trading robot from the MetaTrader Market, the store of application for the MetaTrader platform.
The MQL5.community Payment System supports transactions via PayPal, bank cards and popular payment systems. We strongly recommend that you test the trading robot before buying, for a better customer experience.
You are missing trading opportunities:
- Free trading apps
- Over 8,000 signals for copying
- Economic news for exploring financial markets
Registration
Log in
If you do not have an account, please register
Allow the use of cookies to log in to the MQL5.com website.
Please enable the necessary setting in your browser, otherwise you will not be able to log in.