Watch the Market tutorial videos on YouTube
How to buy а trading robot or an indicator
Run your EA on
virtual hosting
virtual hosting
Test аn indicator/trading robot before buying
Want to earn in the Market?
How to present a product for a sell-through
Free Expert Advisors and Indicators for MetaTrader 5 - 27

This system is a semi- automatic trend following system that operates during the days of highest probable market volatility aiming to capitalize on major retracements and reversals that occur midweek. It can operate on full autopilot, act as just a signal generator, or any customized user preference based on the needs of the user and the functionality of the program. It is capable of risk management with an inbuilt lot size calculator with adjustable risk pecentage to suit the user's unique apet
FREE

Logarithmic chart in new window You can use both chart as half or full window All features are active in both arithmetic and logarithmic charts Magnet in arithmetic chart is standard metatrader magnet in logarithmic chart magnet have two modes: first mode only select high or low, if this mode is enabled, you can set how many candles will be search before and after to find the highest or lowest points second mode select the closest point of the candle to click, its choose between 4 points (High,
FREE

This indicator has the main purpose of showing the current spread of the asset in which the indicator was placed. Depending on the photos, visually and within the graph itself, it is possible to view the spread value at the current time, it is possible to change the vertical position of the text and the horizontal position, in addition to the font size and color of the text.
FREE

================ // Average period ma_Sma, // Simple moving average ma_Ema, // Exponential moving average ma_Smma, // Smoothed MA ma_Lwma // Linear weighted MA =============== // Average method // Turn alerts on? // Alert on current bar? // Display messageas on alerts? // Play sound on alerts?
FREE

Distance Price Moving Average
This is an indicator that calculates in real time the distance from the price to the moving average.
With it you can monitor the maximum deviation of the price from the moving average in a certain period of time chosen by you, for example, monitor the distance according to the maximum deviation of the last 30 days.
It is possible to choose the period and type of the moving average.
To make it even better, we have added the possibility of two alert levels
FREE
Demo version of the Virtual SL TP Trailing product for testing all functions https://www.mql5.com/ru/market/product/75210
ВНИМАНИЕ: ТОЛЬКО ДЛЯ ДЕМО-СЧЕТОВ !!!
Make Trailing Stop, Take Profit, Breakeven, Stop Loss levels invisible to the broker!
HIDDEN MODE (STEALTH MODE) Virtual Trailing Stop (Virtual Trailing Stop) Virtual Take Profit (Virtual Take Profit) Virtual Breakeven (Virtual Breakeven) Virtual Stop Loss (Virtual Stop Loss) Виртуальный 2-уровневый Трейлинг-стоп Virtual
FREE
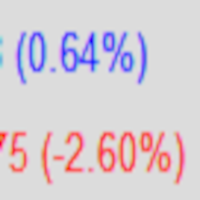
Equity monitor
This is a simple means change informer. I wrote it for myself, maybe someone will need it...
1. Displays the change in funds for the day. Every day, when the terminal is first launched, it remembers the current funds and monitors changes throughout the day.
2. The first day of the month, well remembers the money and, within months, to monitor changes.
3. Well, it displays the profit of the open position.
To work, you need to create 4 global variables: gvarEqityDay ,
FREE

Expert using Moving Average (Configurable), RSI entry points and Bollinger Bands (not configurable [yet]).
You can decide if you want to use the Moving Average with or without Bollinger Bands and you can turn on/off the RSI also for entry/exit points.
You can also turn on/off the Double Hand Feature where every entry/exit the trade will be in double, which means, selling and buying at the same time.
FREE

This is MT5 version Get Tunnel Warrens MT4 here
Here are several indicators that work together. It basically works with moving averages and various levels of ATR creating a dynamic channel through which the price is drained. As I always recommend, you should try it before using it in live so that you understand how it works. The market entry signal is similar to other MA indicators, but with this one you also have a graphical analysis of the moment when the trend is found and dynamic levels to
FREE
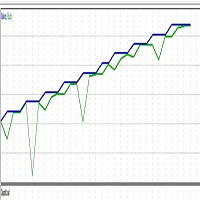
Trading is a skill where you can have your own skill and your own process. So, he advice that you try do what work for you. Trading is not a get rich quick scheme. when you stick to it long enough, it could change your live. Psychology and emotion is very important. Taking basic long and short trades automatically based on MACD and bear power. The robot is a test project by chrisdgenius aim to increasing profitablility.
FREE

What is this script?
This script deletes all objects on all charts at once. You can delete all objects on all charts at once by running the script and allowing in the message box. This script is also a plugin of MT5's FX verification software " Knots Compositor ".
How to use
1. Run the script. 2. Allow it in the message box. 3. All objects will be deleted on all charts.
FREE

Introducing Dumangan MT5 - The Philippine God Of Harvest
(MT4 Version - https://www.mql5.com/en/market/product/98661 ) Experience the abundance of successful trades with Dumangan MT5, our new Expert Advisor available on MQL5.com. Named after the revered Philippine God of Harvest, Dumangan, this tool embodies the essence of reaping profits from the fertile ground of the markets, just like Dumangan blessed the fields with bountiful crops. A Focused Strategy with Customizable Settings Dumangan MT
FREE

This indicator creates synthetic charts. It creates a candlestick chart plotting the price of one instrument measured against another, helping you to find hidden opportunities in the market crossing relationships between different instruments. [ Installation Guide | Update Guide | Troubleshooting | FAQ | All Products ] Find hidden trading opportunities Get a broader sense of the price of commodities Commodities range against each other and are easier to trade Correlated Indices can be traded ag
FREE
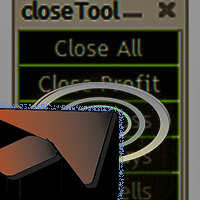
Are you tired of the hassle and delays in closing your trades. Introducing our revolutionary One Click Close Tool, designed for both MT4 and MT5 platforms, empowering traders with seamless control over their trade closure experience. Instant Execution : Experience lightning-fast trade closures with just a single click. No more navigating through multiple windows or confirmation dialogs take full control of your trading decisions instantly. Our tool boasts a user-friendly interface, ensuring tha
FREE

The Graphic Alignment Context (GAC) Technical Indicator measures the vertical difference of the simple average price of a financial instrument in the context of three different timeframes determined by a defined number of bars or candles (periods) to determine the strength of the buy or sell trend. sale. Ascending average prices indicate Buying strength (1), Descending average prices indicate Selling strength (-1) and any scenario different from the previous two conditions indicates Neutrality
FREE

Real Quants Forex Volatility Catcher for MT5 Introduction Real Quants Forex Volatility Catcher is a cutting-edge automated trading system designed specifically for MetaTrader 5. Developed through advanced machine learning and exhaustive data mining techniques, this system offers traders a robust strategy for navigating the complex terrains of the forex markets. With a commitment to rigorous testing that includes Monte Carlo simulations, walk-forward matrix optimization, and live execution valida
FREE

This proficient advisor employs the mesmerizing dance of crossovers between a gentle, languid moving average and a nimble, swift moving average to gracefully initiate positions. In a delightful twist of intuition, it enters a tranquil purchase when the quick MA gently embraces the slow MA in a downward crossing, gracefully bidding farewell at the subsequent crossing. Conversely, a spellbinding sale is orchestrated when the swift MA elegantly crosses the slow MA, a harmonious choreography that
FREE

This is an ordinary MACD indicator displayed in the main window according to the selected chart style, i.e. Bars, Candlesticks or Line. When you switch the chart type, the indicator display also changes. Unfortunately I could not improve the chart type switching speed. After switching, there are delays before the arrival of a new tick.
The indicator parameters Fast EMA period Slow EMA period Signal SMA period Applied price
FREE
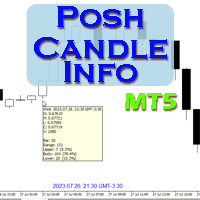
Show candle info with: Time in selected timezone Bar number Candle range points Upper wick points and percentage Body points and percentage Lower wick points and percentage Mark large/small candle body with customizable line. Settings group: Broker and local timezone. Lookback bars for candle marking. Large candle body Small candle body Date and time info with auto position or custom the x and y coordinate.
FREE

Midpoint Bands is a channel-like indicator that draws two lines on the chart - an upper band and a lower band, pointing out possible reversal levels.
This is one of the indicators used in the Sapphire Strat Maker - EA Builder.
Sapphire Strat Maker - EA Builder: https://www.mql5.com/en/market/product/113907
The bands are simply calculated like this:
Upper Band = (HighestHigh[N-Periods] + LowestHigh[N-Periods])/2 Lower Band = (LowestLow[N-Periods] + HighestLow[N-Periods])/2
FREE

Down load all the historic ticks data from a pair. Just load the EA to a graph, give it time to download all the data ticks and wait for the messages to appear as downloaded in the terminal. Once its downloaded, the data will appear in MQL5/Files folder as "ticks_data_XXXX.csv". where XXXX is the symbol from whom you just downloaded the data. You can use this data as input for a python file for ONNX or what ever you want or need. For big pairs, the data is Gb big.
FREE

you can close all your positions in profit or lost when you use this robot. 1.you set your max profit and max lost for all your positions. 2.the robot show you in a window beside your chart. 3.when your equity reach your target close all your positions. 4.you can use one of them or both (profit or lost)togather. 5.this robot close all your positions. ((if you have any idea or want somthing i can help you)) i hope you win in all your times of life. best regard
FREE

Order Entry - Probably the easiest way to enter an order If you like this perhaps you might consider buying the pro version https://www.mql5.com/en/market/product/64353?source=Site+Profile+Seller An aid for entering orders. Features: * Drag & drop tool to adjust price, stop loss and take profit levels. * Calculates lot sizes automatically based on risk entered, currency pair and stop loss / price levels.
Description It enables you to visually enter a trade's price, stop loss and take profit
FREE

This EA uses two moving averages one slow and one fast, when ever they cross it checks if the RSI value is greater or lesser than 50 depending on the signal given by the Moving averages. After that it checks if the Stochastics lines are going up or down and not in the Over Bought or Over sold zone. so in total it uses an RSI, 2 Moving Averages ,Stochastics and an ATR to try to evade stop hunting.Also has a trailing function to hold the profits if price moves X pips tested on a 5 min time frame
FREE
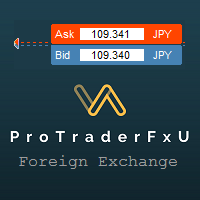
Description: - BidAskLine Indicator is very simple and easy, but each utility can be important in the probability that we will win in our trade. This utility Indicator shows lines and prices of the Bid, Ask and Spread. Input Parameters: - Visual Aspect Options : Select between 2 options with Box or Simple Style. - Parameters Bid Price : Select between show or hide line or box objects, change color, style or width line. - Parameters Ask Price : Select between show
FREE

Tired of adjusting the indicator settings losing precious time? Tired of the uncertainty regarding their efficiency? Afraid of the uncertainty in their profitability? Then the indicator ACI (automatically calibrateable indicator) is designed exactly for you. Launching it, you can easily solve these three issues just performing the simplest action: clicking a single Calibrate button. To achieve the highest efficiency, you should perform another additional action: move the power slider to the maxi
FREE
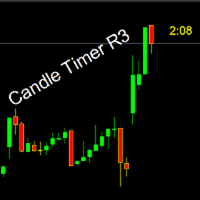
Timer remaining to finish the candle. A simple informative indicator of how much time is left until the current candle ends. In a simple, easy and objective way. In the input parameters, enter the desired color of the clock, the font size and the displacement to the right of the candle. I hope I helped with this useful and free tool. Make good use and good business.
FREE

This indicator was inspired by John Welles Wilder's average true range (ATR) , but with some extra information. Similarly, it calculates the exponential moving average of the true range, but using the standard alpha weight instead of Wilder's . It also calculates the average deviation of the range average, and displays it as an offset. This helps not only identify a change more quickly, but also its impact.
FREE

FRB Aggression Balance - Indicator shows the Agression Balance of the TIMEFRAMES chosen by the user through a histogram in a new window. - This indicator can only be used if the broker provides data on Volumes. Forex market brokers do not report this data. - B3 (Bovespa - Brazil) informs the data and with that it is possible to use it in Brazilian brokerages.
Settings Color - Define the color that will be shown in the histogram. Use Historical Data - Defines whether the indicator will calcu
FREE

A simple and highly effective Strength and Weakness currency indicator that can be used to aid your fundamental and technical analysis for winning trade decisions.
The indicator is very easy to use and can be applied to all time frames.
FX Tiger uses an advanced algorithm to calculate a score table for all major currencies. Green indicates currency strength and red indicates currency weakness. Once you have identified the strong and weak currencies, pair strong versus weak currencies and co
FREE
Reverse TradeCopier for Followers can copy trades from an account that is running Reverse TradeCopier for Source . Features: Copies trades from one source (master) account to multiple following (slave) accounts. Allow investor (read only) password for source (master) account. There are no complicated settings and input parameters, everything is easy. Works with different brokers. Works with different quotes symbols (EURUSD_FX, eurusd_m, etc.). Can copy orders from 4-digit quotes platform to 5-
FREE

SterlingSniperBot is an advanced trading algorithm meticulously designed for the GBP/USD currency pair, specifically tailored to operate on 4-hour bars and synchronize seamlessly with brokers in the UTC+2 time zone. This sophisticated bot stands out as a precision instrument in the world of forex trading. Key Features: Timeframe Optimization: Operating exclusively on 4-hour bars, SterlingSniperBot focuses on capturing strategic trading opportunities within this specific time frame, aligning with
FREE

There are thousands, if not millions, of strategies on the internet, but only less than 10% work and of those even less have stood the test of time. Very few strategies have successfully weathered the 2008-2009 financial crisis, 2020 covid effects on the markets and all other unforeseen events that have affected the market in the last 2 decades. That being said, the strategy I feature in this episode does just that, the epitome of stability as I’ll show in a 20 year back-test.
The source of
FREE

This indicator shows both GMT time and your broker's time on the chart.
Simply attach the indicator to a chart, and you will see the GMT time and your broker's time displayed in the top left corner, as shown in the screenshot. By using this indicator, you can always stay informed about your broker's time, which is especially useful during daylight saving changes.
You won't have to worry about whether your broker follows the US or EU schedule, as the indicator automatically adjusts to reflect a
FREE

A professional tool for trading - the divergence indicator between the AC and the price, which allows you to receive a signal about a trend reversal in a timely manner or catch price pullback movements (depending on the settings). The indicator settings allow you to adjust the strength of the divergence due to the angle of the AC peaks and the percentage change in price, which makes it possible to fine-tune the signal strength. The indicator code is optimized and is tested very quickly as part
FREE
Introducing the Moving average crossing template which is an Expert advisor template utility for two moving averages for the the cross over strategy where it enters trades based on the crossing of your specified moving moving averages. You can select the fast moving average and the slow moving average values of your choice. you can choose your preferred trade volume. you can choose your preferred number of trades to execute. you can add your stop loss and take profit join my channel for free
FREE
Background
This product is a practical tool to check the market based on the cycle theory . When you need to use multi cycle charts to analyze a symbol , manually adding charts with different cycles and applying templates is a very large cost. This product can help you quickly add multi cycle charts of one or more symbols, and uniformly apply the same template . After adding, you can drag the charts to the sub screen, which is suitable for multi screen analysis. Usage Method Apply this script t
FREE

The indicator is built on a principle similar to neural networks, and it calculates a multidimensional polynomial. When you install it on a chart or make changes to the indicator's parameters, or when you switch the chart period, the indicator is initially initialized. During initialization, not only the entire period of the chart is recalculated, but also the indicator is self-trained. The indicator's parameters include Sensitivity, Forecast, and degree of harmonization. The indicator theoretic
FREE

XFlow shows an expanding price channel that helps determine the trend and the moments of its reversal. It is also used when accompanying transactions to set take profit/stop loss and averages. It has practically no parameters and is very easy to use - just specify an important moment in the history for you and the indicator will calculate the price channel. This is a demo version limited to CHF currency pairs. Designed to familiarize you with the interactive use of XFlow DISPLAYED LINES ROTATE
FREE
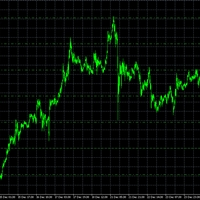
SaTo EA simple for free. 1. Double MA indicator for Entry signal 2. RSI for trend filter (Uptrend: RSI value greater than RSI level, Downtrend: RSI value less than RSI level ) 3. MACD for trend filter (Uptrend: MACD greater than signal , Downtrend: MACD less signal ) Buy signal : Fast MA greater than Slow MA, RSI value greater than RSI level, MACD greater than signal Sell signal : Fast MA less than Slow MA, RSI value less than RSI level, MACD less signal
FREE

'Circle Rising Point' is an indicator based on the cycle theory. No matter whether your trading cycle is short or long, you can use this indicator to find the rise and fall points of different cycles and different bands. Therefore, the signals displayed to you on charts of different cycles are different, and applicable to left side transactions. This indicator is recommended to be used together with the multi cycle window for analysis. Indicator introduction Applicable products This indicator is
FREE

This indicator is able to determine the price levels at which there was the most volume for the specified period of history. In the future, the price often bounces off such levels, and this can be successfully applied in trading. They are displayed as lines, some parameters for determining the levels can be adjusted. This indicator is simple, therefore, it does not report signals, and only builds levels on EUR/USD. Parameters
HistoryBars - the number of bars to determine the near volume levels;
FREE

Highly configurable Relative Vigor Index (RVI) indicator.
Features: Highly customizable alert functions (at levels, crosses, direction changes via email, push, sound, popup) Multi timeframe ability ( higher and lower timeframes also) Color customization (at levels, crosses, direction changes) Linear interpolation and histogram mode options Works on strategy tester in multi timeframe mode (at weekend without ticks also) Adjustable Levels Parameters:
RVI Timeframe: You can set the lower/highe
FREE

Based on two MA line indicators.
Looking at the histogram, if the value is greater than 0, the uptrend will increase, the bigger the value, the stronger the uptrend will be and vice versa, if the value is less than 0, the downtrend will decrease, the smaller the value, the stronger the downtrend . The necessary condition when entering a buy order is that the first histogram is greater than 0 and the current candle is closed, and enter the order when the second histogram appears. The necessary
FREE

Color Candle Indicator. The indicator implements a breakout system using the channel. When price exits the gray channel, the candlestick color changes to the color corresponding to trend direction. Blue for growth, yellow color for fall. Bright colors denote coincidence of trend direction and direction of a candlestick. Dark colors correspond to the situation when the direction of a candlestick is opposite to trend.
FREE

Volumes ******************* Volumes для платформы секундных графиков Micro . ********************* Секундный график на порядок увеличит точность ваших входов и выходов. Секундный период , в привычном формате, позволит увидеть то, что ранее было скрыто. Бесплатные индикаторы, дополнят визуальную картину, что, в совокупности выведет вашу торговлю на новый уровень. Идеально подходит как скальперам, так и трейдерам торгующим внутри дня. Индикатор Volumes для платформы Micro. Входные парам
FREE

Это специальная утилита, для подключения внешнего индикатора к торговой панели . Она позволяет получать данные из буфера индикатора и рисует стрелочные объекты для передачи их в торговую панель. Входные параметры
Number of call buffer - номер индикатора для покупки Number of sell buffer -номер индикатора для продажи Indicator window - окно индикатора Indicator position in list - позиция индикатора в списке Default value of indicator - значения по умолчанию для индикатора Show information - пока
FREE

Indicator of Stowell's Three-Bar Net Line. In this indicator, the number of bars used for determining the lines can be defined in the settings. With the default settings, the indicator draws arrows in the areas of the line breakout. The lines are not displayed on the chart by default. but can be enabled.
Parameters Alerts - enable alerts when arrows appear. Arrows appear on a forming bar and can disappear during bar formation. Therefore, it is recommended to wait for the bar with the arrow to
FREE

NEW : integration with Ofir Signals to send personalized alerts
Ofir Notify is a tool which send alerts on trades to Telegram Alert on any event concerning a position : Opening, Closing, modification (SL, TP) Send alerts to Chats, Groups and Channel Alert on Equity change Display Risk, Reward and progress of profit/lost for each position Customization of alerts Sending charts screenshots with alerts Send signals from your indicators or experts Multi-lingual NEW : version 2 brings integration
FREE

(Feel free to download this at absolutely no cost, if you like it I have a scalping manager here: https://www.mql5.com/en/market/product/101312 )
[Feel free to suggest on improvements that can be implemented. This EA will forever remain free.]
Timeframe: 5 Min upwards (The 1 minute timeframe has very short candles, stoploss cannot be set) Currencies: Multi
Settings: Lotsize: the trading volume for the EA How long a position will be held: 900 000 milliseconds for the 5 minute time or an eq
FREE

This indicator will show the the change of volumes via 2 lines of SMA: . Fast line (default is 5 candles) . Slow line (default is 13 candles) We can use the crossing point of fast line and slow line to know investors are interesting in current price or not. Pay attention: The crossing point is not signal for entry. Absolutely that we must use in combination with other indicators for sure. Parameters: . Fast line periods: the periods (candles) to calculate SMA of fast line . Slow line periods: th
FREE

Automatically protect you positions with Raba BreakEven and Trailing StopLoss EA. Functionalities: Automatic break even. Automatic trailing stoploss
I you have any doubt you can leave it in comments and I will anwer it asap. If you found this tool helpful for you, a comment and a good rating will be appreciated. Also any proposal will be taken into account for future versions.
FREE

Данный индикатор показывает объем каждого бара (видимый диапазон) в пунктах. Гибкие настройки отображения значений. Возможна настройка параметров показа. Индикатор создавался для личного пользования, анализа графиков. Параметры: Color - цвет текстовых меток; Position - позиция метки: 0 - снизу, 1 - сверху; FontSize - размер шрифта; Angle - угол наклона текста; GapPoints - отступ по вертикальной оси.
FREE

This indicator looks for 3 rather strong patterns: Spinning Top pattern Hammer or Hanging Man Inverted Hammer or Shooting Star These patterns may indicate a trend continuation or its reversal, depending on the location of the patterns.
Input parameters Distance - distance between the signal and the formed signal Note: the higher the timeframe, the greater the value should be used in Distance to display the signal correctly
Indicator Features Suitable for any currency pair Operating timeframe
FREE

• IMPORTANT! Test this EA on a DEMO account carefully before using it in the real market. • This Trade Manager (EA) works only on MetaTrader5 . There will NOT be a MetaTrader4 version! • Updates to this EA will be made solely at my own discretion. I do NOT take feature requests. • I have tested/used this EA only for trading DAX CFDs (DE40, GER40) on various brokers. • I don’t know if it works as expected with FX, Metals, Oil, Crypto etc. or on any broker
FREE

A script for closing positions If you need to quickly close several positions, this script will make all the routine for you! The script does not have any input parameters. Allow AutoTrading before running the script. Usage:
Run the script on a chart. If you need to specify the maximal deviation and the number of attempts to close positions, use the script with input parameters https://www.mql5.com/en/market/product/625 You can download MetaTrader 4 version here: https://www.mql5.com/en/market
FREE

O "Ouro Trader" é um robô financeiro projetado para ajudar investidores e traders a tomar decisões de investimento mais consistentes e lucrativas no mercado de ouro. O robô utiliza algoritmos avançados de análise de dados para analisar as tendências do mercado de ouro em tempo real e fornecer informações sobre quando comprar, vender ou manter ativos de ouro. Com o "Ouro Trader", os investidores podem se beneficiar de anos de experiência e conhecimento de especialistas em investimentos, sem prec
FREE

This indicator displays the spread with extra options Simple and easy to use and fully customisable: View as Pips or Pipettes Chart symbol can be hidden Text display can be changed Change colour and text styles Add or hide a decimal point Spacing options between inputs Default screen positions Screen position inputs
Pro version includes: Drag and drop box on the screen Add an alert when the spread is too high Alert colours for text and text box changeable
How to use 1. Simply use the defaul
FREE

Бинарный индикатор находит свечной паттерн "Поглощение" и рисует соответствующий сигнал для входа рынок. Имеет встроенные фильтры и панель для просчета количества успешных сделок. Демо версия является ознакомительной, в ней нет возможности изменять параметры. Полная версия . Особенности Работает для всех валютных пар и любых таймфреймов. Индикатор рассматривает комбинацию из 2-х или 3-х свечей в зависимости от настроек. Имеется возможность фильтровать сигналы путем настройки количества свеч
FREE

Indicator that show candlestick bars with an different sampling method than time fixed. Real time data is sourced to the indicator and it may be used as substitute of the default graph. Each bar is formed when a predefined amount of ticks is received, showing in the graph the OHLC of this clusteri of ticks. The input variable is the amount of ticks of each bar. It's a different approach of sampling, the amount of bars is proportional to the amount of negotiations insted of a sample in a fixed am
FREE

This is a demo version of the Candle Absorption Full indicator. It has limitations on operation. This indicator detects the Engulfing candlestick pattern and draws the corresponding market entry signal.
Features It works only with EURUSD on timeframes M1 and M5. The indicator analyzes a combination of 2 or 3 candlesticks depending on settings. The number of pre-calculated bars (signals) is configurable. The indicator can send an alert to notify of a found signal. Signal can be filtered by sett
FREE

A unique professional tool is a divergence/convergence indicator between AC and price, which allows you to receive a signal about a trend reversal in a timely manner or catch price pullback movements (depending on the settings). It is indispensable for those who trade divergences manually or with an Expert Advisor. The indicator settings allow you to adjust the strength of the divergence /convergence due to the angle of the AC peaks and the percentage change in price, which makes it possible to
FREE

Pivot points have been a trading strategy for a long time, originally used by floor traders. Using this method, you can understand where the market is going in a day through a few simple calculations.
The pivot point in the pivot point method is the turning point of the market direction during the day. A series of points can be obtained by simply calculating the high, low and closing price of the previous day. These points may form key support and resistance lines. The pivot point, support an
FREE
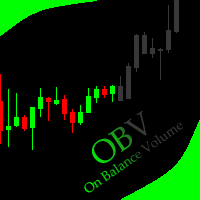
This indicator allows to hide OBV (on all MT5 timeframes) from a date define by the user with a vertical line (Alone) or a panel (with "Hidden Candles"). Indicator Inputs: Apply To Information on "On Balance Volume" indicator is available here: https://www.metatrader4.com/en/trading-platform/help/analytics/tech_indicators/on_balance_volume ************************************************************* Hey traders!! Give me your feeds! We are a community here and we have the same objective....
FREE

A big thank you for your interest in our product. MustForex Smooth V6 Newly developed Premium Expert advisor
Its follows a determined Swing strategy. It trades by following and analysing indicators like Bollinger Bands/MACD/Momentum/CCI/RSI to determine entry and exit point. Profits can be locked by the adjustable trailing stop/Break Even inputs. Every trade protected with stop loss and take profit to protect your account. Since the strategy works with quick swing trade profits it is high
FREE

Free version. Only works on EURUSD Do you want to always know in a quick glance where price is going? Are you tired of looking back and forth between different timeframes to understand that? This indicator might just be what you were looking for. Trend Signal Multitimeframe shows you if the current price is higher or lower than N. candles ago, on the various timeframes. It also displays how many pips higher or lower current price is compared to N. candles ago. Number N. is customizable The data
FREE

Simple countdown indicator for the next candle. Only claim is to be light! The indicator inserts a text object to the right of the current price and calculates how much time is left for the new bar, showing this to the trader. Leave your comment if the indicator helped you in any way! If you have any suggestions, let me know to evaluate the improvements. Success and Good Trades!
FREE

Swiss Holy Grail Indicator Motivation and functioning The HolyGrail indicator serves to optimize an entry. At that very moment I caught myself, that I went short in an uptrend, so I got into a trade in an anti-cyclical way. Or I have entered into a much too mature trend. This indicator should prevent such errors: One should always be aware of whether it is pro- or anticyclic entry, and one must always know about the maturity of the trend. Don't enter an old trend. Linda Raschke advises to buy th
FREE
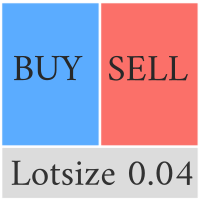
Compliement your normal MT5 Buy/Sell panel with this automatic lot size panel. This product is free without any limitations. There will be a pro verision later with additional functionality, but my motto is to always have awesome free products. It automatically places the stop and sizes the lot according to the given ATR for risk. You have to try it to experience it!
Now I can't trade manually without it.
It's turned out to be much more intuitive than I would think before creating it.
The
FREE
3つの時間軸を分析に使います。 3つの時間軸が、全て同じ方向になった場合、上昇方向または、下降方向になった場合 その方向にエントリーをします。 決済は、上記同様全て同じ方向になった場合、上昇方向または、下降方向になった場合 その方向に決済をかけます。
時間軸は、変数として定義されています。 移動平均も、各変数として定義されています。
基本的に、単発ポジションをもち、追加購入はしません。 途中決済は、手動で行うことも可能です。 その場合、EA内では、ポジションなしとして処理されます。
ロット数、利益確保、ストップロスも変数として設定できます。
使用する前に、最適化等を行ったほうが精度をあげてトレードできると思います。 また、100%任せきりにするのは、おすすめしません。
FREE
Do you know why the MetaTrader Market is the best place to sell trading strategies and technical indicators? No need for advertising or software protection, no payment troubles. Everything is provided in the MetaTrader Market.
You are missing trading opportunities:
- Free trading apps
- Over 8,000 signals for copying
- Economic news for exploring financial markets
Registration
Log in
If you do not have an account, please register
Allow the use of cookies to log in to the MQL5.com website.
Please enable the necessary setting in your browser, otherwise you will not be able to log in.