Spread trading in Meta Trader - page 253
You are missing trading opportunities:
- Free trading apps
- Over 8,000 signals for copying
- Economic news for exploring financial markets
Registration
Log in
You agree to website policy and terms of use
If you do not have an account, please register
Currency market, AUD/JPY(Spread 6AM4 - 6JM4, March outlook)
The attention of stock market speculators today will be drawn to the results of the two-day US Federal Reserve Committee meeting. The meeting started yesterday and the results will be published at the beginning of the American session. We continue our seasonal analysis of the currency instruments. A little earlier (the day before yesterday), we already reviewed the GBPCHF (British pound - Swiss franc) pair growth prospects in our review - https://www.mql5.com/ru/forum/122468/page252#929363.
We should add that many currency analysts now consider the Swiss currency to be overbought against other major currencies. Tomorrow, following the results of the Swiss National Bank meeting, an active downward movement of the franc is possible.
 [/url].
Today we will look at a profitable seasonal pattern in another currency pair: the Australian dollar - Japanese yen. From the last days of the second decade of March the demand for the Australian currency begins to exceed the demand for the Japanese currency. Let's look at a graph of multi-year averaged seasonal (3-5-10) trends of AUDJPY:
Under the graph in the figure there are statistics of AUDJPY purchases in the last fourteen years from March 20 to April 10. Eleven of such purchases turned out to be profitable and only three of them were losing. The average statistical profit (+435 points) in the analyzed period is almost twice as big as the average loss on a standard 4-digit currency scale.
At the moment, since the beginning of the current week the pair AUDJPY has already gained a little:
Closely monitor the fundamental news on AUDUSD and USDJPY, and look for technical opportunities to buy the currency pair strategically (long-term). Or for short-term (by our seasonal standards) buying on the pullbacks, using the means of standard technical analysis on small timeframes H1-H4.
Source: https://panteon-finance.com/analytics/view/valjutnyj_rynok_audjpy_martovskie_perspektivy
Futures contracts on precious metals started to fall on Wednesday, right from the opening session (see chart at the end). After the US Federal Reserve report was released they continued falling even more actively. Thus, by the close of the trading session, gold had fallen by almost four per cent in a strong three-day fall in price since March 15! Silver suffered smaller losses but also closed yesterday at the trading day's low. Analysts expect the price of the precious metals to fall further, with gold reaching the 1300 level in the coming days.
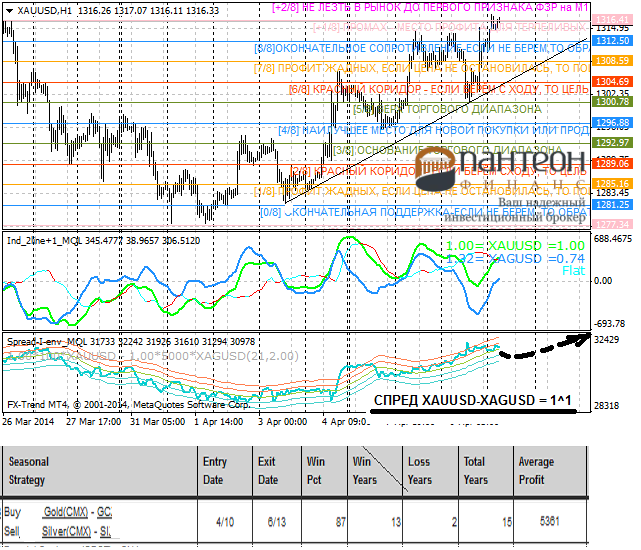
Meanwhile, since the third decade of March, there has also been a seasonal decline in the gold-silver inter-commodity spread. Let's see a graph of multi-year averaged seasonal trends (3-5-8-13) for the GCJ4 - SIK4 = 1^1 spread futures contracts:
Here we can see that a seasonal Down-movement of the spread is expected for at least the next few weeks! The statistical table for the last 14 years below the chart gives a more concrete idea of the profit potential of this movement. There were nine profitable entries when the GC - SI spread = 1^1 was sold between March 20 and April 15! The average profit/loss ratio (scaled to the standard gold scale) was +502 ticks/-179 ticks! Figures are quite satisfactory!
In the well-known MT4 trading platform you can take any available futures contracts of the analyzed instruments, including spot versions of SELL XAUUSD - BUY XAGUSD = 1^1:
The seasonal decline in the spread appears to have already taken off since the beginning of this week. And now all we have to do on small timeframes (H1-H4) is to look for technical opportunities to sell "instrument XAU-XAG" inside the day.
Source: https://panteon-finance.com/analytics/view/dragmetally_zoloto-serebro_mart-aprelq
======== Hi all!
By numerous requests of the present visitors I am posting the corrected price line and spread indicators. Both versions are adapted for the updated MT4 platform. They are made by professional programmers from https://www.mql5.com/ru/job.
In the "download" is also a template for the gold-silver spread (tf=M30-H1) according to the above chart (see also previous post). When MT4 is running - right after the start make sure to click over thef, so that the indulators "self-adjust". Indicators are displayed only when the Internet is connected.
Currency Market, AUD/JPY(Spread 6AM4 - 6JM4, March Outlook)
A little earlier (the day before yesterday) in our review we have already looked at the seasonal prospects of the GBPCHF (British Pound - Swiss Franc) pair - https://www.mql5.com/ru/forum/122468/page252#929363.
Today let's look at the profitable seasonal pattern of another currency pair: Australian dollar - Japanese yen. Since the last days of the second decade of March, demand for the Australian currency begins to exceed demand for the Japanese currency.......
Source: https://panteon-finance.com/analytics/view/valjutnyj_rynok_audjpy_martovskie_perspektivy
Foreign exchange market, USDCAD (seasonal outlook)
By the numerous requests of currency trading fans, we continue to review the promising seasonal trends of various pairs! In our latest currency reports we analyzed the March UP-trends of GBPCHF and AUDJPY, which are now very confident and profitable in their multi-year seasonal trends:
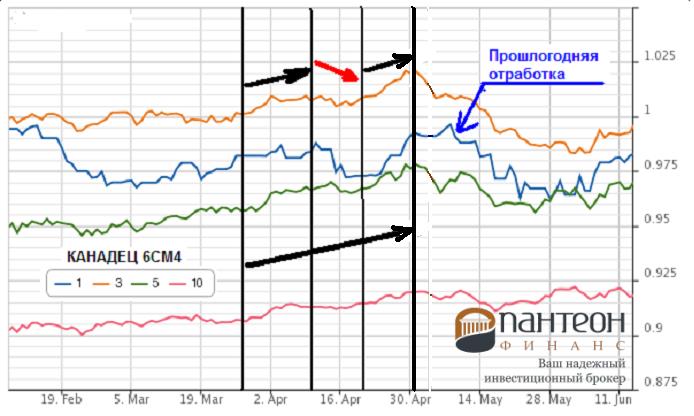
Let me remind you that these currency seasonal patterns of late March and early April are largely due to the peculiarities of the countries' tax legislations (usually the end of the current quarter determines the due dates of annual tax returns). Today, let's look at an interesting seasonal pattern for the Canadian. Below is a graph of the multi-year seasonal (10-5-3) trends of the June Canadian 6CM4 futures contract:
You can clearly see that from the last days of March to the first days of May-month, the demand for the Canadian currency is increasing. And here is how the USDCAD futures buying (or selling) statistics look like from March 28 to May 1 for the last fourteen years:
The stats numbers look good! And for a strategic buy of 6CM4 (or sell of USDCAD), perhaps there is good reason! However, if we take a closer look at the seasonal chart, we will notice that the UP-trend of the instrument is interrupted in the middle of the analyzed time interval. Approximately from the end of the first decade of April there is a Down-correction of the futures! Thus, it turns out that there is a reason to divide the analyzed time interval into three subranges. And the first entry - buy 6CM4 (sell USDCHF) to hold the next week and a half. Here are the statistics of such entry for the last fourteen years:
Here the ratio of profit/loss trades (+12/-2) and average profit/loss values (+75 ticks/-7 ticks on a standard 4-digit scale) look more attractive than the long-term "strategic" entry described above.
To determine a specific entry point for the USDCAD pair selling within a day - you should use the means of standard technical analysis, as well as analytical materials on currency pairs!
Source: https://panteon-finance.com/analytics/view/valjutnyj_rynok_usdcad_sezonnye_perspektivy
Currency market, AUD/JPY(Spread 6AM4 - 6JM4, March outlook)
The attention of stock market speculators today will be drawn to the results of the two-day US Federal Reserve Committee meeting. The meeting started yesterday and the results will be published at the beginning of the American session. We continue our seasonal analysis of the currency instruments. A little earlier (the day before yesterday), we already reviewed the GBPCHF (British pound - Swiss franc) pair growth prospects in our review - https://www.mql5.com/ru/forum/122468/page252#929363.
We should add that many currency analysts now consider the Swiss currency to be overbought against other major currencies. Tomorrow, following the results of the Swiss National Bank meeting, an active downward movement of the franc is possible.
Today we will look at a profitable seasonal pattern in another currency pair: the Australian dollar - Japanese yen. Since the last days of the second decade of March the demand for the Australian currency begins to exceed the demand for the Japanese currency. Let's look at a graph of multi-year averaged seasonal (3-5-10) trends of AUDJPY:
[/url].
Below the graph in the figure there are statistics of AUDJPY purchases in the last fourteen years from March 20 to April 10. Eleven of such purchases turned out to be profitable and only three of them were losing. The average statistical profit (+435 points) in the analyzed period is almost twice as big as the average loss on a standard 4-digit currency scale.
At the moment, since the beginning of the current week the pair AUDJPY has already gained a little:
Closely monitor the fundamental news on AUDUSD and USDJPY, and look for technical opportunities to buy the currency pair strategically (long-term). Or for short-term (by our seasonal standards) buying on the pullbacks, using the means of standard technical analysis on small timeframes H1-H4.
Source: https://panteon-finance.com/analytics/view/valjutnyj_rynok_audjpy_martovskie_perspektivy
Nice workout - this is my second time entering with limit lots on a pullback. Thank you Leonid!
Precious Metals (Gold-Silver Spread)
(food for thought)
Gold has continued its steady rise since early April. The price retreated to 1300 before the release of the latest US Federal Reserve meeting minutes on Wednesday, but uncertainty over US monetary policy led to dollar weakness in the following hours and lifted the precious metal to two-week highs. The XAUUSD price was also boosted by stock market worries over the situation in Ukraine. As a reminder, the current multi-year seasonality also suggests that precious metal prices will rise in the next few weeks! In addition, commodity prices are rising due to political instability in Eastern Europe. These factors could well push gold prices to even higher levels in the next few days.
Meanwhile, at the moment, to reduce trading risks, the most interesting spread of precious metals is Gold-Silver. English-language seasonal websites recommend to buy the spread(BUY XAUUSD - SELL XAGUSD = 1^1) from the beginning of the second decade of April. The spread is increasing until the first days of May!
The statistics of such a paired entry is shown in the table below the chart in the figure above. Over the last fifteen years, from April 10 to May 13, there have been thirteen profitable entries! While the average profit was +$5351 per contract (lot) of spread.
However, this spread is traditionally quite capricious, so in the MT4 trading platform is better to work with small fractional lots, short-term entries on the pullbacks on small timeframes (for example, H1 or M30).
Source: https://panteon-finance.com/analytics/view/dragmetally_spred_zoloto-serebro
================================
Indicators and spread template - in the post above: https://www.mql5.com/ru/forum/122468/page253#932240
Canadian-Dollar spread (seasonal outlook)
By popular demand of currency trading fans we return to the most promising seasonal trends of different pairs. Today we will return to the analysis of USDCAD currency pair. We have already reviewed this instrument in the end of the third decade of the last March. Again let's look at a chart of multiyear seasonal (3-5-10) averaged trends of the June Canadian 6CM4 futures contract (note that this currency pair USDCAD moves in "a mirror counter" with the USDCAD currency pair with the same name):
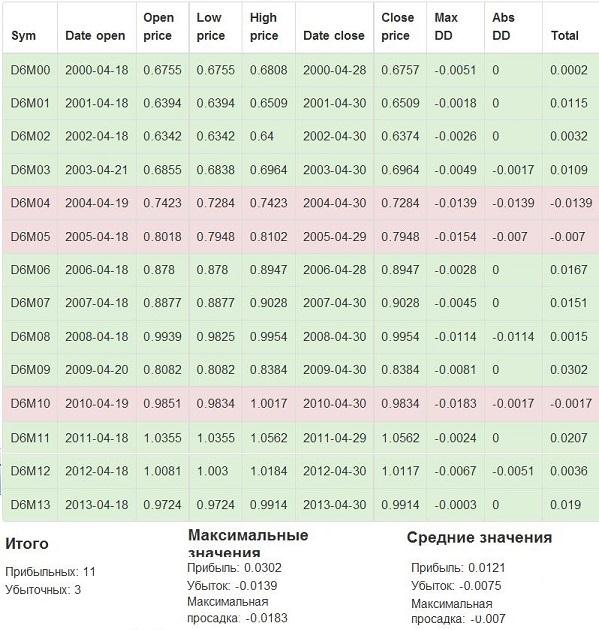
Recall that from the end of March to the first days of May-month, the price of the Canadian currency is rising. However, it is noticeable that the UP-trend of the futures breaks down in the middle of this time interval. Approximately from the beginning of the second decade of the month a Down-correction of 6CM4 begins! Thus, it turns out that the analyzed time interval is divided into three sub-ranges. And the last entry - buying 6CM4 (selling USDCAD) is reasonable to hold for the next week and a half. Here is a detailed table of statistics for this entry over the last fourteen years from April 18 to April 30:
The ratio of profit/loss trades (+11/-3) and average profit/loss values (+121 ticks/-75 ticks on the usual 4-digit scale) turned out quite satisfactory!
It should be noted that USDCAD currency pair has observed the previous Down and UP seasonality of late March - mid-April (see the chart above):
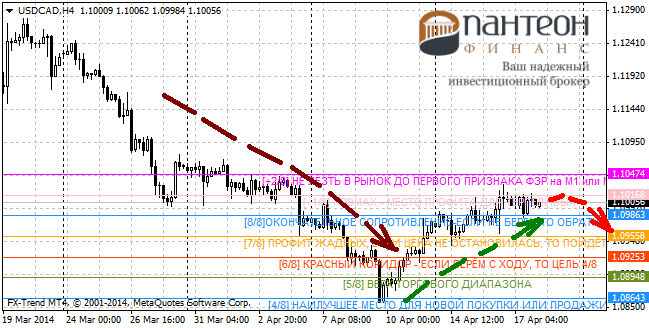
To find a specific moment to enter the USDCAD pair seasonal selling within a day - you should use the usual means of standard technical analysis, as well as analytical and fundamental materials published every day in the world news feeds for the analyzed instruments.
Source: https://panteon-finance.com/analytics/view/valjutnyj_rynok_usdcad_sezonnye_perspektivy
leonid553:
By popular demand of currency trading fans, we return to the most promising seasonal trends of various pairs. Today we will return to the analysis of the currency pair USDCAD....
To find a specific moment to enter the USDCAD pair seasonal selling within the day - you should use the usual means of standard technical analysis, as well as analytical and fundamental materials, that are daily published in the world news feeds for the analyzed symbol.
The April Up-Seasonality of USDCAD is accurate almost to the day!
Then, according to the seasonality USDCAD pair turns around and starts to grow till the middle of May. Below is the seasonal chart of the Canadian 6CM futures, Canadian-Dollar spread (Let's remind that this currency pair USDCAD is moving "in the mirror mode" with the USDCAD currency pair with the same name)
Entry statistics for the last 14 years from May 2 to May 17 are given above, under the seasonal chart on a standard 4-digit scale. Interestingly, 5 years of 14 years the absolute drawdown of such entries(BUY USDCAD or SELL 6CM4)L was equal to zero, i.e. none at all!
Good luck to all!
.... Currency instruments are often very dubious about their seasonality. Nevertheless, the long-term entry described below is currently present even on well-known English-language seasonal websites! So, for lovers of currency trading we suggest to look at seasonal prospects of the spread: 6EZ4 - 6JZ4 (euro - yen), - to implement an entry in the MT4 trading platform, you can take the EURJPY currency pair, there is not much difference. Below is a graph of multiyear averaged seasonal (5-10-15-20-30 years) trends of this spread (black price line on the seasonal graph is the current price in 2014):
The 6E-6J spread (or the EURJPY currency pair) is expected to rise almost until the last days of the next, October month! The lower chart shows a fairly satisfactory last year's 2013 seasonal performance of the instrument in the indicated timeframe!
As usual, for a more specific evaluation of a suggested entry(BUY EURJPY), let's look at the complete statistics of 6E-6J spread purchases within the specified time interval over the last fourteen years. A statistical table of spread purchases from September 22 to October 26 is shown in the figure below:
Percentage of profitable entries (+12/-2) and average profit ( +179 ticks on 4-digit standard scale of currency instruments) look quite satisfactory! But the value of the average loss and the maximum drawdown were badly affected by the pre-crisis year 2008, when in a given time interval the Euro strongly and abnormally fell against the Yen!
The current situation on the EURJPY currency pair is shown on the chart below (H1 timeframe). At the moment from the first days of September the instrument chart clearly shows the presence of the UP-trend. According to most of the currency observers, the pair has quite strong bullish aspirations in the long term!
However, in the short term (according to the analysts) EURJPY becomes vulnerable if the price falls below 139.00. In this case, the threat to the assumed bullish scenario will become quite tangible!
In order to reduce the risk, we assume to work in buying the pair in the next few weeks - short term! Using to determine the best entry/exit points the usual signals of the standard technical analysis on small timeframes (M30-H1-H4).
Good luck to everyone!
-----------------------------
Source: http://ruforum.mt5.com/threads/62505-sezonnaya-torgovlya/page22