Market etiquette or good manners in a minefield - page 57
You are missing trading opportunities:
- Free trading apps
- Over 8,000 signals for copying
- Economic news for exploring financial markets
Registration
Log in
You agree to website policy and terms of use
If you do not have an account, please register
Here we go again with the market's OTO. The fact is that there is a delay, of course, because the middle of the bar comes immediately after its opening, but, on the other hand, it does not exist, because when the bar is already formed, we do not care when exactly inside the bar this golden mean has come. I've seen bars that start and end in the middle. The essence of your argument with Neutron is not worth a single word. It is because the bars are not bars to Neutron, because a quotient is not quantized by time, while a bar is a BAR to you.
You have different "frames of reference" - that's all there is to it.
No, not old... >> oh, Superstar!
Are you still being foolish, my dear? Old age really is no fun.
Here we go again with the market's OTO. The fact is that there is a delay, of course, because the middle of the bar comes immediately after its opening, but, on the other hand, it does not exist, because when the bar is already formed, nobody cares when this golden mean inside the bar has come. I've seen bars that start and end with the middle. The essence of your argument with Neutron is not worth a single word. It is because the bars are not bars to Neutron, because a quotient is not quantized by time, while a bar is a BAR to you.
You have different "frames of reference" - that's all there is to it.
The argument is about many things, this one in particular. Sergei made a "convincing" argument for it. But it seems that I am not able to explain a simple thing. There is no delay, there is no delay at all. It can't be there by definition. The data on which these figures are derived doesn't overlap. There's no phase, the numbers are completely equal.
Addendum: It's like taking two points on a sine wave and saying that at x in increments of 0.1 and at x in increments of 10.0 there is a delay.
That's OK - we'll stick to our opinion...
Give it a try.
So good luck :). Taylor series decomposition is even worse than into harmonics because a polynomial of non-zero degree has no limited range of values.
Besides from your words it turns out not a polynomial at all, but an ordinary SMA waving machine.
All right, then. Here's the idea itself. If you think deeply, there is no market force that would underestimate the importance of the 2nd, 4th and 11th bars compared to neighbouring bars. That is, one should expect neighbouring bars to have very close values. What happened 11 hours ago is just as important as what happened 12 hours ago. So, we should expect a smooth transition in weights from one bar to its neighbours. So, the curve that describes the weight as a function of the bar number (delay) should be smooth. If this is true, this curve w[n] can be approximated by a Taylor series, i.e. by a polynomial. You can, for example, fit a 3rd or 4th degree polynomial to your weights. The next assumption of my idea is as follows. Instead of optimization of weights themselves (you have 16 of them), optimize polynomial coefficients (a0+a1*n+a2*n^2+a3*n^3, you optimize a0...a3, you get 4 parameters total), and use formula a0+a1*n+a2*n^2+a3*n^3 for n-th bar. Much less calculations. Try it.
I am sincerely grateful to you for the idea, however, once in my childhood I heard (from the boys in the entrance hall), that if a mistake is found in the concept foundation, all further constructions can be disregarded, irrespective of their scientific attractiveness. You have an error in the idea of smoothness as a necessary functional for transition from one(market state) to another. Alas. I must disappoint you. the market transitions from A to Z without intermediate reverence. If it were otherwise - it would not be a forum, but a meeting of Soros.
Never mind... I'll give you a new idea (market concept), it is certainly more fruitful than the one you have had so far:
It's quite simple at first glance:
Regularity is a way for randomness to exist. The opposite is not true.
to Neutron
The product will not run on this operating system
went to get soap...
I can predict like that too, by the way. Even without an AR. :) But it didn't give me anything. I can guess "where" the price will go with an accuracy of 80% but I have no PROFITS. It's sad. ;)
The series (H+L)/2. I denote it by Mu for brevity. Suppose we can not accurately predict this value, but we can accurately predict the sign of difference Mu(n)- Mu(n+1). For example, for the current bar we know that the next delta Mu(n) - Mu(n+1) will be positive. Then we need to statistically estimate the new increment and from it go to Mu(n+1). Let's add the RMS estimation for the bar spread to this level. We obtain the trade level and I even drew a picture to enhance the artistic expression:
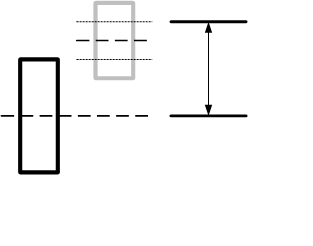
If frequencies of occurrence of these levels are large and commensurate with the spread, we may succeed. Do you really forecast this delta at 80%?
PS: I personally don't work that closely with price. Not much chance there, or rather no chance at all. I just got the idea that indeed it is possible to forecast not precisely, only in the direction. I made my own forecasts with such "technology": " Have you seen this picture?" at least for 24 hours on 15 min bars, here are examples of real forecasts, I will finish next testing - there will be more (just debugging, not all the astrolabe has been built yet):
'Testing Real Time Prediction Systems'
to gpwr
Yes, I somehow missed your penultimate post. There's an interesting question here: what makes you think that weight (in principle) can be a function of its own index from time? I think I understand the origin of your idea - you are looking at graphs of weights. There is a subtlety: in two different experiments (training results on the same training vector) these graphs (visually and topologically) may be significantly different, while the grid results (statistically) are substantially the same. If you even manage to find a satisfactory functional for training the network by the proposed method, the results of training (two consecutive experiments on the same vector) will be identical completely - i.e. it will not be a neural network, but something completely deterministic. As Neutron, who is already asleep, would say, such a network will be exactly trained for one vector, but will not be able to compose poems. Consequently, it is of no use in trading. Each successive count is not similar to the previous one (and to fresh ones), and a normal net does not even count on it. It roughly resembles a certain image which it has learned. If to replace approximately with exactly, the entropy of such a network will be equal to zero (i.e. a step to the left, a step to the right - firing squad, a hop on the spot - provocation).
Among other things I don't see special difference in training speed by your suggested method, because to change one coefficient of polynomial I'll need exactly the same resources, as to correct one weight, and there are n coefficients (for each weight), so what's the gain?
The series (H+L)/2. I denote it by Mu for brevity. Suppose we can not accurately predict this value, but we can accurately predict the sign of difference Mu(n) - Mu(n+1). For example, for the current bar we know that the next delta Mu(n) - Mu(n+1) will be positive. Then we need to statistically estimate the new increment and from it go to Mu(n+1). Let's add the RMS estimation for the bar spread to this level. We obtain a trading level and I even drew a picture to enhance the artistic expression:
If frequencies of occurrence of these levels are large and commensurate with the spread, we may succeed. Do you really forecast this delta by 80%?
Surprised to see the algorithm that demonstrates this very 80%. I am looking for an error. It looks very simple. It does not work that way.
а-а-а-а-а-а-а-а-а-а-а-!!!!! We need to see where the moon is, maybe that's the reason. I now understand the expression - "words are missing" Is that where the delay is???
Built it especially for you:
You can clearly see that the FZ is always there and is visually clearly visible on the sharp movements of the kotir.
You can see that the delay is always there, and it's easy to spot it visually on the sharp movements of the kotir. Learn the math, and the next time you come up with the next super-duper brilliant idea, for the implementation of which you think you need one or two research institutes and a cluster of PC, you think for a minute - maybe you just do not know or do not understand. After all, this is more likely than a "landmark discovery", in an area where everything has been trampled before you.
I propose a shortened way of describing all scales, in this case a polynomial. Here I'll show you with your example. You have learned your network on a certain input vector and obtained values of all weights w[n] where n=0...15.
I believe that paralocus quite rightly points out to you that your idea is based on the unconfirmed hypothesis of stationarity of market processes allocated to NS. Only in case of its confirmation we can expect some semblance of stationarity of NS weights and consequently applicability of the extrapolation method for finding weights without network training. But, if it were so, we would not retrain the grid at each new BP datum, but we have to, and this fact, though indirectly, but speaks in favor of non-stationarity of weights! Besides, you can always perform a numerical experiment and see how the weights of the trained grid behave from sample to sample. Shall we see?
For this purpose let's perform 500 experiments shifting by one bar each time and learning to predict the next one. We will teach the net anew at every bar. To avoid displaying the vector of weights all 500 times on one chart, we will average obtained values for each weight and display them showing the variance (dispersion of values) corresponding to each weight in the form of the handle plotted along the 1/e level:
The abscissa axis shows the number of the NS input, the ordinate axis the average value of the weight on this input, for a fully trained network. As can be seen, for the hour markers (fig. on the left), the values of weights are in the area of their statistical scatter (range of whiskers), which directly refutes the hypothesis of stationarity. The case is a little better on the minutes; statistically significant is the first input of NS (zero sample in the graph) that is responsible for the known antipersistence of kotier (negative correlation coefficient in a series of the first difference between neighboring samples) on small TFs.
Thus, it is premature to talk about the need to develop a method for approximating the NS weights by a polynomial.