XAUUSD Technical Analysis 12.01 - 19.01: Rally
Week 3 - 6H Chart: Bullish on my chart

Forum on trading, automated trading systems and testing trading strategies
newdigital, 2014.01.11 10:11
Outlook For Gold In 2014 (adapted from Forbes article)
Let’s take a look at the macro environment as we enter the new year:
- The inflation that gold enthusiasts have feared since the onset of the 2008 crisis is dead on arrival. The latest CPI figures show an inflation rate of just 1.2%, and energy prices are actually falling.
- The quantitative easing that fueled the inflation fears of the past few years is already being tapered, from $85 billion in bond purchases per month to $75 billion per month…with more tapering to come.
- The Federal budget deficit, though still far too high, continues to fall and is expected to be just 3.3% of GDP in fiscal year 2014.
- Gold miners are contemplating hedging their risk by selling their production forward, which will effectively cap the price of gold (and sends a very negative signal to the market).
- Hedge funds and other large institutional buyers—the driving force behind much of the rise in the spot price of gold in the past decade—appear to be abandoning gold if the outflows from gold ETFs are any indication. Gold ETF holdings are now at their lowest levels since 2008.
- Gold now has competition in the anti-establishment crowd from Bitcoin and other “virtual” currencies. (I think Bitcoin is a joke, mind you, but that doesn’t mean that it won’t continue to steal gold’s thunder for a while longer.)
The technical analysis for the previous post was made by Charles Lewis Sizemore, CFA, is the editor of Macro Trend Investor and chief investment officer of the investment firm Sizemore Capital.
==========
For now - the technical analysis which was made by Michael Boutros, Currency Strategist for dailyfx.com :
Forum on trading, automated trading systems and testing trading strategies
newdigital, 2014.01.12 10:51
Technical analysis for GOLD (based on this article)

Fundamental Forecast for Gold: Bullish
- Gold Set Up is Similar to 6 Months Ago
- Gold Selling May be Restrained if US Payrolls Top Forecasts
Expectations for a strong NFP report
had been building all week after ISM employment figures last week and a
robust APD private sector print this week topped consensus estimates. A
print of just 74K was well off expectations for a read of 196K+ and
although the unemployment rate dropped to 6.7% from 7%, the move was
largely a result of another massive contraction in the civilian labor
force. The loss of so called ‘discouraged workers’ has continued to put
artificial downside pressure on the headline unemployment figure with
the labor force participation rate falling back to 62.8%, its lowest
read since December (which was the lowest read since 1978).
From a technical standpoint, gold looks poised for a move higher with a breach above $1248 targeting key resistance at $1268/70. This region represents are more critical barrier and is defined by a three-way Fibonacci confluence & the December high. A compromise of this threshold constitutes a breakout of a larger structure dating back to the October high threatens our broader directional bias heading into 2014. Such a scenario looks for initial resistance targets at $1293 and $1325. A break below the monthly opening range low puts the broader trend back into focus with support targets eyed at $1151/60, $1125 and $1091. It’s important to note that we’ve put in a pretty clean monthly opening range, closing the week just below near-term resistance. Look for a break of this range offer further conviction on our corrective focus higher.
Technical analysis in the first post of this thread was made by me.
Forum on trading, automated trading systems and testing trading strategies
newdigital, 2014.01.13 05:37
Gold Market Traders – New Gold Bull Market Cycle Has Started (adapted from thetechnicaltraders article)
2013 was one of the worst years for gold in a generation and the
strangest part of it is that this loss came during a time in what should
have been a banner year for gold.
When the Fed launched its QE1 and QE2 programs, gold posted huge gains
but with QE3, we only had a brief rally in late 2012, it’s been all
downhill for there.
The price of gold over the last year highlights just how much Europe has
become a powerful driver behind gold vs. the US which has historically
been the main mover. When the European debt crisis started a few years
ago, people fearing a financial meltdown in Europe put a lot of their
money into gold as it was the save haven of choice.
However, with financial and political risk in Europe subsiding, we have
seen money leave gold and move into other markets, hence the big
outflows from gold ETF’s.
Other factors that have dragged on gold over the last year include
falling jewelry demand, the loss of its role as an inflation hedge with
deflation becoming more of a concern in some areas, also tax increases
on gold imports in India, and the supposedly improving economy in the
US. All these contributed to the selling of gold.
Gold and gold stocks crashed last year in the summer. They have since
been going through a stage one base. This suggests that 2014 will mark
the start of a new bull market for gold, gold mining stocks and
commodities.
Gold Market Traders & Manipulators Provide Contrarian Bullish Outlook
Gold market traders and manipulators like some of the commercial
banks/brokerage firms have been verbally slamming gold, and it turns out
many are not as negative as lead us to believe…
Goldman Sachs we all know are the biggest hypocrites. While advising
clients to sell gold in the second quarter of 2013, they bought a
stunning 3.7 million shares of the GLD. And when Venezuela needed to
raise cash and sell its gold, guess who jumped in to handle the
transaction? Yup, GS! So while they tell everyone to sell gold, they are
accumulating as much as they can without being obvious.
There is a lot more reasons and fundamentals to be bullish on commodities and gold, but that is not the point of this technical based report.
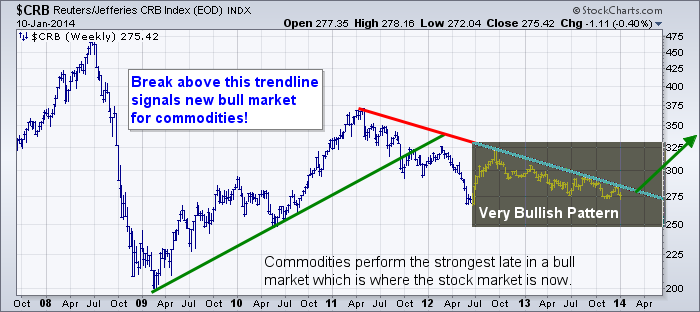
Weekly CRB Commodity Index – Bull Market Cycle About To Start
Taking a quick look at the CB index which is a basket of commodities, it looks as though a breakout above its down trend line will trigger a new bull market in the commodity sector. While this has not yet happened it looks s though it may happen in the next few months.
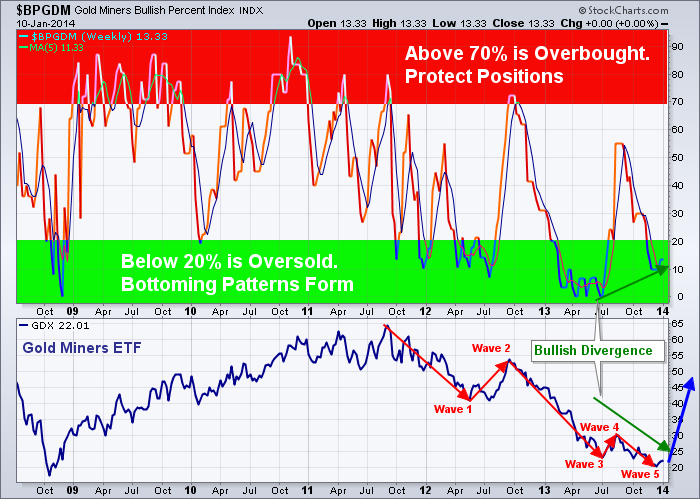
Gold Mining Bullish Percent Index – Weekly Chart
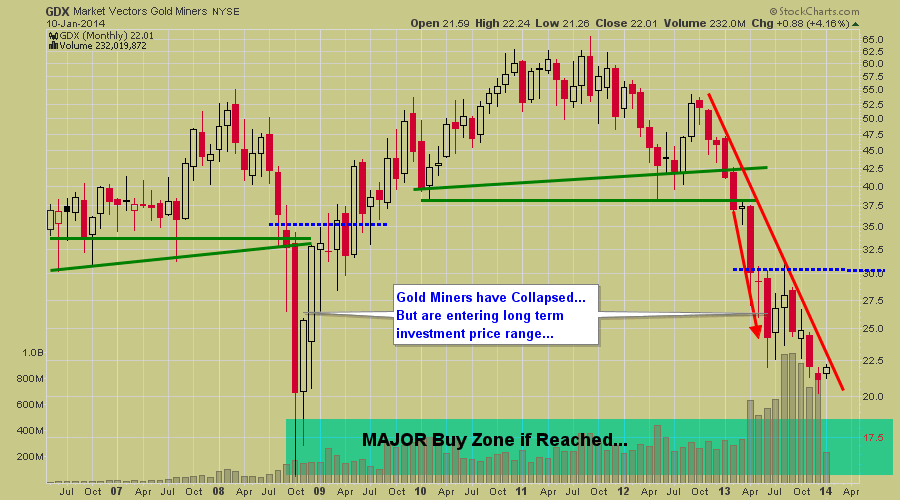
Gold Miners ETF – Monthly Chart
Gold stocks have not yet broken out to start a rally as you can see in the chart below. But the important thing to note is that the daily chart has formed a mini Stage 1 Basing patterns and could breakout this week to kick start a multi month/year rally.
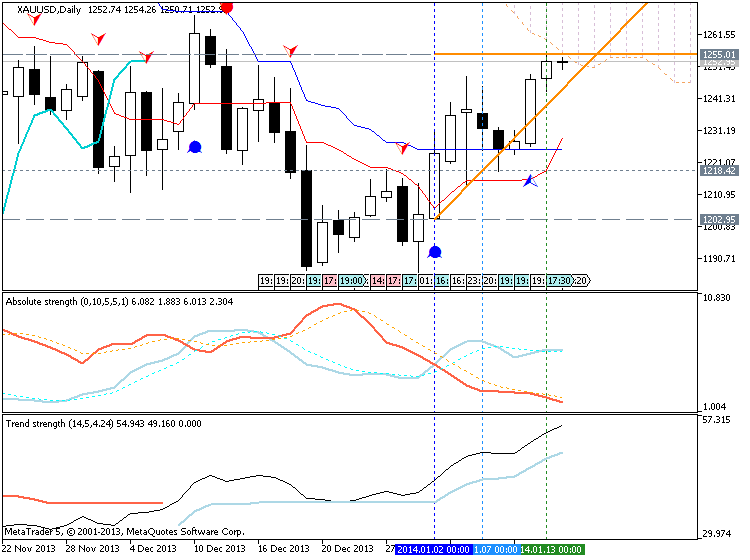
If the price will cross 1248.86 resistance so the rally may be started (good to open buy trade). If not so we will have the ranging market condition with flat within primary bearish
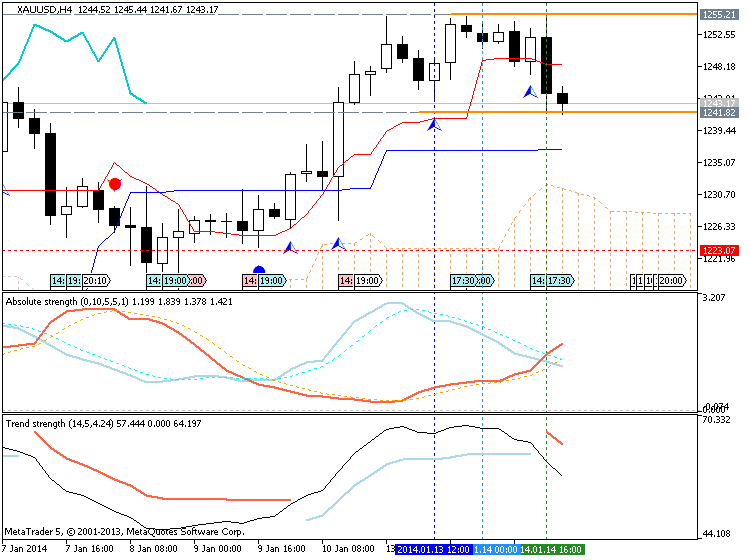
1248.86 was broken, and next resistance is 1255.01 (see image below). The price came in very close to Ichimoku cloud's line (Sinkou Span A) which is vistual border between primary bearish and primary bullish on the chart. If 1255.01 will be broken from below to above so it means - reversal - price will be fully reversed from bearish to bullish on D1 timeframe.
I told about 1248.86 level during the weekend :
If
the price will cross 1248.86 resistance so the rally may be started
(good to open buy trade). If not so we will have the ranging market
condition with flat within primary bearish
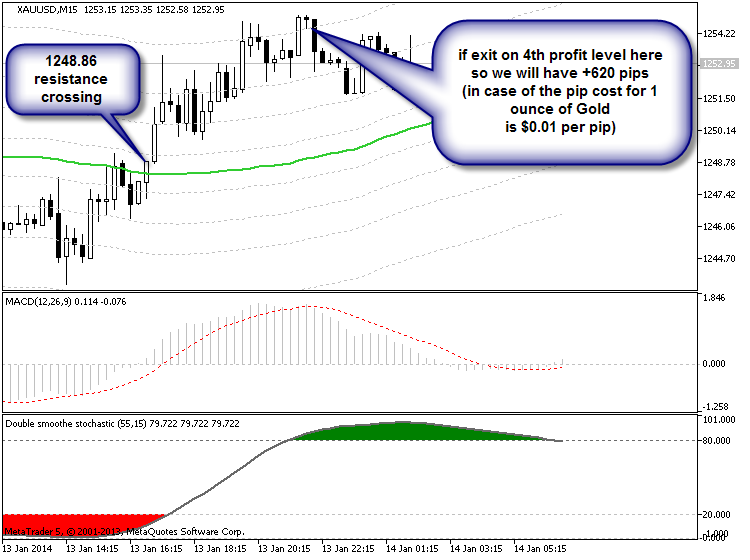
So, if the traders place buy stop pending order at 1248.86 so they should have 620 pips in profit for now (on the image : SMA with the period 55 with the levels 80/-80, 210/-210, 340/-340, 550/-550) :
- www.mql5.com
Forum on trading, automated trading systems and testing trading strategies
newdigital, 2014.01.14 20:48
Gold ends under $1,250 on stronger equities, US fears
Spot gold dropped 0.7 percent to $1,244 an ounce, while U.S. gold futures for February delivery settled $5.70 lower at $1,245.40 an ounce.
The dollar
steadied against a basket of six major currencies, rebounding from its
lowest level since Jan. 2 hit after the U.S. jobs report on Friday,
while U.S. Treasury yields steadied at 2.8 percent.
As gold pays no interest, returns on U.S. bonds are closely watched by the market.
| Name | Price | Change | %Change | Volume | ||
|---|---|---|---|---|---|---|
| GOLD |
Gold (Feb'14) | 1242.00 | -9.10 | -0.73% | 127668 | |
| GOLD/USD |
Gold / US Dollar Spot | 1242.0601 | -11.00 | -0.88% | --- | |
| SILV/USD |
Silver / US Dollar Spot | 20.14 | -0.21 | -1.03% | --- | |
| SILVER |
Silver (Mar'14) | 20.185 | -0.20 | -0.98% | 42660 | |
| PALL/USD |
Palladium / US Dollar Spot | 732.90 | -4.10 | -0.56% | --- | |
| PLAT/USD |
Platinum / US Dollar Spot | 1423.25 | -16.74 | -1.16% | --- |
Gold's steadiness was also helped by lower global equities.
"The support that we are seeing for gold is coming from the weak U.S. payrolls number last week, and (for that reason) we have seen some weakness in the dollar and equities,'' Deutsche Bank analyst Michael Lewis said.
"But we are not expecting any durable rally in gold from here,'' he added. "We just had a pocket of data that helped the metal a little bit, but our view for this year is one where we are going to see QE tapering gathering speed, an improvement in the U.S. labor market and a strengthening dollar.''
Forum on trading, automated trading systems and testing trading strategies
newdigital, 2014.01.15 06:53
GOLD Elliott Wave Analysis: Looking Towards $1260
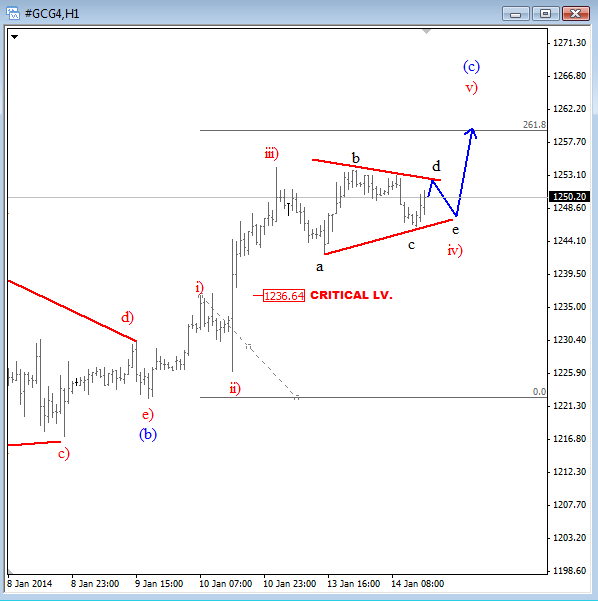
The US stocks opened slightly higher today which also has a positive impact on some commodity markets. We can see metals and crude oil moving slightly higher for the last hour or so. On Gold I slightly adjusted the wave count but the massage is actually unchanged. We see metal in intraday bullish mode heading up to 1260. Current sideways price action looks like a triangle in wave iv) of (c), so we expect a new leg up as long as 1236 holds.
Forum on trading, automated trading systems and testing trading strategies
newdigital, 2014.01.16 11:22
Gold Ends Weaker On Strong Rally in U.S. Dollar Index
Technically, February gold futures closed near mid-range and saw more corrective selling pressure. The gold market bears have the overall technical advantage. The gold bulls’ next upside near-term price breakout objective is to produce a close above solid technical resistance at the December high of $1,267.50. Bears' next near-term downside breakout price objective is closing prices below solid technical support at last week’s low of $1,212.60. First resistance is seen at Wednesday’s high of $1,244.60 and then at this week’s high of $1,255.30. First support is seen at Wednesday’s low of $1,233.50 and then at $1,225.00. Wyckoff’s Market Rating: 3.0
- Free trading apps
- Over 8,000 signals for copying
- Economic news for exploring financial markets
You agree to website policy and terms of use
GOLD price came to breakout but on open D1 bar only : Chinkou Span line crossed the price on Friday and it should be confirmed on Monday by open D1 bar. If the price will cross 1248.34 resistance (D1 timeframe) so we may see market rally within rpimary bearish. And if the price will cross the border of Ichimoku cloud/kumo (Sinkou Span A line) so it will be fully reveral of the price movement from bearish to primary bullish, and we will see the ranging market condition (bullish but ranging) because the price will be inside kumo.
Exact same situation we may see on W1 timeframe but we need few more week to be sure about rally to be started (good to open sell position for example).
Intra-day situation: Chinkou Span line crossed the price on close bar so we hope that this breakout will be continuing for the next week, especially if the price will break 1248.86 resistance which may be good signal to open buy trade.
If the price will cross 1248.86 resistance so the rally may be started (good to open buy trade). If not so we will have the ranging market condition with flat within primary bearish (D1 timeframe), and the price will be floating between Sinkou Span A line (resistance) and 1214.24 support level.
UPCOMING EVENTS (high/medium impacted news events which may be affected on XAUUSD price movement for this coming week)
2014-01-14 09:30 GMT (or 10:30 MQ MT5 time) | [GBP - CPI]
2014-01-16 10:00 GMT (or 11:00 MQ MT5 time) | [EUR - CPI]
2014-01-16 13:30 GMT (or 14:30 MQ MT5 time) | [USD - CPI]
Please note : some US (and CNY) high/medium impacted news events (incl speeches) are also affected on XAUUSD price movement
SUMMARY : rally
TREND : bearish
Intraday Chart