Join our fan page
- Views:
- 22375
- Rating:
- Published:
- 2010.01.26 11:27
- Updated:
- 2016.11.22 07:32
-
Need a robot or indicator based on this code? Order it on Freelance Go to Freelance
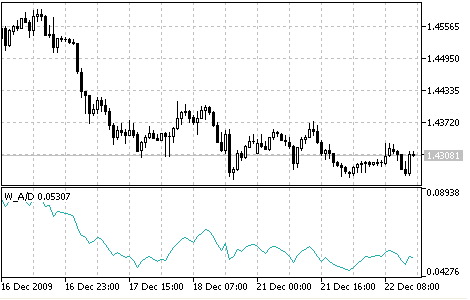
Williams' A/D is the accumulated sum of positive "accumulational" and negative "distributional" price movements.
For example, if the current closing price is higher than the previous one, W/AD increases by the difference between the current closing price and the true minimum. If the current closing price is lower than the previous one, W/AD decreases by the difference between the current closing price and the true maximum.
The term "accumulation" denotes a market controlled by purchasers and the term "distribution" means that sellers control the market.
Divergences between the indicator and the price are a signals. Like most indicators, W/AD leads the tool price. In other words, when a divergence appears, the price changes its direction according to the indicator.
- If the price reaches a new maximum, but the accumulation/distribution indicator cannot reach a new maximum, it means that the security is distributing itself. It is a signal for sell.
- If the price reaches a new minimum, but the accumulation/distribution indicator cannot reach a new minimum, it means that the security is accumulating. It is a signal for buy.

Williams'Accumulation/Distribution indicator
Calculation:
To calculate the accumulation/distribution indicator, first you have to find a "True Range High" (TRH) and "True Range Low" (TRL):
TRH (i) = MAX (HIGH (i) || CLOSE (i - 1))
TRL (i) = MIN (LOW (i) || CLOSE (i - 1))
Then you must find the current value of accumulation/distribution (CurA/D) by comparing today and yesterday's closing prices.
If the current closing price is higher than the previous one, then:
CurА/D = CLOSE (i) - ТRL (i)
If the current closing price is lower than the previous one, then:
CurА/D = CLOSE (i) - ТRH (i)
If current and previous closing prices coincide then:
CurА/D = 0
Williams' accumulation/distribution indicator is a growing sum of these values for each day:
WА/D (i) = CurА/D + WА/D (i - 1)
where:
- TRH (i) - the True Range High;
- TRL (i) - the True Range Low;
- MIN - the minimum value;
- MAX - the maximum value;
- || - the logical OR;
- LOW (i) - the minimum price of the current bar;
- HIGH (i) - the maximum price of the current bar;
- CLOSE (i) - the closing price of the current bar;
- CLOSE (i - 1) - the closing price of the previous bar;
- CurА/D - means current value of accumulation/distribution;
- WА/D (i) - the current value of William's Accumulation/Distribution indicator;
- WА/D (i - 1) - the value of William's Accumulation/Distribution indicator on the previous bar.
Translated from Russian by MetaQuotes Ltd.
Original code: https://www.mql5.com/ru/code/54
 Volume Rate of Change (VROC)
The Volume Rate of Change (VROC) is an indicator of the direction where the volume trend moves.
 Volumes
The Volumes indicator shows volumes with different colors depending on the volume changes.
 Williams’ Percent Range (%R)
The Williams’ Percent Range Indicator (%R) is dynamic technical indicator, which determines whether the market is overbought/oversold.
 ZigZag
The Zigzag indicator is a series of sections connecting significant tops and bottoms at the price plot.