Join our fan page
- Views:
- 26934
- Rating:
- Published:
- 2010.01.26 11:26
- Updated:
- 2016.11.22 07:32
-
Need a robot or indicator based on this code? Order it on Freelance Go to Freelance
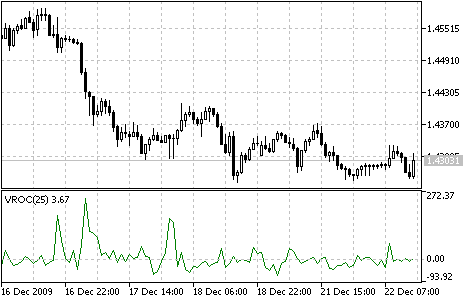
Volume Rate of Change (VROC) is an indicator of the direction where the volume trend moves.
Its idea lies in the fact that almost all important graphical formations (peaks, bottoms, breaches, etc.) are accompanied by a dramatic increase of trade volume.
The indicator is the difference between current bar volume and the volume n periods ago. If the current bar volume is higher than it was n periods ago, the value of the indicator will be positive. If the current volume is lower, VROC will obtain a negative value. Thus, the indicator gives an idea of the volume change speed.
Determining the calculation period is very important while working with this indicator. Short periods of 10-15 bars show sudden changes of volume. However, for signals that are more realistic it is better to choose periods of 25-30 bars. This gives a smoother and more rounded line and makes the analysis easier. At the same time, using short periods gives a more broken, "noisy" line and complicates the analysis.

Volume Rate of Change indicator
Calculation:
VROC = ((VOLUME (i) - VOLUME (i - n)) / VOLUME (i - n)) * 100
where:
- VOLUME (i) - is the current bar volume;
- VOLUME (i - n) - the volume n bars ago;
- VROC - the Volume Rate of Change indicator value.
Translated from Russian by MetaQuotes Ltd.
Original code: https://www.mql5.com/ru/code/53
 Volumes
The Volumes indicator shows volumes with different colors depending on the volume changes.
 Ultimate Oscillator
The Ultimate Oscillator was developed by Larry Williams. It uses the averaging of three oscillators with different periods.
 Williams'Accumulation/Distribution (W_A/D)
The Williams' A/D indicator is the accumulated sum of positive "accumulational" and negative "distributional" price movements. Divergences between the indicator and the price are a signals.
 Williams’ Percent Range (%R)
The Williams’ Percent Range Indicator (%R) is dynamic technical indicator, which determines whether the market is overbought/oversold.