Join our fan page
- Published by:
- Nikolay Kositsin
- Views:
- 12620
- Rating:
- Published:
- 2011.10.06 16:58
- Updated:
- 2016.11.22 07:32
-
Need a robot or indicator based on this code? Order it on Freelance Go to Freelance
Real author:
Rosh
Spearman's Rank Correlation is a non-parametrical method used for
statistical analysis of the correlation.
Practical calculation of the Spearman's Rank Correlation ratio includes the following steps:
- An index number (a rank) must be assigned to each of the parameters in ascending (or descending) order;
- The differences of each pair ranks of the compared values must be determined;
- Each difference must be squared and the gained results must be summed up;
- The ranks correlation ratio must be calculated as follows:
![]()
where ![]() is a sum of the ranks difference and
is a sum of the ranks difference and  is a number of paired observations.
When using the rank correlation ratio, the tightness of the correlation between the parameters is conventionally evaluated. The ratio values equal to 0.3 or lower are deemed to show weak correlation tightness, the values more than 0.4 but less than 0.7 show moderate
correlation tightness and the values equal to 0.7 or higher indicate high correlation tightness.
The power of the Spearman's Rank Correlation is a bit lower than the power of the correlation parametrical ratio. It is reasonable to use the rank correlation ratio in case there is a small amount of observation results.
This method can be used not only for quantitative data but also when registered values are determined by descriptive features of different intensity. The description is taken from here.
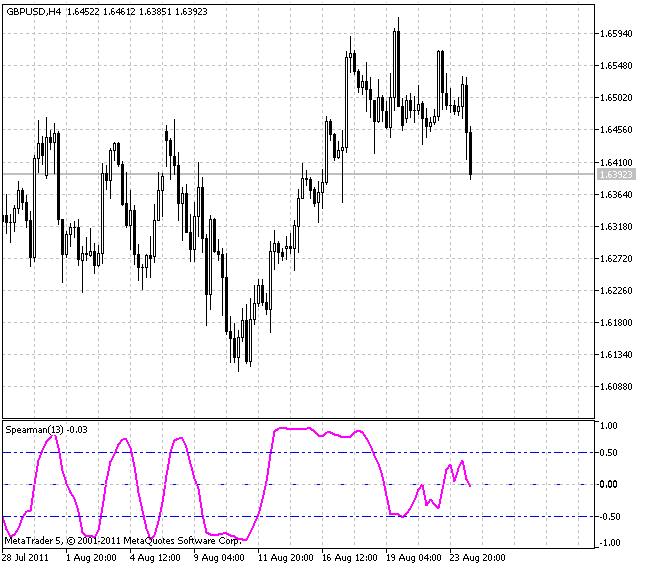
This indicator is a type of an oscillator but it is more smooth unlike Stochastic, while not lagging at the reverse points.
The only external parameter affecting the calculation algorithm is rangeN setting the number of bars, for which we are looking for regularity. If rangeN = 14, we use the close prices sequence Close[i], Close[i+1], ... Close[i+rangeN-1] and create a sequence of ranks for them, i.e. the place each close price is located at, in case this sequence is sorted. In this case we have one real chart compared with a steadily increasing one.
The direction parameter means sorting in descending (true) or ascending (false) order. The value of the true parameter shows more traditional picture, while false shows a mirror image.
The CalculatedBars parameter is implemented to limit the number of the bars the calculation is performed for and to save CPU resources (though it may not be so important). Zero value means the calculation refers to the whole available history. The Maxrange parameter that is equal to 30 sets the maximum calculation period. This parameter is also implemented to save resources and it can be useful for some traders.

Spearman's Rank Correlation indicator
Translated from Russian by MetaQuotes Ltd.
Original code: https://www.mql5.com/ru/code/460
 ZigZag
The variant of the ZigZag indicator optimized by its operation rate.
 Chaikin Volatility Index With a Smoothing Algorithm Selection
Chaikin Volatility Index determines volatility on the basis of the range width between minimum and maximum. The presented variant of this popular indicator allows to select the smoothing algorithm out of ten possible variants.
 Chaikin Oscillator
Chaikin Oscillator with a smoothing algorithm selection.
 AT_CF
AT_CF
Four digital filters that form the basis of the V. Kravchuk's AT&CF method in one separate window.