Join our fan page
- Published by:
- Nikolay Kositsin
- Views:
- 11455
- Rating:
- Published:
- 2011.10.06 17:26
- Updated:
- 2023.03.29 13:43
-
Need a robot or indicator based on this code? Order it on Freelance Go to Freelance
Real author:
Vladimir Kravchuk
"New Adaptive Method of Following the Tendency and Market Cycles"
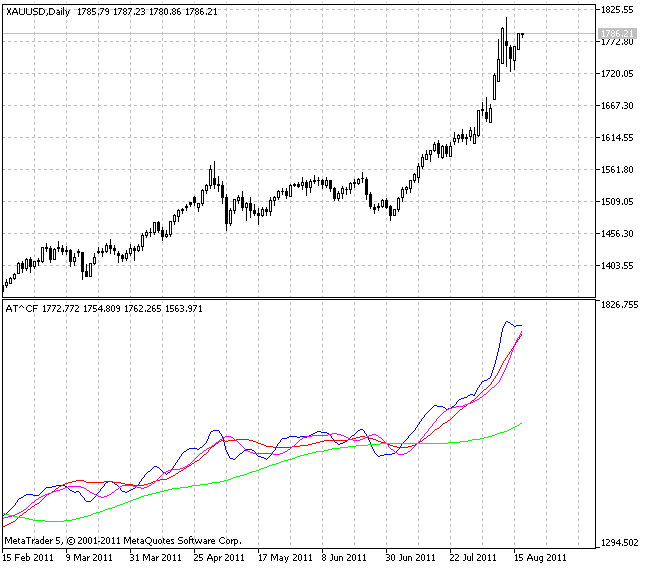
This indicator presents all four digital filters (FATL, SATL, RFTL and RSTL) that form the basis of the V. Kravchuk's AT&CF method in one separate window.
The main objective of the AT&CF method is creation of the minimum number of technical tools possessing set properties. There must be enough of this tools to build a trading algorithm that would provide maximum possible profitability, while possessing the least possible risk level, for some definite market.
Basic rules of the interpretation of the tools specified above:
- Rising SATL line indicates the bullish market trend. SATL local minimum point is a point of the beginning of the bearish trend reverse. The point, at which STLM changed from negative to positive, indicates the end of the bearish trend reverse.
- Falling SATL line indicates the bearish market trend. SATL local maximum point is a point of the beginning of the bullish trend reverse. The point, at which STLM changed from positive to negative, indicates the end of the bullish trend reverse.
- SATL form that is close to the horizontal one indicates the neutral position.
STLM interpretation requires special attention. Positive STLM value indicates the bullish trend and negative one indicates the bearish trend. STLM is a leading indicator. STLM local minimum always goes before SATL local minimum. STLM local maximum always goes before SATL local maximum.
Reaching of its extreme points by STLM is necessary but not sufficient condition of SATL curve reaching a top or a bottom. Rising STLM in case of the rising SATL indicates bullish trend acceleration. Horizontal and positive STLM in case of the rising SATL indicates steady bullish trend. The more is the STLM absolute value, the stronger is the bullish trend. Falling STLM in case of the falling SATL indicates bearish trend acceleration.
- Horizontal and negative STLM in case of the rising SATL indicates steady bearish trend. The more is the STLM absolute value, the stronger is the bearish trend.
- Rising "fast" FATL trend line in case of the rising "slow" SATL trend line indicates a strong bullish market trend.
- Falling "fast" FATL line in case of the falling "slow" SATL line indicates a strong bearish market trend.
- Rising FATL line in case of the SATL falling line indicates either bullish correction during a bearish trend, or consolidation.
- Falling FATL line in case of the rising SATL line indicates either bearish correction during a bullish trend, or consolidation.
In case FATL and SATL lines start or resume moving in one direction, it indicates either a trend reverse, or end of correction and continuation of the price movement towards SATL.

Translated from Russian by MetaQuotes Ltd.
Original code: https://www.mql5.com/ru/code/456
 Chaikin Oscillator
Chaikin Oscillator with a smoothing algorithm selection.
 Spearman's Rank Correlation
Spearman's Rank Correlation is a non-parametrical method used for statistical analysis of the correlation.
 X2MA
X2MA
The universal moving average with double smoothing and possibility to select each of this smoothings from the dozen of possible variants.
 Camarilla Equation
The system of Camarilla Equation levels for the current bar.