Join our fan page
- Views:
- 15797
- Rating:
- Published:
- 2010.01.26 11:14
- Updated:
- 2016.11.22 07:32
-
Need a robot or indicator based on this code? Order it on Freelance Go to Freelance
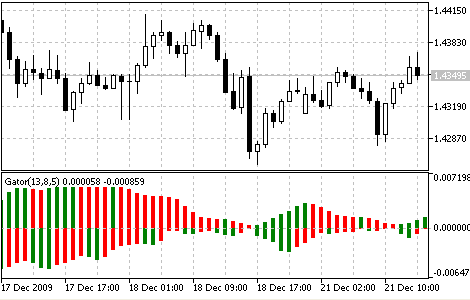
Gator Oscillator is based on the Alligator and shows the degree of convergence/divergence of the Balance Lines (Smoothed Moving Average).
The top bar chart is the absolute difference between the values of the blue and the red lines. The bottom bar chart is the absolute difference between the values of the red line and the green line, but with the minus sign, as the bar chart is drawn top-down.

Gator Oscillator
Calculation:
MEDIAN PRICE = (HIGH + LOW) / 2
ALLIGATORS JAW = SMMA (MEDIAN PRICE, 13, 8)
ALLIGATORS TEETH = SMMA (MEDIAN PRICE, 8, 5)
ALLIGATORS LIPS = SMMA (MEDIAN PRICE, 5, 3)
where:
- MEDIAN PRICE - median price;
- HIGH - the highest price of the bar;
- LOW - the lowest price of the bar;
- SMMA (A, B, C) - Smoothed Moving Average. Parameter A - smoothed data, B - smoothing period, C - shift to future. For example, SMMA (MEDIAN PRICE, 5, 3) means that the smoothed moving average is taken from the median price, while the smoothing period is equal to 5 bars, and the shift is equal to 3 bars;
- ALLIGATORS JAW - Alligator's jaws (blue line);
- ALLIGATORS TEETH - Alligator's teeth (red line);
- ALLIGATORS LIPS - Alligator's lips (green line).
Remark
We have included 2 codes of the indicator: Gator.mq5 with the direct calculation of Gator using the Moving Averages (iMA), the second code, which presented in Gator_2.mq5 uses the iAlligator for calculations.
Translated from Russian by MetaQuotes Ltd.
Original code: https://www.mql5.com/ru/code/31
 Fractals
The Fractal is one of 5 indicators of Bill Williams’ trading system, which allows to detect the bottom or the top.
 Force Index (FRC)
The Force Index Indicator was developed by Alexander Elder. This index measures the Bulls Power at each increase, and the Bears Power at each decrease.
 Heiken-Ashi
The Heiken-Ashi indicator is looks like the candlestick chart, but it has some difference.The advantage of the Heiken-Ashi charts is a simple trend determination, the upward trend candles are blue,the downward trend candles are red.
 Ichimoku Kinko Hyo
The Indicator Ichimoku Kinko Hyo is predefined to characterize the market Trend, Support and Resistance Levels, and to generate signals of buying and selling.