Join our fan page
- Views:
- 15511
- Rating:
- Published:
- 2010.01.26 11:12
- Updated:
- 2016.11.22 07:32
-
Need a robot or indicator based on this code? Order it on Freelance Go to Freelance
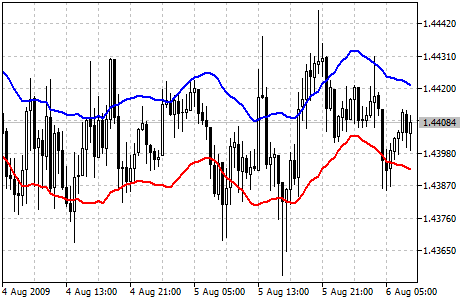
Envelopes technical indicator is formed with two Moving Averages, one of which is shifted upward and another one is shifted downward. The selection of optimum relative number of band margins shifting is determined with the market volatility: the higher the latter is, the stronger the shift is.
Envelopes define the upper and the lower margins of the price range. Signal to sell appears when the price reaches the upper margin of the band; signal to buy appears when the price reaches the lower margin.
The logic behind envelopes is that overzealous buyers and sellers push the price to the extremes (i.e., the upper and lower bands), at which point the prices often stabilize by moving to more realistic levels. This is similar to the interpretation of Bollinger Bands ® (BB).

Envelopes indicator
Calculation:
UPPER BAND = SMA (CLOSE, N) * [1 + K / 1000]
LOWER BAND = SMA (CLOSE, N) * [1 - K / 1000]
where:
- UPPER BAND - upper line of the indicator;
- LOWER BAND - lower line of the indicator;
- SMA - Simple Moving Average;
- CLOSE - close price;
- N - period of averaging;
- K / 1000 - the value of shifting from the average (measured in basis points).
Translated from Russian by MetaQuotes Ltd.
Original code: https://www.mql5.com/ru/code/28
 Detrended Price Oscillator (DPO)
The Detrended Price Oscillator eliminates the trend effect of price movement. This simplifies the process of finding out cycles and overbought/oversold levels.
 DeMarker (DeM)
The Demarker Indicator (DeM) is based on the comparison of the period maximum with the previous period maximum. When the indicator falls below 30, the bullish price reversal should be expected. When the indicator rises above 70, the bearish price reversal should be expected.
 Force Index (FRC)
The Force Index Indicator was developed by Alexander Elder. This index measures the Bulls Power at each increase, and the Bears Power at each decrease.
 Fractals
The Fractal is one of 5 indicators of Bill Williams’ trading system, which allows to detect the bottom or the top.