Join our fan page
- Views:
- 5629
- Rating:
- Published:
- 2014.04.18 16:19
- Updated:
- 2016.11.22 07:32
-
Need a robot or indicator based on this code? Order it on Freelance Go to Freelance
Real author:
Kim Igor V. aka KimIV
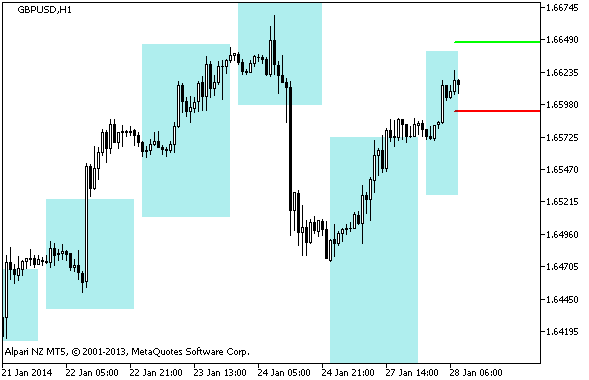
The indicator predicts daily price ranges and draws them as filled rectangles.
This indicator shows the current day support and resistance levels forecast on the bases of the previous day price levels. The formula for calculating the levels are described in Thomas Demark's The New Science of Technical Analysis.
Originally this indicator has been written in MQL4 and was first published in the Code Base at mql4.com on 24.09.2007.

Figure 1. Indicator i-DRProjections
Translated from Russian by MetaQuotes Ltd.
Original code: https://www.mql5.com/ru/code/2218
 BackgroundCandle_ColorStepXCCX_HTF
The indicator draws candlesticks of a larger timeframe as color filled rectangles. Rectangles are color filled in accordance with the values of the ColorStepXCCX indicator.
 i-DayOfWeek
The indicator uses colored rectangles to paint the price range of the weekday selected in the indicator settings.
 i-sig
i-sig
A semaphore signal indicator that analyzes the last five bars.
 Exp_ColorJJRSX
This trading system uses the ColorJJRSX oscillator.