Technical Pattern Analysis for US Dollar, S&P 500, GOLD and CRUDE OIL

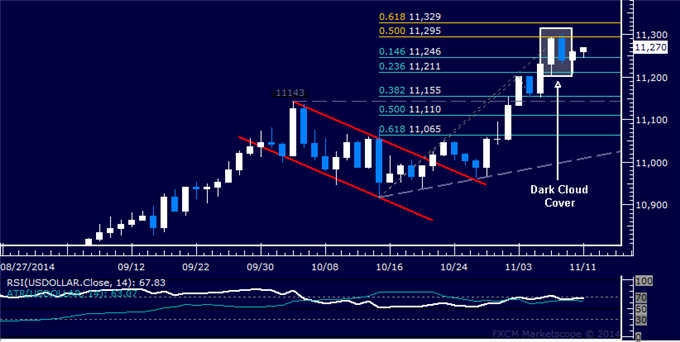
US DOLLAR TECHNICAL ANALYSIS
Prices may be gearing up for a
turn lower after prices produced a bearish Dark Cloud Cover candlestick
pattern. Near-term support is at 11246, the 14.6% Fibonacci retracement,
with a break below that on a daily closing basis exposing the 23.6%
level at 11211.
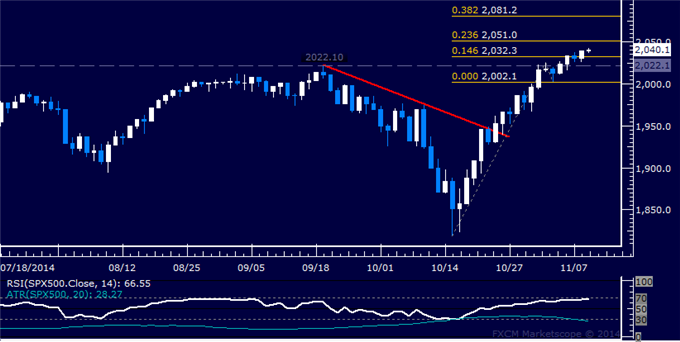
S&P 500 TECHNICAL ANALYSIS
Prices pushed to another record
higher, with buyers now aiming to challenge resistance marked by the
23.6% Fibonacci expansion at 2051.00. A break above this barrier on a
daily closing basis exposes the 38.2% level at 2081.20.
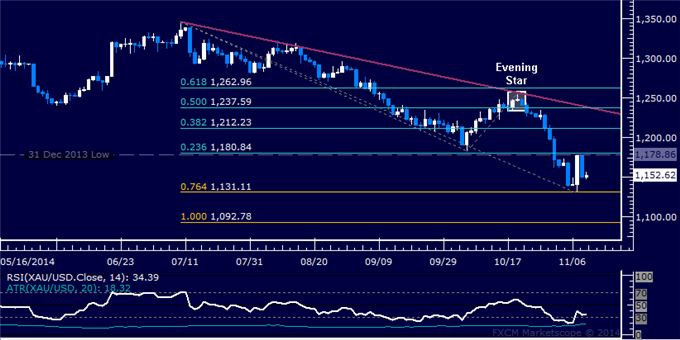
GOLD TECHNICAL ANALYSIS
Prices turned lower anew after testing
resistance in the 1178.86-80.84 area marked by the December 2013 low and
the 23.6% Fibonacci retracement. Near-term support is at 1131.11, the
76.4% Fibonacci expansion.
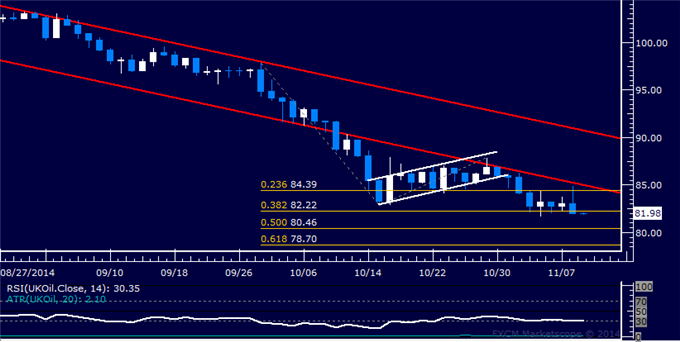
CRUDE OIL TECHNICAL ANALYSIS
Prices edged below the 38.2%
Fibonacci expansion at 82.22, exposing the 50% level at 80.46. A further
move beneath that targets the 61.8% Fib at 78.70.