
How To Trade - Fibonacci Price Retracements - “Where is the current retracement of a prior price swing likely to find support or resistance?”

Many traders use Fibonacci Retracements to determine possible points of Support or Resistance. Fibonacci Retracements answer the question, “Where is the current retracement of a prior price swing likely to find support or resistance?”
To begin using Fibonacci Retracements, it is necessary to define the current trend:
How to Draw a Fibonacci Retracement:
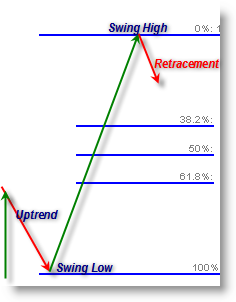
1. Identify a Trend (we will assume an up-trend)
2. Find the recent swing high in price where price is now showing downward movement
3. Find the most recent swing low
4. Start at the perceived Swing High and draw a Fibonacci Grid (retracement tool) down to the Swing Low
In a strong uptrend, price should find support and ‘inflect’ off the 38.2% retracement of the swing, but if not, it would be expected to find support at the 50.0% (one-half) retracement. A deeper retracement would take price to the 61.8% retracement, but if price does not find support and reverse off any of these levels, it would generally be a good idea to take your stop-loss and prepare for the possibility of a market reversal.
Download Fibonacci Retracement indicator for free from this link.
The other good indicator made by famous Codersguru is attached to this post.


