

- Equal Waves pattern is a simple three wave pattern
- Compare the alternating waves of the pattern to determine if they are equal in length
- Equal Waves patterns can provide clues about the larger Elliott Wave structure
Many traders ask how to begin labeling their chart using Elliott Wave Theory. Try starting with the Equal Waves pattern. The video above describes what the pattern is, how to measure it, and what you can anticipate once the pattern is identified.
The Equal Waves pattern is a three wave structure. Therefore, it can also indicate what the larger degree Elliott Wave pattern in development.
For example, depending on where it shapes, the pattern could be the A or B leg of a flat correction, one of the legs of a triangle, an entire zig zag correction, one leg of a complex correction, or one of legs of a diagonal motive wave.For those who understand Elliott Wave theory, a simple A-B-C move where wave A equals the length of wave C may look familiar to you. A pattern where wave A equals the length of wave C implies it is a corrective move and the whole pattern is likely to be retraced. In the example above regarding the GBPJPY, prices eventually broke to new highs. So if a trader correctly bought in the support zone with a wide enough stop loss to absorb the market’s natural breathing, the potential for upside on the trade would have been a new swing high, nearly 400 pips away.
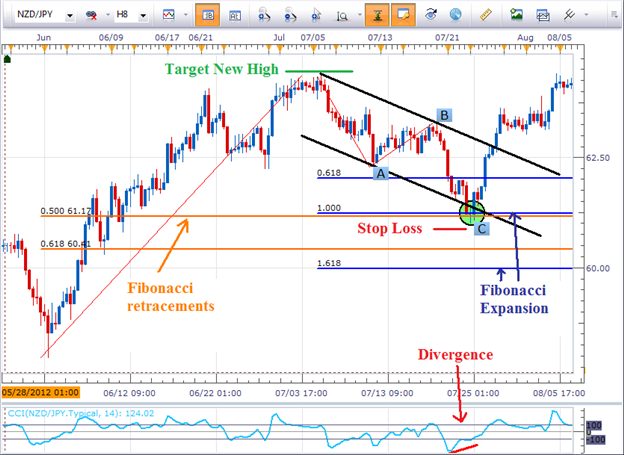
Since this is an equal wave pattern, you’ll want to place your stop loss just below the swing low and target at a minimum a new swing high. In this case it would be risking about 75 pips for the potential reward of 300. It is not uncommon for this pattern to produce at least a 1-to-2 risk-to-reward ratio.


