Смотри обучающее видео по маркету на YouTube
Как купить торгового робота или индикатор
Запусти робота на
виртуальном хостинге
виртуальном хостинге
Протестируй индикатор/робота перед покупкой
Хочешь зарабатывать в Маркете?
Как подать продукт, чтобы его покупали
Технические индикаторы для MetaTrader 4 - 10
Этот индикатор нарисует вам следующие уровни:
Дневная открытая линия: внизу – медвежий рынок, вверху – бычий. Средний дневной диапазон: максимум и минимум Азиатский рынок: взлеты и падения Вчерашний максимум и минимум Эти уровни являются сильными уровнями поддержки и сопротивления, на которые каждый должен обратить внимание.
Если вы не использовали время, чтобы начать! Вам нужно обратить внимание, когда цена приближается к этим уровням!
Наслаждайтесь торговлей, которая стала проще!
FREE
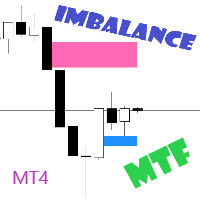
Imbalance / FVG MTF Mark Imbalance on chart of Selected Multi Time frames. Trend is Manually set to filter signals in the chosen direction by a button on the chart. .
Futures Auto Mark Imbalance / FVG on chart on selected time frames
Select time frames by buttons on chart
Popup Alert, Push Notification or email when New Imbalance Form
Popup Alert, Push Notification or email when Imbalance is Taken out
Select Alert Mode to be a single or multiple Imbalance ( OR / AND option ) when Imbalan

Contact me after payment to send you the User-Manual PDF File.
Double Top/Bottom Pattern
Double top and bottom patterns are chart patterns that occur when the underlying investment moves in a similar pattern to the letter "W" (double bottom) or "M" (double top). Double top and bottom analysis are used in technical analysis to explain movements in a security or other investment, and can be used as part of a trading strategy to exploit recurring patterns. Searching for this pattern among the c

Description: The indicator predicts, with a specific probability, if the actual candlestick range will expand or contract compared to the range of a previous candle. Furthermore, the indicator shows the possible high or low of the actual candle, based on trend direction. (Recommended for Daily, Weekly, or Monthly timeframes).
KEY LINKS: Indicator Manual – How to Install – Frequent Questions - All Products How to use the indicator: Determines, with a certain probability, if there will

** All Symbols x All Time frames scan just by pressing scanner button ** *** Contact me after the purchase to send you instructions and add you in "Order Block group" for sharing or seeing experiences with other users. Introduction: The central banks and financial institutions mainly drive the market, Order block is considered a market behavior that indicates accumulation of orders from banks and institutions, then the market tends to make a sharp move(Imbalance) on either side once the order bl

Description: The indicator measures, through the zigzag indicator, the levels of trend or correction. It shows in the chart the levels of each low or high detected. KEY LINKS: How to Install – Frequent Questions - All Products How is this indicator useful? This indicator determines, depending on Zigzag parameter if a trend is beginning, developing, or ending This indicator determines the direction of the trend Components Levels as positive or negative numbers, depending on the direction
FREE

Как создать автоматизированного торгового робота с помощью Rule Plotter Вы когда-нибудь задумывались, насколько было бы мощно, если бы вы могли автоматизировать свои торговые стратегии всего лишь несколькими кликами мыши? Представьте себе свободу создавать и тестировать различные торговые стратегии без необходимости погружаться в сложные коды. С Rule Plotter эта задумка становится реальностью. Здесь мы рассмотрим, как вы можете создать своего собственного торгового робота, используя Rule Plotter
FREE
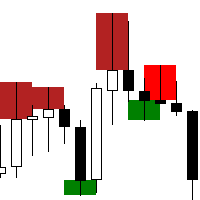
The "Rejection Block" MetaTrader 4 Indicator is a powerful tool designed to assist traders in identifying and visualizing rejection candlestick patterns, commonly referred to as rejection blocks. These patterns play a crucial role in market analysis as they often signify potential reversals or continuations in price movements. Key Features: Rejection Block Detection: The indicator meticulously scans price data to identify instances of rejection candlestick patterns. These patterns typically feat
FREE

Представляем индикатор ON Trade Numerology Mirror: Раскрываем паттерны разворота с помощью нумерологии Откройте новое измерение в техническом анализе с индикатором ON Trade Numerology Mirror. Этот инновационный инструмент использует древнюю мудрость нумерологии для выявления ключевых уровней разворота цены на ваших графиках. Путем перестановки чисел в зеркальном порядке этот индикатор раскрывает скрытые паттерны, которые могут сигнализировать о значительных разворотах цен, предоставляя уникальн

Apollo Pips - это высокоточный индикатор разворота тренда для торговли на любой валютной паре. Изначально разрабатывался для торговли XAUUSD, но практика показала, что индикатор можно успешно использовать и на других парах. Рекомендуемый тайм фрейм H1. Индикатор делает оповещение только, когда сигнал подтвержден. Поэтому, если вы увидели оповещение, то можете смело пользоваться полученным сигналом. Индикатор НЕ ПЕРЕРИСОВЫВАЕТ свои сигналы! Стрелка может моргать пока сигнал не подтвержден. Когда
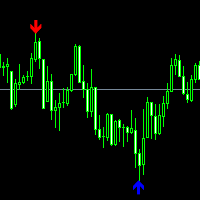
AMS Scalper Отличный индикатор для точки входа в рынок, сигналы индикатора используем только по тренду.
Настройки: Range - 50 ( размер диапазона для поиска сигнала.) Maximum candles Back - 3 (через сколько свечей ставить сигнал) P.S для появление сигнала на нулевой свече - ставим 0.
В качестве индикатора тренда, рекомендуем использовать - Trend Arrow Super
Остались вопросы? нужна помощь?, я всегда рад помочь, пишите мне в личные сообщения или В телеграмм

Dashboard uses Ichimoku Strategy to find best trades. Get extra Indicators/Template: And read more about detailed Product Description and usage here: https://www.mql5.com/en/blogs/post/747457
Please note: I won’t be able to add new settings. It already has 72 settings Some people are using it with their EAs. And iCustom function can only take Max 64 settings. So, I cannot let it grow any further.
I’ll definitely be maintaining the code and solving issues. Don’t worry Please check all

Dark Inversion is an Indicator for intraday trading. This Indicator is based on Counter Trend strategy but use also Volatility. We can enter in good price with this Indicator, in order to follow the inversions on the current instrument. Hey, I made an Expert Advisor based on this indicator, if you are interested: Dark Titan
Key benefits
Easily visible Inversion Lines Intuitive directional arrows Automated adjustment for each timeframe and instrument Easy to use even for beginners Never rep
FREE

TrendExpert Indicator Overview
The TrendExpert indicator is designed to identify and visualize trend zones in financial markets. It utilizes zigzag high and low points to determine support and resistance levels, providing insights into potential market reversals and continuation patterns.
Features - Detection of support and resistance zones based on price action. - Strength categorization (Proven, Verified, Untested, Turncoat, Weak) based on historical testing. - Adjustable parameters fo
FREE

Necessary for traders: tools and indicators Waves automatically calculate indicators, channel trend trading Perfect trend-wave automatic calculation channel calculation , MT4 Perfect trend-wave automatic calculation channel calculation , MT5 Local Trading copying Easy And Fast Copy , MT4 Easy And Fast Copy , MT5 Local Trading copying For DEMO Easy And Fast Copy , MT4 DEMO Easy And Fast Copy , MT5 DEMO Расширенные полосы Боллинджера:
1. Рельс Боллинджера изменит цвет в зависимости от направлен
FREE
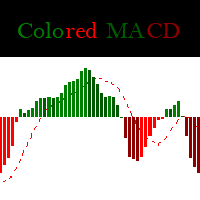
The Normale MACD have 2 Corlors ( 1 for MACD Histogram and 1 for the Signal Line )
This version of Macd have 5 Colors ( 4 for MACD Histogram and 1 for the Signal Line ) : - When the MACD get a Positive higher value - When the MACD get a Positive Lower value - When the MACD get a Negative higher value - When the MACD get a Negative Lower value
This version have the same input like the normal one : * Fast EMA Period * Slow EMA Period * Signal SMA Period * Applied Price
FREE

Trade History for MT4 This indicator is specially developed for that traders want to display his trades on the charts. Shows history and current deals on the chart. Trades show on the chart with a dotted line, and profit will show realtime. Buy trades are displayed in bull color, Sell trades in bear color.
Tip: The historical order displayed by the indicator is associated with the "Account History", so please set the historical order display in the "Account History" of MT software.
If yo
FREE
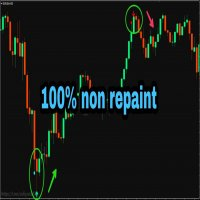
PLEASE NOTE You can customize the settings of K_period value, the oversold and the overbought value is customizable. You can change it as per your requirement. The accuracy will change as per your settings.
100% Non repaint indicator
Pre-alert (get ready) signals
Non-delay indications
24/7 signals
100% No lag
No recalculating The arrows wont repaint even if the signal fails, or you refresh or restart the mt4 Indicator is based on simple crossover strategy of main line and signal line
FREE

MT5 Version SMT Divergences MT4
SMT Divergences is one of the most innovative indicators in the market. It offers the possibility of analyzing price divergences between 2 pairs. These divergences highlight and help to foresee what banks and institutions are planning to do. SMT divergences also provides you with a kill zones indicator and the possibility of filtering divergences occurring during these kill zones. The strategy tester is limited in MT4. Contact the author to get your Demo Version

Получите сигнал о следующем разворотном движении | Оптимизируйте статистику коэффициента усиления | Получить зоны, которые цена будет тестировать | Индикатор без перерисовки и задержек - идеально подходит для ручной и автоматической торговли - подходит для всех активов и всех временных единиц Ограниченное предложение >> 50% OFF После покупки пожалуйста, свяжитесь с моим каналом для получения рекомендуемых настроек Версия МТ5 | Получите наш полный метод с TrendDECODER и Po

FALCON ZONES , OPORTUNIDADES EN EL MERCADO PARA COMPORAR O VENDER
Características Destacadas: Identificación de Patrones de Velas: Reconoce una amplia gama de patrones de velas, desde patrones simples hasta formaciones más complejas. Proporciona una visión completa de la psicología del mercado encapsulada en las velas. Alertas Personalizadas: Configura alertas a medida para los patrones de velas que más te interesan o que se alinean con tu estrategia. Recibe notificaciones instantáneas cuando
FREE

Moving Average Trend Alert is a triple MA indicator that helps traders to identify potential market trends based on 3 MAs alignment and crossover.
Moving Average Trend Alert features: Customizable short-term, medium-term, and long-term MAs. Option to filter signals based on a minimum distance between moving averages to avoid premature MAs alignment. Optional Filter of signals with RSI indicator overbought/oversold levels. Optional Filter of signals with ADX indicator. Popup, email, and phone n
FREE

Gann Signal - очень простой на первый взгляд индикатор, но внутри скрыт многолетний опыт изучения методов W.D.Ganna. Индикатор дает точные BUY/SELL сигналы, без перерисовки. Индикатор очень прост в применении. Вам нужно лишь прикрепить его на график и следовать его рекомендациям. Индикатор постоянно ведет анализ рынка на предмет возможностей для входа. Когда такая возможность появляется, индикатор дает сигнал в виде стрелки. Повторяюсь, все сигналы НЕ ПЕРЕРИСОВЫВАЮТСЯ! Индикатор предназначен для

Just another Auto Fibonacci Retracement indicator . However, this is the most Flexible & Reliable one you can find for FREE. If you use this indicator and you like it, please leave a review/comment. If you are looking for a more advanced Fibo indicator, check this Free Trend-Based Fibo indicator .
### FEATURES ### Auto-calculate up to 7 Fibonacci levels on your customized frame. Adjust levels as your need. Use High/Low price or Open/Close price to calculate. Freeze the levels and don't re
FREE

Are you looking for Price Levels and Price Channels and Price VWAP and Volume On Balance Indicators ? Now you have all in one !!! With Alarm and Push Notification. Info on your chart is showing you: where current price is and all levels, channels and vwap, how big is current On Balance Volume, is it going Bearish or Bullish, and who has the power, Buyers or Sellers. Up and down arrows showing you growing Seller or Buyer Volume. Lines showing you all Levels and Channels. Search f
FREE
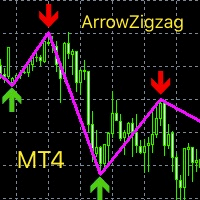
This index is based on the secondary development of zigzag, adding high and low point arrow indication, thickening the line and changing the color. Can be a good display of the current admission trading signals, current long or short. It can be combined with other indicators to determine the trading point, which has great reference value. Compared with the general trend index or oscillation batch standard, the accurate determination is higher from the perspective of historical data research and
FREE
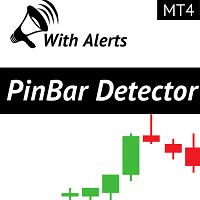
Детектор пин-баров — это индикатор, который находит на графике паттерн ценового действия пин-баров. Пин-бары — это сокращение от «Пиноккио-бары», которые представляют собой классическую альтернативу японским свечам с высокими верхними или нижними тенями и очень маленькими телами, такими как Dragon Fly Doji, Grave Stone Doji, Hammer, Inverted-Hammer, Hanging Man и Shooting Star. .
ПРЕДЛОЖЕНИЕ ОГРАНИЧЕННОЕ ПО ВРЕМЕНИ: Индикатор доступен всего за 50 $ и пожизненно. ( Первоначальная цена 125$ )
FREE

This scanner is monitoring the entire market for Ichimoku trade opportunities for all symbols and for all time frames. You don't have to look to all the charts, for all symbols and for all time frames. This scanner will alert you on your computer, or on your mobile, when a trade opportunity has been found. You never have to miss a trade opportunity! This indicator is designed to scan all pairs and symbols, for all selected time frames, to find a Tenkan and Kijun Cross or a breakout of the Ich

MACD divergence indicator finds divergences between price chart and MACD indicator and informs you with alerts (popup, mobile notification or email). Its main use is to find trend reversals in the chart. Always use the divergence indicators with other technical assets like support resistance zones, candlestick patterns and price action to have a higher possibility to find trend reversals. Three confirmation type for MACD divergences: MACD line cross zero level Price returns to previous H/L Creat
FREE
Like most things that work in trading, it's really simple. However, it's one of the most powerful tools I have that makes entries of many systems much more precise.
In its essence, it measures the recent volatility against the medium-term average. How does it work? Markets tend to be prone to strong trending movements when relative volatility is low and tend to be mean-reverting when relative volatility is high.
It can be used with both mean-reversion systems (like the Golden Pickaxe) an
FREE

Market Profile 3 MetaTrader 4 indicator — is a classic Market Profile implementation that can show the price density over time, outlining the most important price levels, value area, and control value of a given trading session. This indicator can be attached to timeframes between M1 and D1 and will show the Market Profile for daily, weekly, monthly, or even intraday sessions. Lower timeframes offer higher precision. Higher timeframes are recommended for better visibility. It is also possible t
FREE

Dark Sprint is an Indicator for intraday trading. This Indicator is based on Trend Following strategy, also adopting the use of the atr to determine the right volatility. We can enter in good price with this Indicator, in order to follow the strong impulse on the current instrument.
Key benefits
Easily visible sprint lines Intuitive directional arrows Automated adjustment for each timeframe and instrument Easy to use even for beginners Never repaints, never backpaints, Not Lag 100% compati

Ichimoku Trend Alert is the Ichimoku Kinko Hyo indicator with Alerts and signal filters.
Ichimoku Trend Alert features: Optional check of Ichimoku cloud, Tenkan sen(Conversion Line), Kijun sen(Base Line), Senkou span A, Senkou span B, and Chikou span relative to price, and more. Popup, email, and phone notification alerts for selected symbols and timeframes.
There are 9 classic Ichimoku trend filters you can enable/disable in settings: Price/Cloud Order: Checks the price position relative to
FREE

[75% OFF! - SALE ENDS SOON] - RevCan Trend Entry Point is a trend based trade alert indicator for serious traders. It does all the price and chart analysis all by itself, and whenever it finds any potential high quality trading opportunity(Buy or Sell) using its revolutionized price prediction algorithms, it sends instant trade alert directly on the chart, MT4 terminal and on the mobile device. The trade signals will be visible on the chart as Up and Down arrows, while the instant audible aler

**Introducing Supply Demand Zones Indicator for MT4**
Hello, esteemed traders in the financial markets! Today, we are pleased to introduce to you a powerful tool called the "Supply Demand Zones Indicator" - a valuable utility designed for the MetaTrader 4 (MT4) platform, aimed at helping you identify key supply and demand areas on your trading charts.
**Brief Introduction:** The Supply Demand Zones Indicator is a unique technical analysis tool that assists in pinpointing significant price l
FREE

Индикатор показывает паттерны Де Марка и дает торговые сигналы в виде стрелок и оповещений. Показывает линии Де Марка на истории котировок. Обладает мультифреймом., может показывать паттерны Де Марка старших таймфреймов на более низких таймфреймах. Имеет отключаемую функцию отображения фракталов. Торговые сигналы сопровождаются звуковым оповещением , а так же рассылкой на почту и мобильные устройства.
Developed to assist in binary options retracement operations, this indicator will show the assets with the best retracement percentages!
How it works: The indicator will calculate the total length of each candle from low to high, the total of the body and total of shadows (up and down) and calculate a total shadows percentage of various configurable assets. The counter is updated with each new candle.
ATENTION: Demo on the estrategy tester is not functional to show multiple assets.

Weddell Pro хороший торговый инструмент который подойдет как для новичка так и для опытного трейдера. С ним можно работать как отдельно так и совмещать с другими стратегиями и индикаторами Настроен для валютных пар несколько раз тестировался на криптовалюте но высокого результата не показал Валютные пары USD/EUR AUD/CAD GBP/USD Очень хорошо себя тут показал Процент правильных сделок выше 68% что не делает его идеальным и плохим Не рисует и не пропадает Красная стрелка показывает сделку на низ С
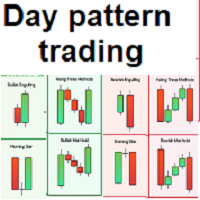
Simple and effective indicator based on some candle patterns recognition Arrows appear on candles when bear signal / bull signal based on candle pattern recognition -----> TWO strategies available you can enable / disable one of them Indicator can work on any chart and time frame I prefer to work on high time frames especially the Daily charts D1 and H4 Red arrows appears above candle showing a bear signal after candle completed - arrow will be blue during candle formation Green arrows appears b

Индикатор I Special ZigZag отмечает на графике максимумы и минимумы 3-х порядков, а именно краткосрочные , среднесрочные и долгосрочные и соединяет их линией подобно ZigZag без перерисовки. Идея построения индикатора взята из книги Ларри Вильямса "Долгосрочные секреты краткосрочной торговли" и адаптирована под современный рынок. В настройках индикатора можно задать нужную толщину и цвет для каждого вида экстремума для удобства восприятия на графике цены. С помощью данного индикатора легче понять

MACD is probably one of the most popular technical indicators out there. When the market is trending, it actually does a pretty good job, but when the market starts consolidating and moving sideways, the MACD performs not so well. SX Impulse MACD for MT5 is available here . Impulse MACD is a modified version of MACD that works very well for trading Forex, stocks, and cryptocurrencies. It has its own unique feature which perfectly filters out the values in a moving average range and enables it t

Auto Fibonacci Button The Fibonacci retracement is a popular and reliable technical analysis tool for traders to determine support and resistance areas. It employs the "Golden Ratio," a mathematical pattern seen throughout nature and even the universe, to forecast particular levels of support level and resistance level. This tool is generated in technical analysis by dividing the vertical distance between two extreme points on the chart (typically a peak and a low) by the important Fibonacci
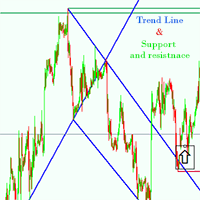
Support and resistance Strategy is one of the most widely used concepts in forex trading.
Strangely enough, everyone seems to have their own idea on how you should measure forex support and resistance. no more wasting time This Indicator is made to do it automatically for you, Features of support and resitance indicator * Automatically detection of the trend line and support & resistance * Works on any pair any time frame any time * Works on offline Chart Inputs : TrendLinePeriod=900 CycleSi

The indicator shows buy and sell signals. The " CounterTrend 4 " is designed to recognize profitable counter trend patterns from your chart. Features: The CounterTrend 4 is a Counter-Trend Trading with Simple Range Exhaustion System. Signals based on the daily trading range. The indicator calculates the trading range for the last few days and compare the price movements on short time intervals and generating short term reversal points. This is a leading indicator. It works on any instruments.

The GGP Williams Vix Fix MT4 Indicator is based on the volatility of the market and grants a huge support for finding out when a correction is coming to end. This indicator is MT5 conversion of the CM_Williams_Vix_Fix Finds Market Bottoms Indicator by “ChrisMoody “ in Trading View website and some alert methods are added to provide real-time alerts when a trading signal is generated, in order to allow traders to act quickly and efficiently. For MT5 version please click here . Larry Williams

Индикатор визуализирует результат работы скрипта CalculateScientificTradePeriod (который, конечно, также нужно скачать), который, во-первых , оценивает в течении скольких Mx баров активного графика будет наиболее вероятно продолжаться будущий тренд и каково его качество, и, во-вторых , вычисляет тот оптимальный период усреднения (что также равен Mx ) индикатора ScientificTrade , который дает максимальную прибыль по крайне эффективной стратегии ScientificTrade . Для работы
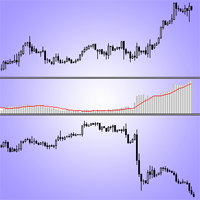
Индикатор корреляции торговых инструментов. Показывает разницу значений цен двух инструментов. Рост расхождения цен и уменьшение расхождения цен можно рассматривать как сигналы к сделкам. Индикатор можно использовать для хедж-стратегий. Индикатор подаёт сигналы Alert и Push-уведомления на мобильное приложение о пересечении скользящих средних Envelopes. У индикатора простые настройки. Нужно поместить его в окно торгуемого инструмента и выбрать параметры: Correlated_Symbol - выбор торгового инстру
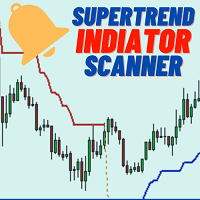
Welcome to the world of advanced trading with the Supertrend Indicator Scanner! Maximize your trading experience with our powerful MT4 indicator designed for seamless analysis and real-time insights. Key Features: Effortless Supertrend Scanning: Unlock the full potential of the Supertrend Indicator Scanner by effortlessly scanning multiple currency pairs. Receive instant alerts when specific Supertrend conditions are met, ensuring you stay ahead of market movements. Comprehensive Dashboard Insi

Daily supply and demand levels for breakouts or reversals. Use on 1 Hour charts No nonsense, for the confident trader who trades price action supply and demand levels with daily projections without the fluff using 1 Hour charts. MT5 Version: https://www.mql5.com/en/market/product/108522 The Bank Trader Indicator is a sophisticated tool employed by institutional traders, particularly those in banking institutions, to navigate the complex world of forex markets. Rooted in the principles of daily

Contact me for instruction, any questions! Introduction Triangle chart patterns are used in technical analysis , which is a trading strategy that involves charts and patterns that help traders identify trends in the market to make predictions about future performance.
Triangle Pattern Scanner Indicator It is usually difficult for a trader to recognize classic patterns on a chart, as well as searching for dozens of charts and time frames will take time, and there is also a possibility of a

Contact me after payment to send you the user manual PDF file. Introduction The moving average indicator is the most well-known and one of the most popular indicators among traders. It is very simple to work with, but a basic question has always become a big challenge among traders: What is the most optimal setting of the moving average for each chart-time frame? The answer to this question is very difficult, you have to try different settings of the moving average indicator for different chart
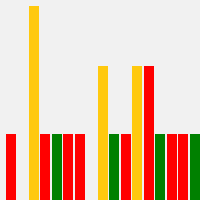
I'm excited to introduce you to the fifth bar on Martin Armstrong's Forecast Array - The Trading Cycle .
This innovative tool represents a transverse form of cyclical frequency analysis, offering a unique perspective on market trends.
The model employs a color-coded system for easy interpretation. In this model, green signals the ideal timing for highs, red indicates ideal lows, and yellow signifies a convergence of highs and lows occurring simultaneously. This intuitive approach allows

Если вы торгуете с использованием свечных фигур и хотите усовершенствовать свои методы современными технологиями, этот индикатор для вас. Фактически он является частью набора инструментов, который основывается на нейросетевом движке самоорганизующихся карт (Self-Organizing Map, SOM) для распознавания и предсказания свечных фигур, а также для исследования входных данных и результатов работы сети. Набор содержит: SOMFX1Builder - скрипт для обучения нейронных сетей; он создает файл с обобщенными д

This indicator is based on the Weis wave principle of wave volume. Below are few features of the indicator It draws the wave on the chart while the accumulated volume per wave in a different window at the bottom of the chart You can configure the turning point move It displays the accumulated volume (in thousands, eg for 15000 volume it will show 15) at the end of each wave You can also configure to show number of candles in the wave along with the wave volume The indicator calculates the distin
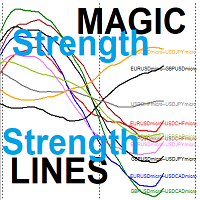
the MAGIC Smooth Strength lines for Currencies couples Each line represents the relative strength of two couples out of 5 user input symbols -> 10 indicator lines Your Strategy is based on selecting the weaker strength line and wait for a reversal sign OR Your Strategy is based on selecting the stronger strength line and wait for a reversal sign When reversal occurs you will trade on the two symbols represented by this line like the strength relative line for EURUSD and USDCAD when it is th

This indcator shows the trend with the color histogram. It is simple and easy to use. Usage: If the histogram changes from the aqua to the fuchsia, which means the trend is up. If the histogram changes from the fuchsia to the aqua,which means the trend is down. Inputs: MaPeriods: the periods of moving average. f1: the multiplier of inner bands f2: the multiplier of outer bands Popup Window Alert Email Alert Mobile Push Alert Alerts When the trend changes from the long trend to the short trend or
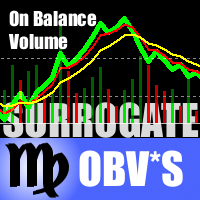
Это специальная версия индикатора On-Balance Volume (OBV), построенная на псевдо-реальных объемах, эмулируемых из тиковых объемов. Индикатор рассчитывает приближенную оценку реальных объемов для инструментов Форекс (для которых реальные объемы недоступны) и затем по стандартной формуле строит OBV. Для расчета объемов используется тот же алгоритм, что и в индикаторе TrueVolumeSurrogate . Сам индикатор не требуется, но может применяться для проверки.
Параметры MAfast - период быстрой скользящей

Extreme Value Sniper is a detrended price indicator Indicator finds the potential reversal levels by checking value ranges and price cycles. ***Indicator does NOT repaint so it provides accurate NO REPAINT REVERSAL SIGNALS***
MT5 Version of the product : https://www.mql5.com/en/market/product/114550
It shows the overbought and oversold levels using the average range. Overbought Levels are between 4 and 10 Oversold levels are bewtween -4 and -10
Those levels can be used as a reversal l
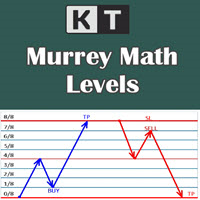
It shows the Murrey Math levels on chart and also provides an alert when price touch a particular level. T. Henning Murrey, in 1995, presented a trading system called Murrey Math Trading System, which is based on the observations made by W.D Gann.
Applications
For Murrey Math lovers, this is a must-have indicator in their arsenal. There is no need to be present on the screen all the time. Whenever the price touches a level, it will send an alert. Spot upcoming reversals in advance by specula

''A professional trader is a greedy trader: he buys at lows and sells at highs with minimal risks and high returns,,
Pips Slayer is developed exactly for such trading approach . It's a universal indicator for tracking reversals and uses price action patterns, discrepancy of custom indicators and a multi-layered formula for identifying reversal structures. The indicator is very easy to use; it only shows arrows where is recommended to buy or sell and recommended take-profit and stop-loss pric
FREE
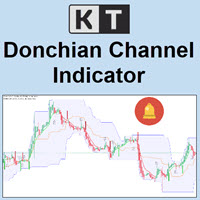
KT Donchian Channel is an advanced version of the famous Donchian channel first developed by Richard Donchian. It consists of three bands based on the moving average of last high and low prices. Upper Band: Highest price over last n period. Lower Band: Lowest price over last n period. Middle Band: The average of upper and lower band (Upper Band + Lower Band) / 2. Where n is 20 or a custom period value is chosen by the trader.
Features
A straightforward implementation of the Donchian channel

Индикатор сканирует до 30 торговых инструментов и до 8 таймфреймов на наличие высоковероятностных моделей паттерна Двойная вершина/дно с ложными прорывами . Концепция индикатора Ultimate Double Top/Bottom и профессиональный способ его применения подробно описаны в блоге (на английском языке): Professional Trading With Double Tops/Bottoms And Divergences! Предусмотрены алерты в терминале MetaTrader 4, по электронной почте и в виде push-уведомлений при появлении сигнала на любом настроенном таймфр
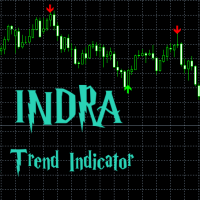
What is the INDRA Trend indicator? A INDRA Trend is a trend following indicator which give most accurate arrow signals of BUY and Sell based on the moving average , buying power and selling power in market, checking with other multiple indicators and providing the best possible time to get in to the market . This indicator is tested in multiple time frames as showed in screenshots it is also tested in multiple currency pairs , crypto and metal pairs such as USD/CAD EUR/JPY EUR/USD EUR/CHF US

Our 5 Star Best Seller Beginner or Professional our best selling multi-timeframe Pivot Prof will enhance your trading and bring you great trade opportunities with the Support and Resistance levels that professionals use. Pivot trading is a simple effective method for entering and exiting the market at key levels and has been used by professionals for decades and works on all symbols: Forex, Crypto, Stocks, Indicies etc. Pivot Prof brings premium levels to the trader where the market is most like
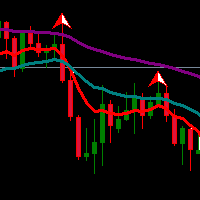
Exponential Moving Average (EMA) is an indicator that often be used by traders. Combination of two or three EMA indicators often applied to determine trend direction. Multiple EMA combined with fractals or oscillator indicator to detect overbought/oversold and divergence point also great to do in trading system.
If you like EMA indicator and want to get better indicator, highly recommended using EMA SuperTrend Strategy Indicator if you want to get better result in here:
https://www.mql5.com/
FREE

Индикатор TrueChannel показывает нам истинные каналы движения цены. Этот индикатор своим видом напоминает Donchian Channel , но построен на основе совершенно иных принципов и дает более адекватные торговые сигналы. Как показано в статье цена на самом деле движется в каналах параллельных временной оси и резко – перепрыгивает из предыдущих каналов в последующие. Установить такое движение цены позволяет индикатор Probabilities distribution of price ( PDP ). Индикатор
FREE

Если вы часто теряете сделки из-за того, что используете только один индикатор, попробуйте этот торговый инструмент. Этот торговый инструмент использует более одного индикатора. Я часто наблюдаю трейдеров, которые используют только индикатор RSI. Очень часто рынок перепродан, но все еще находится внизу, или рынок перекуплен, но все еще вверх. По этой причине вам необходимо использовать более одного индикатора. Представляем новую версию V 3.40 MTF PPAAF: фильтрация точной цены и действия на неск

Detect strength for uptrends and downtrends by tracking Buy Power and Sell Power. Stay on the right side of the market by being able to determine whether the market is in a bull or bear trend and how strong the trend is.
Free download for a limited time! We hope you enjoy, with our very best wishes during this pandemic!
Trend Trigger Factor aims to ride out sideways movement, while positioning the trader in the correct side of the market to capture big trends when they occur. It was orig
FREE

Keltner Channel is a well known indicator that not in MT4's indicators default lineup (You can get this from your broker somehow). This indicator helps you to define trend and sometimes overbought/oversold prices during flat trend. Input Description: EMAperiod: Moving Average period used for indicator. Must be higher than 1. ATRperiod: Average True Range period used for indicator. Must be higher than 1. multiplier: Multiplier used for determine channel's wide. Must be higher than 0 but may not b
FREE

BreakHarmony Multi-Timeframe Breakout Indicator for MT4
The BreakHarmony Multi-Timeframe Breakout Indicator for MT4 is a highly advanced tool providing information on breakout points across different timeframes, aiding traders in decision-making and understanding market movements. [ Features and Manual | MT5 version | All Products ] The indicator tracks breakout points on price charts across 6 timeframes. Breakout prices are indicated with the closing price of the corresponding candl
MetaTrader Маркет - единственный магазин, где можно скачать демоверсию торгового робота и подвергнуть его проверке и даже оптимизации на исторических данных.
Прочитайте описание и отзывы других покупателей на заинтересовавший вас продукт, скачайте его прямо в терминал и узнайте, как протестировать торгового робота перед покупкой. Только у нас вы можете получить представление о программе, не заплатив за неё.
Вы упускаете торговые возможности:
- Бесплатные приложения для трейдинга
- 8 000+ сигналов для копирования
- Экономические новости для анализа финансовых рынков
Регистрация
Вход
Если у вас нет учетной записи, зарегистрируйтесь
Для авторизации и пользования сайтом MQL5.com необходимо разрешить использование файлов Сookie.
Пожалуйста, включите в вашем браузере данную настройку, иначе вы не сможете авторизоваться.