How to better process periods of high volatility (many ticks per second)?
So the question is how to handle that: what kinds of code or other changes in configuration that can be made in order to avoid delayed charts in these moments. For now, what I've implemented in every indicator and EA I have is a filter for new ticks, this because changes in volume are irrelevant for my trading strategies:
This code alone improved my situation a lot. Another version of the same function allows for consideration of wider ranges before accepting the tick, what also proved useful in heavy visual indicators that don't really need to count for every single tick:
Another strategy I also implemented already was that even when a new tick is formed, not necessarily the entire code of the indicator will be executed. For example, if the indicator depends on a change of high/low of bars, if those didn't change, the code stops and goes no further.
And well I was satisfied with the results until this event a couple minutes ago where all of this implemented code failed to handle a moment of high volatility. This brings my question: what other ideas are there to handle such high volatilities I'm not considering? Which other tricks could I implement to avoid delayed charts? And are there any non-code strategies as well? I already have a pretty good CPU, AMD Ryzen 7 1800X, but with MT5's system of 1 thread per chart, is there any hardware or outside code solution to give the thread more juice? Any suggestions will be appreciated!
Here are some options:
- Don't execute all your code on every tick. Separate that which only happens on a new bar and that which happens on new ticks.
- Instead of on every tick, consider reacting only on every new M1 bar if your strategy is for higher time-frames.
- You could also only react at a set interval, for example once a second or once every 5 seconds for example.
- If you have to react to ticks, then give yourself a tolerance. For example, only react when the new tick is more than x points higher or lower than the previous level (not previous tick) you have set, and then update the level. This is very useful, because if for example your entry or exit price is 100 points away from current price, then why react every tick. Just check for a change every 10-20 points from last price you checked, until it gets close to the trigger price, before you start reacting to smaller price changes.
You are on the right track to reduce execution of code that is not needed.
Use the code profiler on a slow machine to find bottlenecks in your code and optimize.
Not sure if visual is needed (human does, EA does not), remove it. Objects on charts slow your system down a lot especially if there is many.
In fact my charts are all like this:
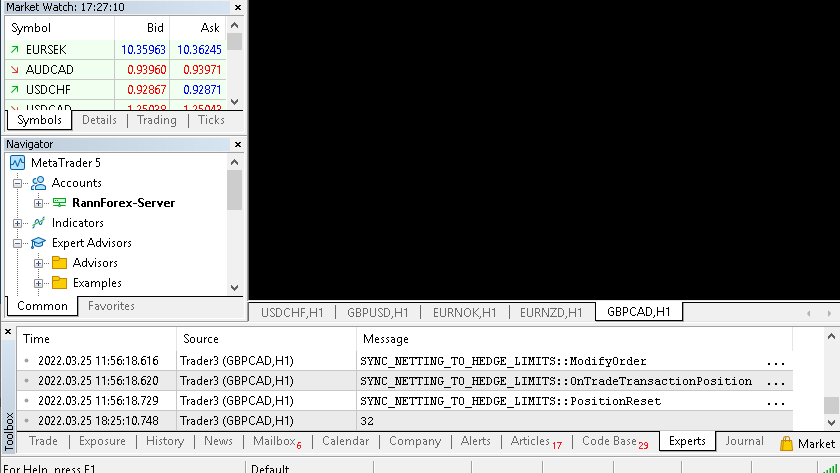
With a hot key it enables the management console iw show like this

Notice the speed. It goes up considerably when there is an activce chart.
Minimizing each chart helps to speed up. Minimizing the terminal helps to speed up.
Here are some options:
- Don't execute all your code on every tick. Separate that which only happens on a new bar and that which happens on new ticks.
- Instead of on every tick, consider reacting only on every new M1 bar if your strategy is for higher time-frames.
- You could also only react at a set interval, for example once a second or once every 5 seconds for example.
- If you have to react to ticks, then give yourself a tolerance. For example, only react when the new tick is more than x points higher or lower than the previous level (not previous tick) you have set, and then update the level. This is very useful, because if for example your entry or exit price is 100 points away from current price, then why react every tick. Just check for a change every 10-20 points from last price you checked, until it gets close to the trigger price, before you start reacting to smaller price changes.
Thanks for the tips! The first 3 I've already considered and implemented in one or two occasions, but the last one was something that really never ocurred to me. I'll study how to implement it.
Use the code profiler on a slow machine to find bottlenecks in your code and optimize.
Not sure if visual is needed (human does, EA does not), remove it. Objects on charts slow your system down a lot especially if there is many.
Notice the speed. It goes up considerably when there is an activce chart.
Minimizing each chart helps to speed up. Minimizing the terminal helps to speed up.
Thanks for the tips! I work both with robots a.w.a. with manual trades, so minimizing charts and the terminal is not always a viable option (nevertheless, it's very good to learn it does have an impact). Now of everything you posted the most interesting was not showing the graph (no bar, candles, line). I have no idea how to implement that and I coulnd't find any command on the chart to completely hide it. So could you tell us how do you do it? Are you just putting a black rectangle over the chart? And if so, doesn't it kinda plot the candles/bar/line behind the rectangle anyway?
    ChartSetInteger(0,CHART_SHOW,ChartShow);
    ChartSetInteger(0,CHART_SHOW_TRADE_LEVELS,false);
    ChartSetInteger(0,CHART_SHOW_GRID,false);
    ChartSetInteger(0,CHART_SHOW_ONE_CLICK,false);
    ChartSetInteger(0,CHART_COLOR_BID,clrNONE);
    ChartSetInteger(0,CHART_COLOR_ASK,clrNONE);
    ChartSetInteger(0,CHART_SHOW_ASK_LINE,false);
    ChartSetInteger(0,CHART_SHOW_BID_LINE,false);
    ChartSetInteger(0,CHART_MODE,CHART_LINE);
    ChartSetInteger(0,CHART_COLOR_CHART_LINE,clrNONE);
Basically remove anything from the chart that gets updated. There is no way to totally disable the chart. I don't know if clrNone items are actually drawn. Hopefully not.
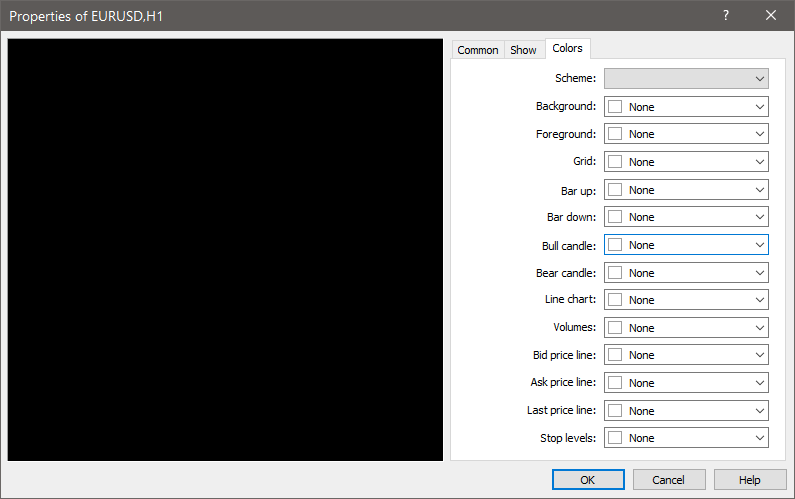
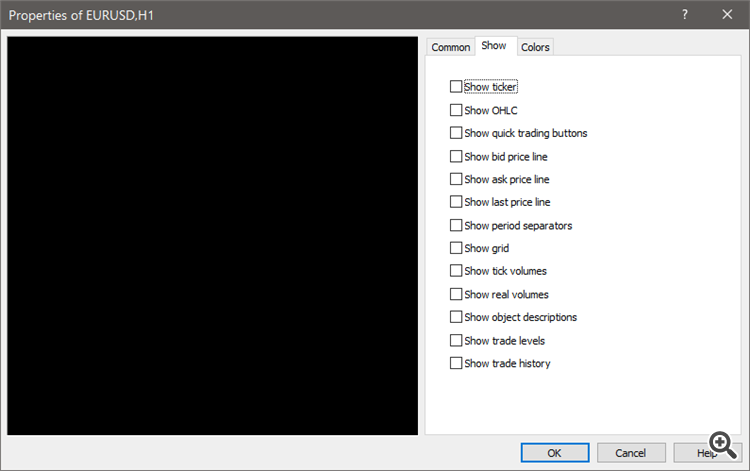
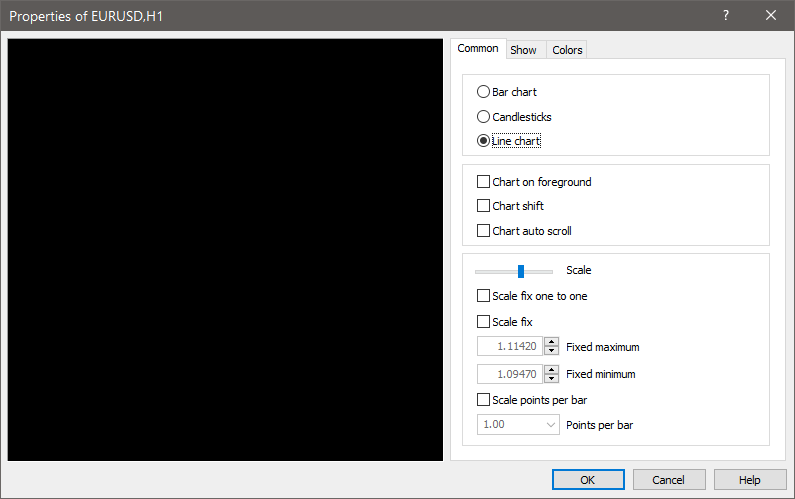
Yes, bars are still calculated, but since it is a line chart, with no scrolling, nor any extra details, like trade history, or period separators, grids, etc. and the fact that all the colours are "none", the graphical update of the chart is significantly much faster and use very little resources.
EDIT: Also, I suspect that "Scale fix one to one" if enabled may be a little faster, but I have never taken the time to test that.Thanks for the replies, Enrique and Fernando! I'll soon implement that in my EAs! :)
To contribute myself a little more with the subject, I recently created a new version of the isNewTick function:
bool isNewRelevantTick(const double lastTick)
{
   static double prevTick1 = 0.0;
   static double prevTick2 = 0.0;

   if (lastTick != prevTick1 && lastTick != prevTick2)
   {
      prevTick2 = prevTick1;
      prevTick1 = lastTick;

      return true;
   }

   return false;
}
As I was thinking back about what happen this morning, I remembered that part of the graphical delay was due to "useless ticks" that didn't really represented any new relevant price change because they where just "back-and-forth" movements, e.g.: from 10.00 to 10.01 back to 10.00 to 10.01 and back to 10.00 etc. until finally a 10.02 appeared. While some tools such many indicators might need the exact last value (e.g. a moving average based on the Close price), many other don't really need to know the exact last Close value, only actual changes in price, which also happens to be the case of many of the tools I was using this morning. So for these cases, the above function may already help a lot.
Basically remove anything from the chart that gets updated. There is no way to totally disable the chart. I don't know if clrNone items are actually drawn. Hopefully not.
Enrique, one more thing: I tested the sample code you provided and it seems there is no difference between just setting CHART_SHOW to false versus setting everything else as well; with that property alone everything else already goes dark. So do you know for a fact that setting all the other properties to false/clrNONE/etc actually improve fluidity over just CHART_SHOW=false?
- Free trading apps
- Over 8,000 signals for copying
- Economic news for exploring financial markets
You agree to website policy and terms of use
Hi!
Some time ago I faced the problem with high volatility, here defined not as synonymous with big bars or big changes in price movement over some time, but many new ticks per second. I found out that such moments where "everybody decided to trate at the same time" (which, again, is not synonymous with everybody trading in the same direction leading to a big bar) can lead to big delays in the chart update, leading to inadequate trades. Just 10 min ago I faced a stop loss and lost a profitable opportunity because of this.
So the question is how to handle that: what kinds of code or other changes in configuration that can be made in order to avoid delayed charts in these moments. For now, what I've implemented in every indicator and EA I have is a filter for new ticks, this because changes in volume are irrelevant for my trading strategies:
This code alone improved my situation a lot. Another version of the same function allows for consideration of wider ranges before accepting the tick, what also proved useful in heavy visual indicators that don't really need to count for every single tick:
Another strategy I also implemented already was that even when a new tick is formed, not necessarily the entire code of the indicator will be executed. For example, if the indicator depends on a change of high/low of bars, if those didn't change, the code stops and goes no further.
And well I was satisfied with the results until this event a couple minutes ago where all of this implemented code failed to handle a moment of high volatility. This brings my question: what other ideas are there to handle such high volatilities I'm not considering? Which other tricks could I implement to avoid delayed charts? And are there any non-code strategies as well? I already have a pretty good CPU, AMD Ryzen 7 1800X, but with MT5's system of 1 thread per chart, is there any hardware or outside code solution to give the thread more juice? Any suggestions will be appreciated!