Might you help me?
What does it mean "when you zoom in, the rectangle disappears"?
I ran your code:
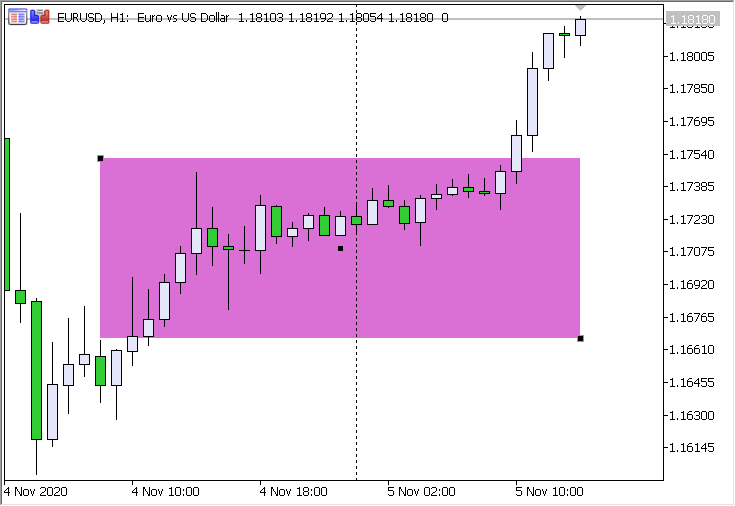
after that I zoomed in the graph:
As you can see, no one has disappeared anywhere. The rectangle remains in place.
What does it mean "when you zoom in, the rectangle disappears"?
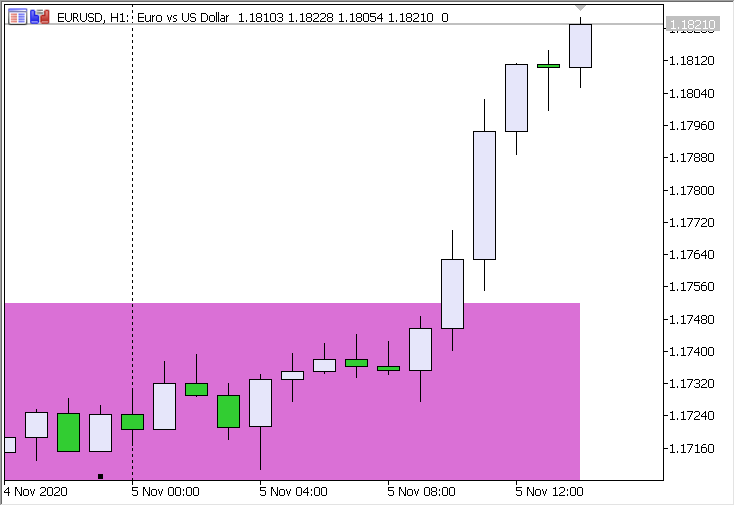
I ran your code:
after that I zoomed in the graph:
As you can see, no one has disappeared anywhere. The rectangle remains in place.
That way, how I put the code works correctly but I present the code as I tried to do it but when marking the example, locate yourself on September 30 and draw a rectangle in h1 change to m15 and zoom in and you will see how it disappears
//+------------------------------------------------------------------+
//|                                                   indicator.mq5 |
//|                        Copyright 2015, MetaQuotes Software Corp. |
//|                                             https://www.mql5.com |
//+------------------------------------------------------------------+
#property copyright "Copyright 2015, MetaQuotes Software Corp."
#property link      "https://www.mql5.com"
#property version   "1.00"
#property indicator_chart_window
#property indicator_plots 0
//--- input parametr

//+------------------------------------------------------------------+
//|                                                                  |
//+------------------------------------------------------------------+


int OnCalculate(const int rates_total,
                const int prev_calculated,
                const datetime &time[],
                const double &open[],
                const double &high[],
                const double &low[],
                const double &close[],
                const long &tick_volume[],
                const long &volume[],
                const int &spread[])
  {

   ArraySetAsSeries(time,true);
   for(int i = ObjectsTotal(0)-1; i >= 0; i--)
   ObjectSetInteger(0, ObjectName(0, i),OBJPROP_TIME,1,time[0]*2);
   return(rates_total);
  }
//+------------------------------------------------------------------+
this one just added (*2) on the line ObjectSetInteger (0, ObjectName (0, i), OBJPROP_TIME, 1, time [0] * 2); try this code and as I told you and you will see what happens when marking a date September 30 to the current day in h1 and when changing to m15 and approaching the rectangle disappears.
what I really need is that it extends from any date but not to the current time but a little more for example 2020-12-31 so it can be extended throughout the graph to the right. I appreciate if you can help me
***
That way, how I put the code works correctly but I present the code as I tried to do it but when marking the example, locate yourself on September 27 and draw a rectangle in h1 change to m15 and zoom in and you will see how it disappears***
Understood nothing. What should be placed and where? Here is a technical forum: if you want to say something - speak clearly - specify the full parameters of the rectangle (date and price of the first and second anchor points).
Then show the screenshot - what you got. Then describe what and where to switch - and show the screenshot again.
I'll leave you the code that I use now and I'll leave you a video so you can see what I mean (draw the rectangle on September 21) .. what I am looking for is that from wherever I create a rectangle it extends without getting lost when approaching, I do not know if there is a way for the rectangle to extend until 2020-12-31 when configuring a rectangle with that date and approaching it does not disappear so I look for that the rectangle obtains that extension date
//+------------------------------------------------------------------+
//|                                                   Extend Box.mq5 |
//|                        Copyright 2015, MetaQuotes Software Corp. |
//|                                             https://www.mql5.com |
//+------------------------------------------------------------------+
#property copyright "Copyright 2015, MetaQuotes Software Corp."
#property link      "https://www.mql5.com"
#property version   "1.00"
#property indicator_chart_window
#property indicator_plots 0
//--- input parametr

//+------------------------------------------------------------------+
//|                                                                  |
//+------------------------------------------------------------------+


int OnCalculate(const int rates_total,
                const int prev_calculated,
                const datetime &time[],
                const double &open[],
                const double &high[],
                const double &low[],
                const double &close[],
                const long &tick_volume[],
                const long &volume[],
                const int &spread[])
  {

   ArraySetAsSeries(time,true);
   for(int i = ObjectsTotal(0)-1; i >= 0; i--)
   ObjectSetInteger(0, ObjectName(0, i),OBJPROP_TIME,1,time[0]*2);
   return(rates_total);
  }
//+------------------------------------------------------------------+
I'll leave you the code that I use now and I'll leave you a video so you can see what I mean (draw the rectangle on September 21) .. what I am looking for is that from wherever I create a rectangle it extends without getting lost when approaching, I do not know if there is a way for the rectangle to extend until 2020-12-31 when configuring a rectangle with that date and approaching it does not disappear so I look for that the rectangle obtains that extension date
You changed your code - you started multiplying the date by 2. My question is: why? You end up with the date 2071. Perhaps your problem lies here - the date must be set reasonable.
You changed your code - you started multiplying the date by 2. My question is: why? You end up with the date 2071. Perhaps your problem lies here - the date must be set reasonable.
because I need the extension of the rectangle not to remain until the current time if not beyond that it covers the right part as it does in the video but without disappearing, that is why I would like the date not to increase so much to 2071 but a little less and so it does not disappear from the graph when approaching :(
because I need the extension of the rectangle not to remain until the current time if not beyond that it covers the right part as it does in the video but without disappearing, that is why I would like the date not to increase so much to 2071 but a little less and so it does not disappear from the graph when approaching :(
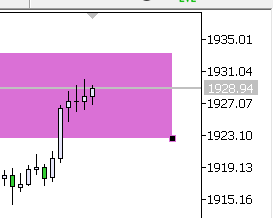
In this case, add ten bars to the time:
****
      ObjectSetInteger(0, ObjectName(0, i),OBJPROP_TIME,1,time[0]+PeriodSeconds(Period())*10);
***
Result:
In this case, add ten bars to the time:
Result:
I tried to add it as you told me but it gave me an error as I mentioned at the beginning. I am not a programmer but I copied it as is and that comes out .. I attached image .. thanks for your help
I tried to add it as you told me but it gave me an error as I mentioned at the beginning. I am not a programmer but I copied it as is and that comes out .. I attached image .. thanks for your help
No need to insert the code as a picture! The code must be inserted using the button ![]()
You have made a mistake because you did copy-paste very, very carelessly.
Copy and Paste Carefully - You are copying very, very casually.
****
      ObjectSetInteger(0, ObjectName(0, i),OBJPROP_TIME,1,time[0]+PeriodSeconds(Period())*10);
***
- Free trading apps
- Over 8,000 signals for copying
- Economic news for exploring financial markets
You agree to website policy and terms of use
Hi, I'm not a programmer and I need someone who can help me .. I have a code that helps me extend the rectangles in the graph but when extending it only remains until the current time, try another way and extend it but the date of the rectangle is very far and When zooming in on the graph, the rectangle disappears .. I need the rectangle to extend until 2020-12-31, how could I implement it to the code that I leave below .. Thank you very much who can help me