
Graphs of changes in quotes of currency pairs, stock prices, index values carry much more information than is commonly believed. Few people know that on the chart you can also see its future dynamics.
The issue of modeling the future dynamics of the value of financial assets (currencies, stocks, indices, raw materials, etc.) by plotting graphs showing possible future dynamics is a cornerstone in the field of financial investment.
You can get acquainted with the technique of reading charts and the method of modeling its future dynamics by reading the article “To know what to buy, what to sell, you need to read charts”.
Below, in chronological order, are charts with a fractal marking of the Dow Jones index, which were published earlier in this channel (the date of the fractal analysis is indicated on the chart).
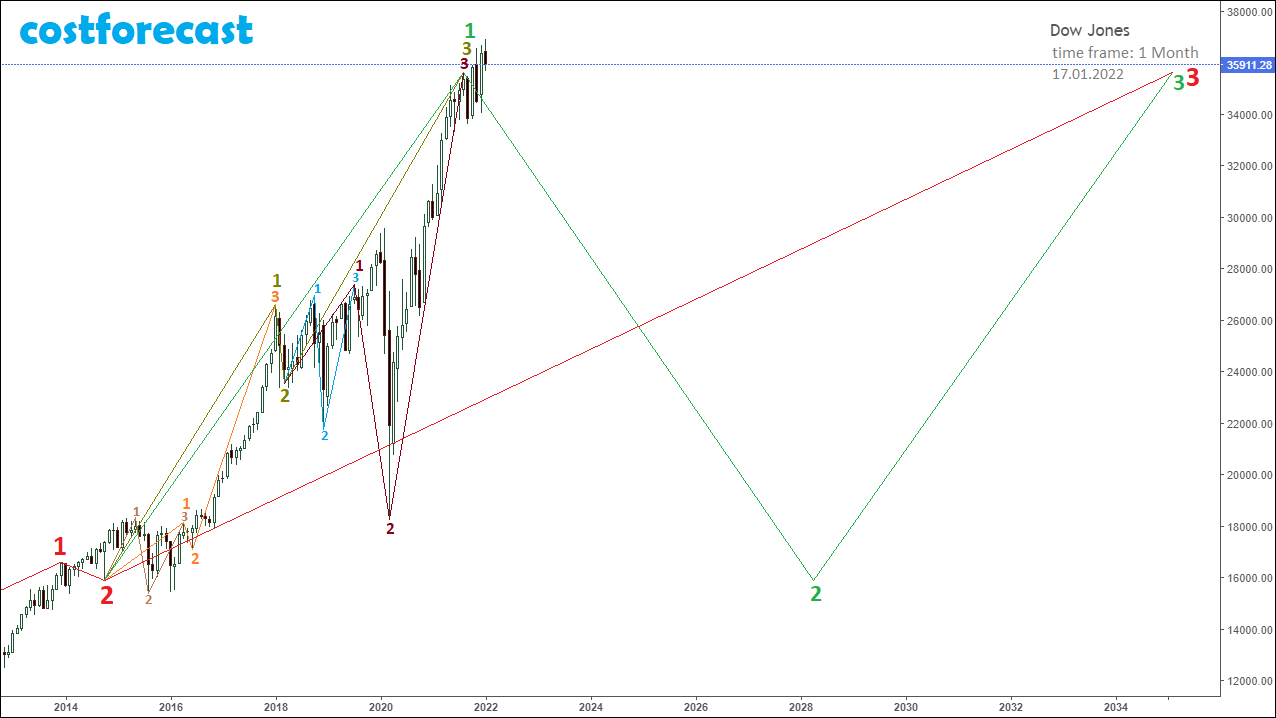
Dow Jones, fractal structure (time frame 1 month / 01/17/2022).
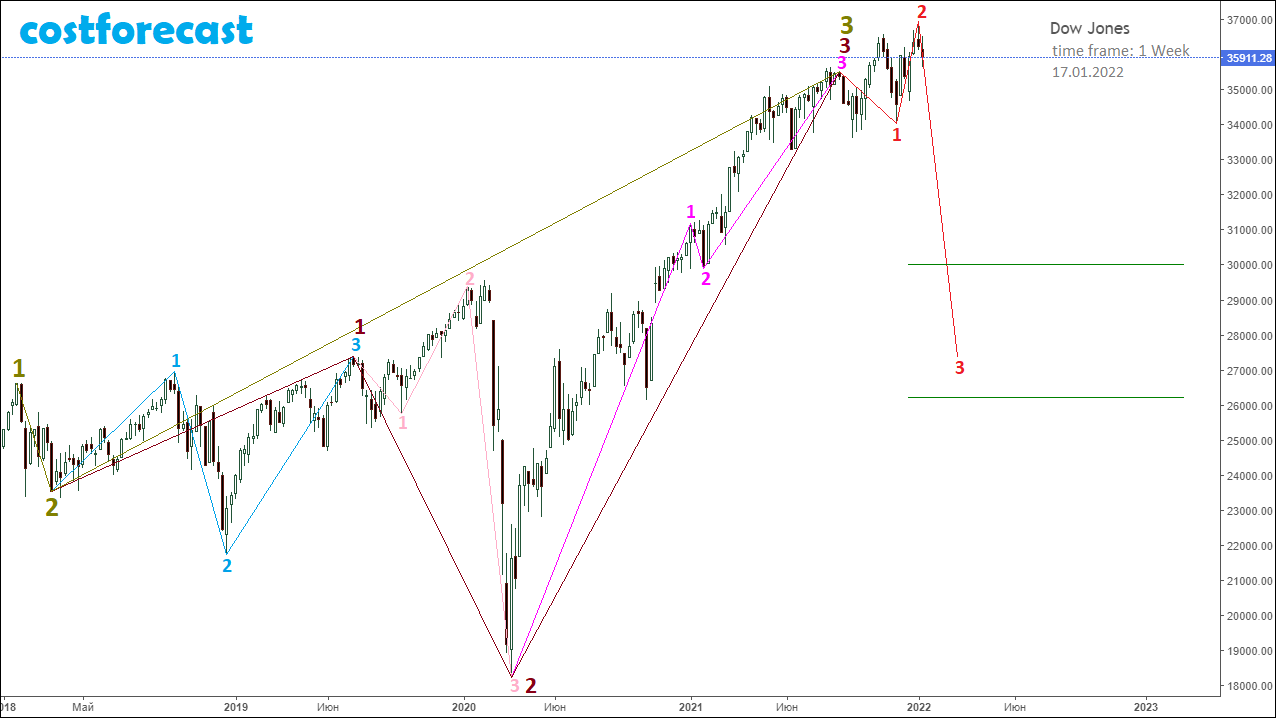
Dow Jones, fractal structure (time frame 1 week / 01/17/2022).
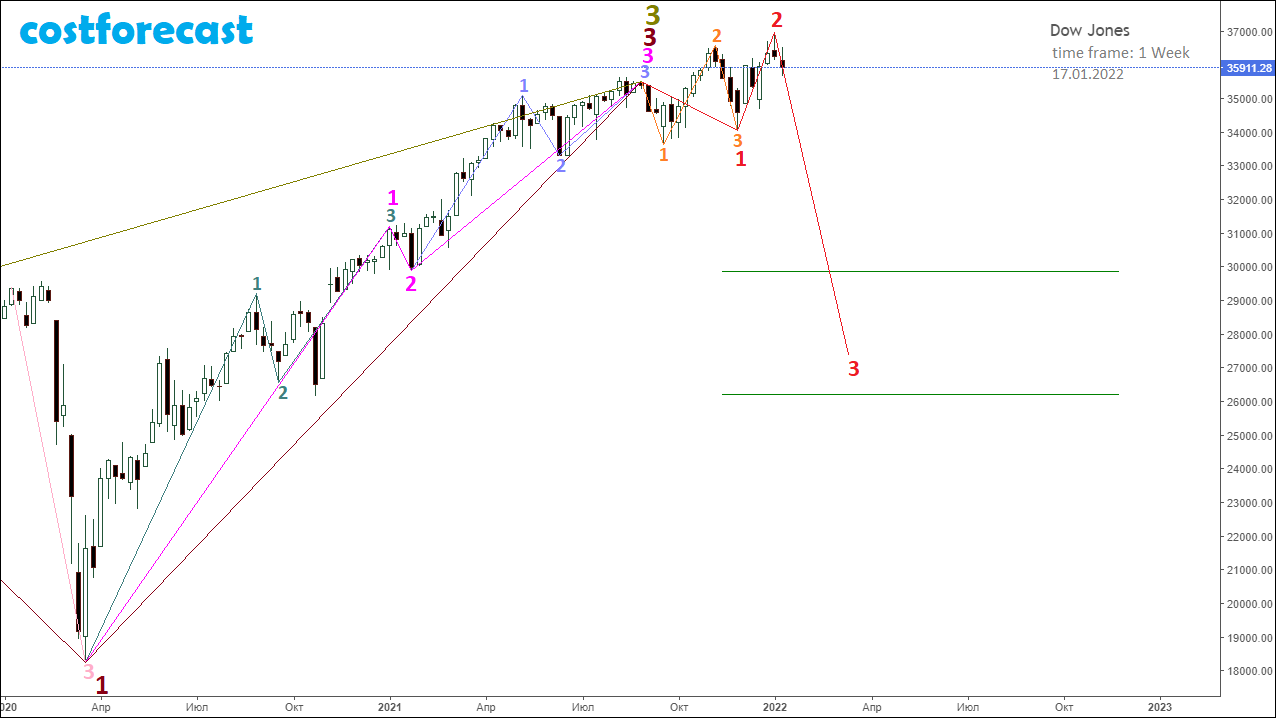
Dow Jones, fractal structure (time frame 1 day / 01/17/2022).

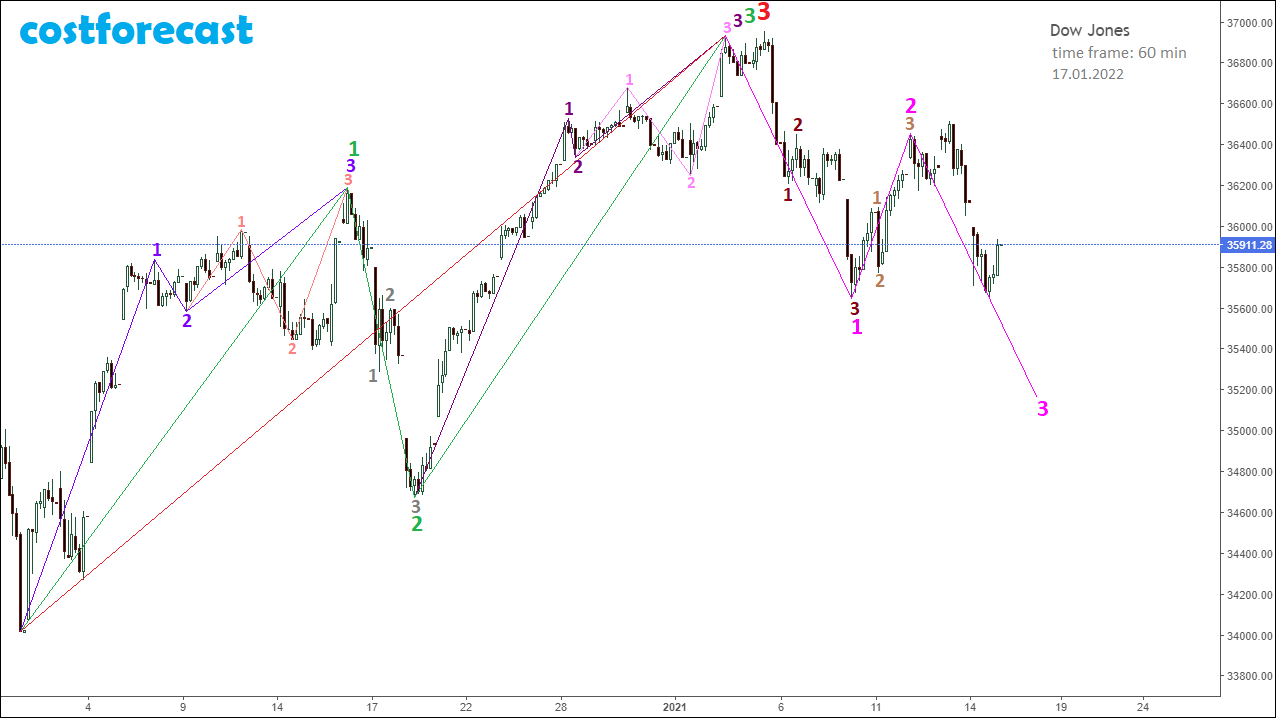
Dow Jones, fractal structure (time frame 1 hour / 01/17/2022).
As of 01/17/2022, in the fractal structure on the Dow Jones index chart, the 3rd segment of the fractal is forming, which is indicated on the chart with a 1 hour timeframe in pink.
After this pink fractal is formed, and it will be the 1st segment of the fractal of a higher order, the decrease in the values of the Dow Jones index will continue as part of the formation of the 3rd segment of this fractal, which will begin to form after the 2nd segment.
Dow Jones, fractal structure (time frame 1 hour / 01/20/2022).
As of January 21, 2022, the fractal marked in pink on the chart has completed its formation in the fine fractal structure of the Dow Jones Index chart.
All three segments of the pink fractal are completed.
The 1st segment of the pink fractal is marked with a dark brown fractal.
The 2nd segment of the pink fractal is indicated by the light brown fractal.
The 3rd segment of the pink fractal is indicated by the blue fractal.

Dow Jones, fractal structure (timeframe 1 hour / 01/20/2022)_continued.
Taking into account the existing fractal structure on the chart of the Dow Jones index, built with a time frame of 1 hour, we can assume that the fractal marked in pink is the 1st segment of the fractal of a higher order, which is marked in red on the chart.
In this case, with a high degree of probability, we can talk about the continuation of the downward dynamics of the index values within the formation of the 3rd segment of the red fractal.
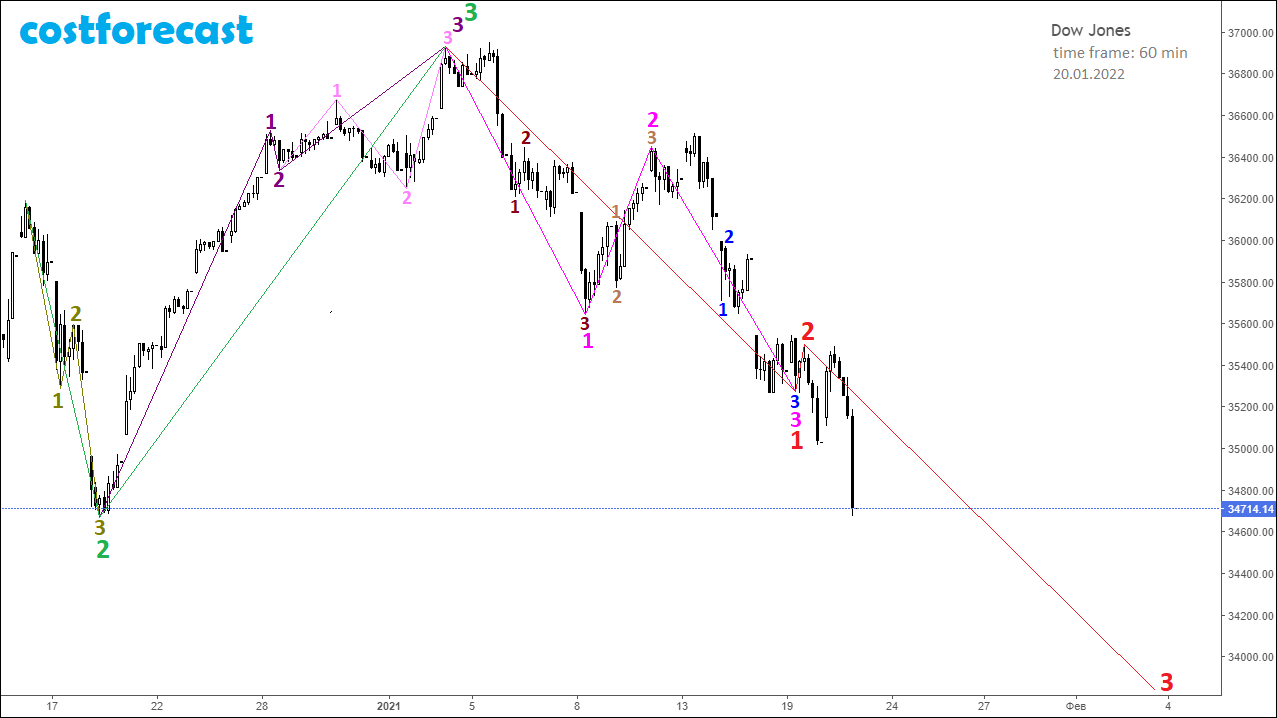
Dow Jones, fractal structure (time frame 1 hour / 01/25/2022).
Taking into account the existing fractal structure on the chart of the Dow Jones index, built with a time frame of 1 hour, we can assume that the downward dynamics of values will continue as part of the formation of the 3rd segment of the fractal, which is indicated in red on the chart.
The 1st segment of the red fractal, denoted by a fractal of a smaller order in pink, and the 2nd segment in the form of a mono-segment are completed.
The component of the 3rd segment of the red fractal is a fractal of a smaller order, which is indicated on the chart in purple.
In turn, it can be assumed that the 1st segment of the purple fractal is the fractal, which is indicated in blue. In this case, the 2nd segment of the purple fractal will be the fractal, which is marked in green. And then the upcoming dynamics will take place within the formation of the 3rd segment of the purple fractal, that is, down.
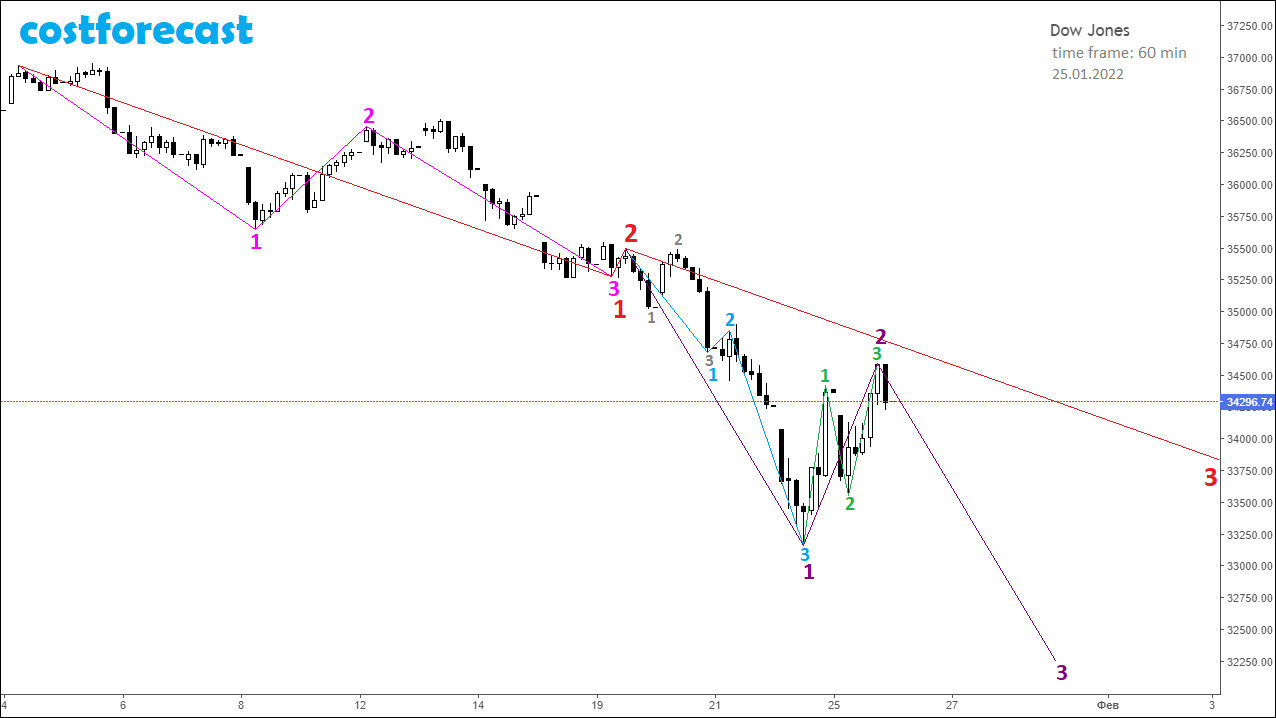
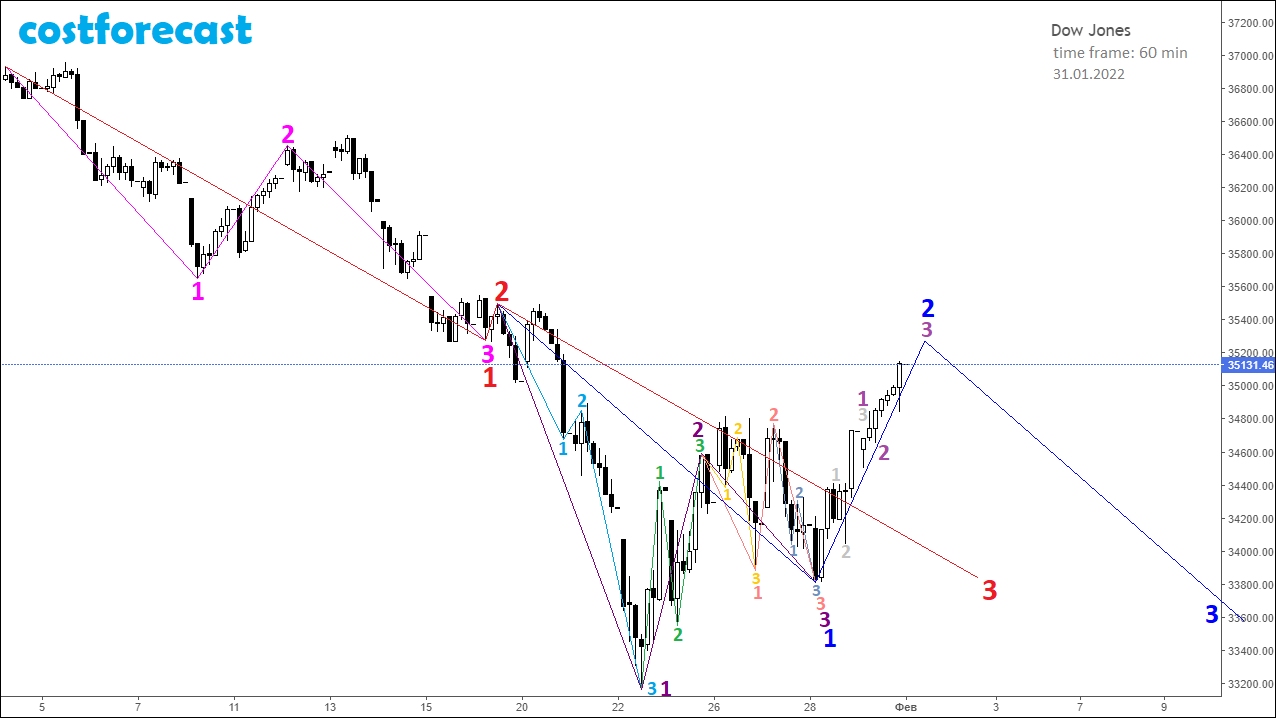
Dow Jones, fractal structure (timeframe 1 hour / 01/31/2022).
Taking into account the fractal structure formed on 02/01/2022 on the chart of the Dow Jones index, built with a time frame of 1 hour, we can assume that the 2nd segment of the fractal, which is indicated in blue, is completing.
The 1st segment of the blue fractal formed in the form of the F33 fractal from the ABC of Niro Attractors, which is indicated on the chart in purple.
In this case, the upcoming dynamics of the Dow Jones index values will be downward as part of the formation of the 3rd segment of the blue fractal, the completion of which will form a fractal, which will be the 3rd segment of the fractal of a larger order, which is indicated on the chart in red.
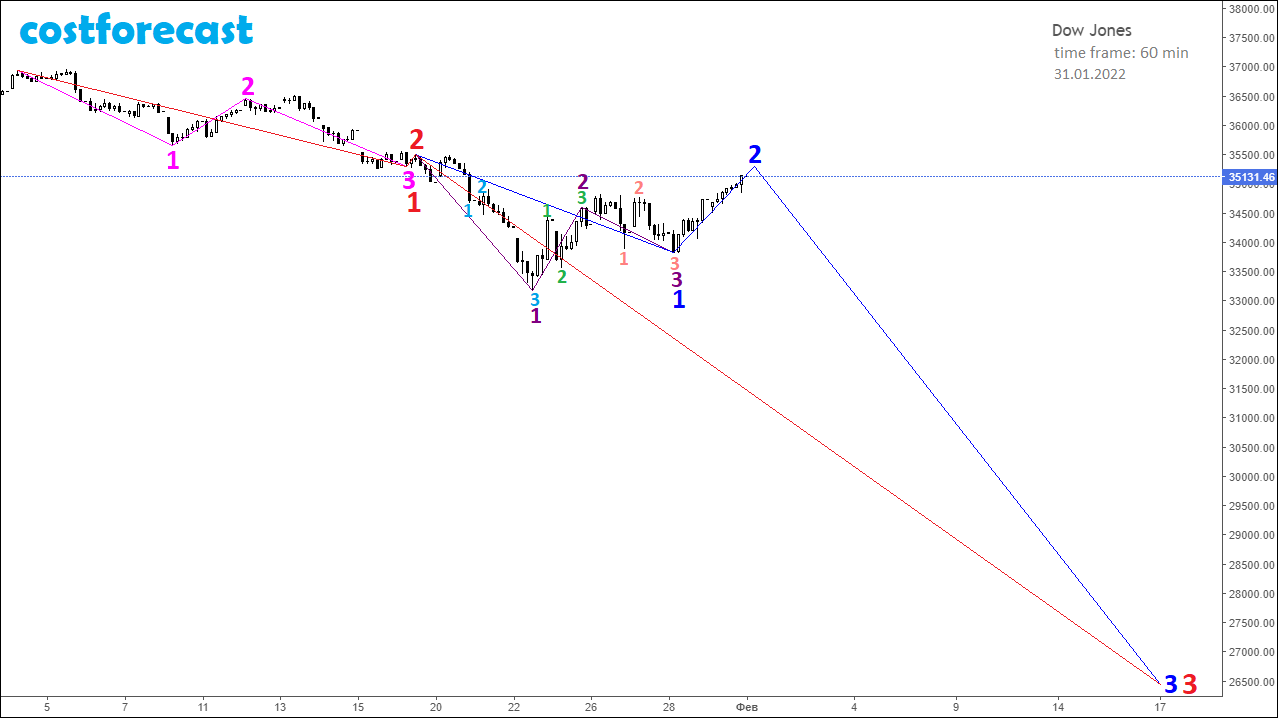
Taking into account the global fractal structure, it can be assumed that within the framework of the formation of 3 segments of fractals, which are indicated on the chart in blue and red, the values of the Dow Jones index may drop to the level of 27,000 points.
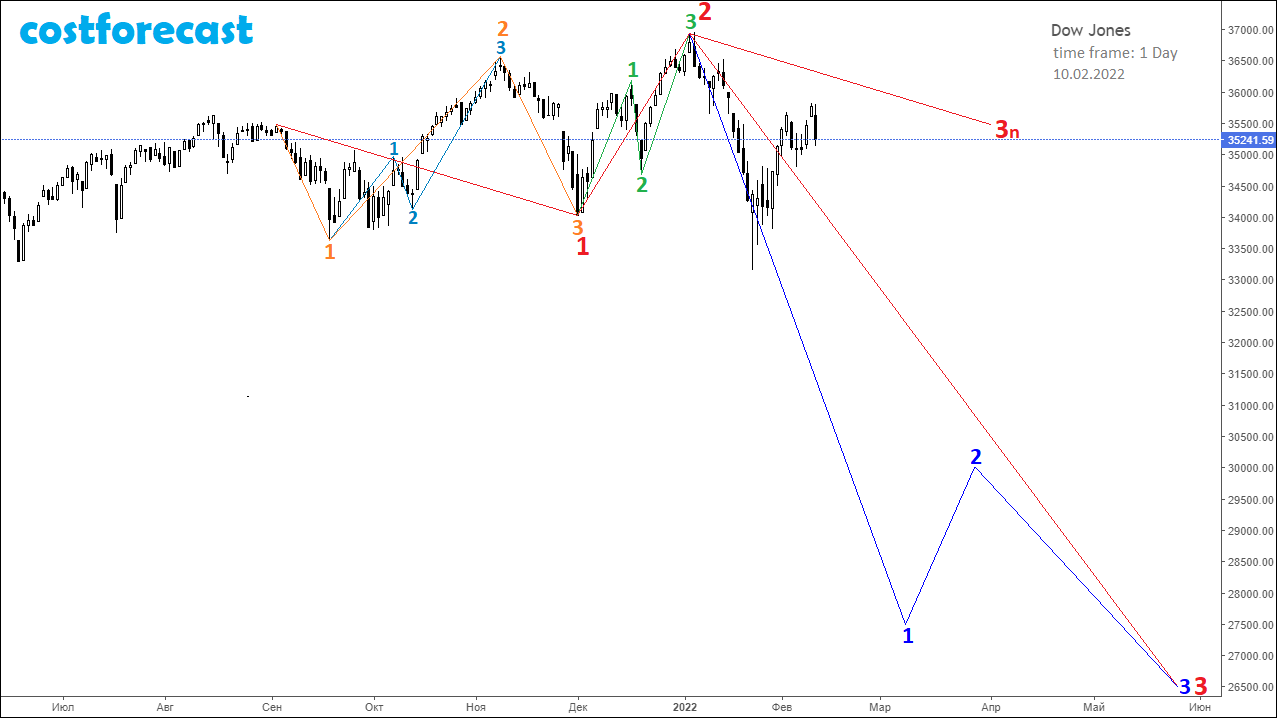
Dow Jones, fractal structure (time frame 1 Day / 02/10/2022).
Taking into account the fractal structure emerging on February 10, 2022 on the chart of the Dow Jones index, built with a time frame of 1 day, it can be assumed with a high degree of probability that the formation of the 3rd segment of the fractal, which is indicated in red on the chart.
Taking into account the global fractal structure, the most likely scenario for the formation of the 3rd segment of the red fractal will be the formation of the F34 fractal, which is indicated in blue.
The implementation of this model of the dynamics of the Dow Jones index assumes that the index values may drop to the 27'500 mark as part of the formation of the 1st segment of the blue fractal, after which the values will rebound to the level of 30'000 points as part of the formation of the 2nd segment blue fractal followed by the formation of the 3rd segment of the blue fractal and a decrease in the Dow Jones index to 26,500 points by the end of May 2022.
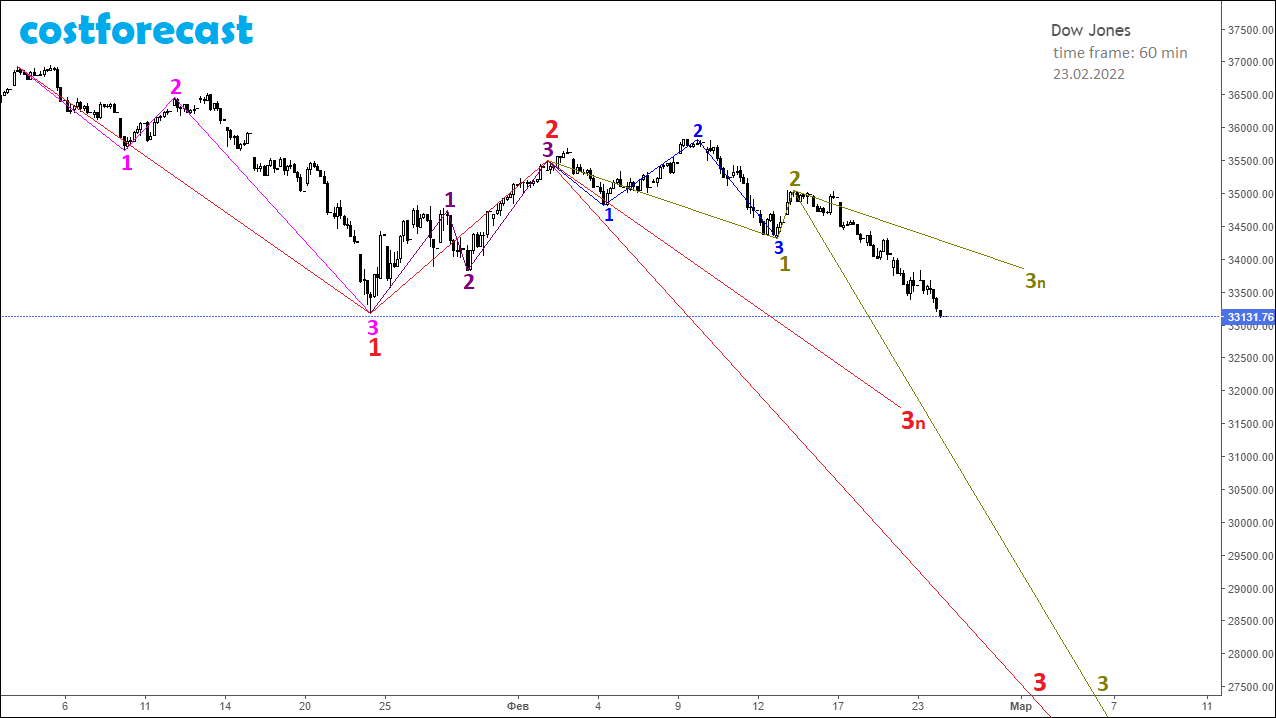
Dow Jones, fractal structure (timeframe 1 hour / 02/23/2022).
As of February 23, 2022, we can say that in the fractal structure of the Dow Jones Index chart, the formation of the 3rd segment of the fractal, marked in red, is underway.
The fractal marked in olive color represents the 3rd segment of the red fractal, which has a higher order by one.
The 1st segment of the olive fractal is marked with a blue fractal. Completion of the 1st and 2nd segments of the olive fractal indicates that the current downward dynamics of the index will continue as part of the formation of the 3rd segment.
In this case, most likely, the decrease in the index values will take place to the level of 27,000 points.
Such a model of the future dynamics of the Dow Jones index was formed by the following local fractal structures.
Dow Jones, fractal structure (time frame 1 hour / 01/20/2022).
An alternative model for the development of the fractal structure of the Dow Jones index, built with a time frame of 1 hour, suggests that the 3rd segment of the fractal, which is indicated in pink, has not yet been completed and that only the 1st and 2nd segments can be said to be completed blue fractal, which are part of the 3rd segment of this pink fractal.
In this case, the future dynamics of the index will be negative as part of the completion of the 3rd segment of the blue fractal, which will complete the 3rd segment of the pink fractal.
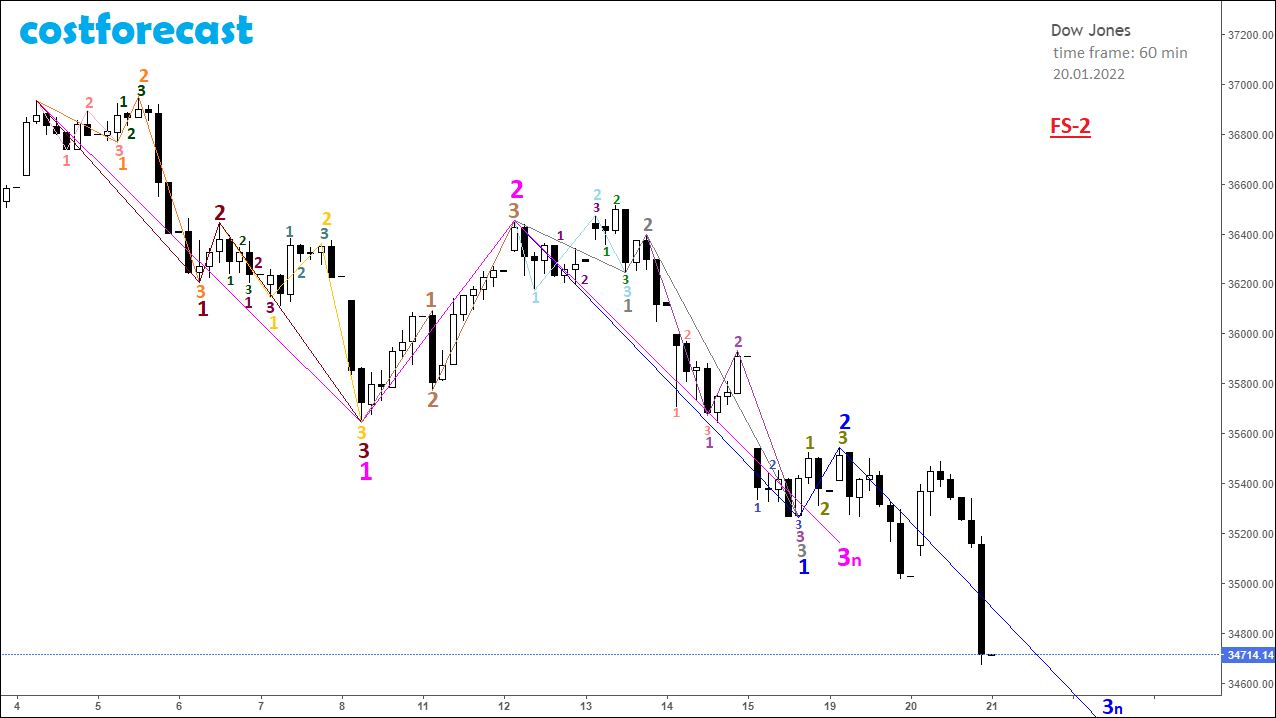
Dow Jones, fractal structure (timeframe 1 hour / 01/20/2022)_continued.
According to the alternative model FS-2 of the development of the fractal structure of the Dow Jones index chart, built with a time frame of 1 hour as of 01/20/2022, the 3rd segment of the fractal is formed, which is indicated in pink.
As part of the formation of this 3rd segment of the pink fractal, the upcoming dynamics will be downward as part of the completion of the 3rd segment of the blue fractal, which has an order of 1 unit lower than the order of the 3rd segment of the pink fractal.
In this case, we can say that the fractal indicated by the orange numbering is the 1st segment inside the 3rd segment of the blue fractal.
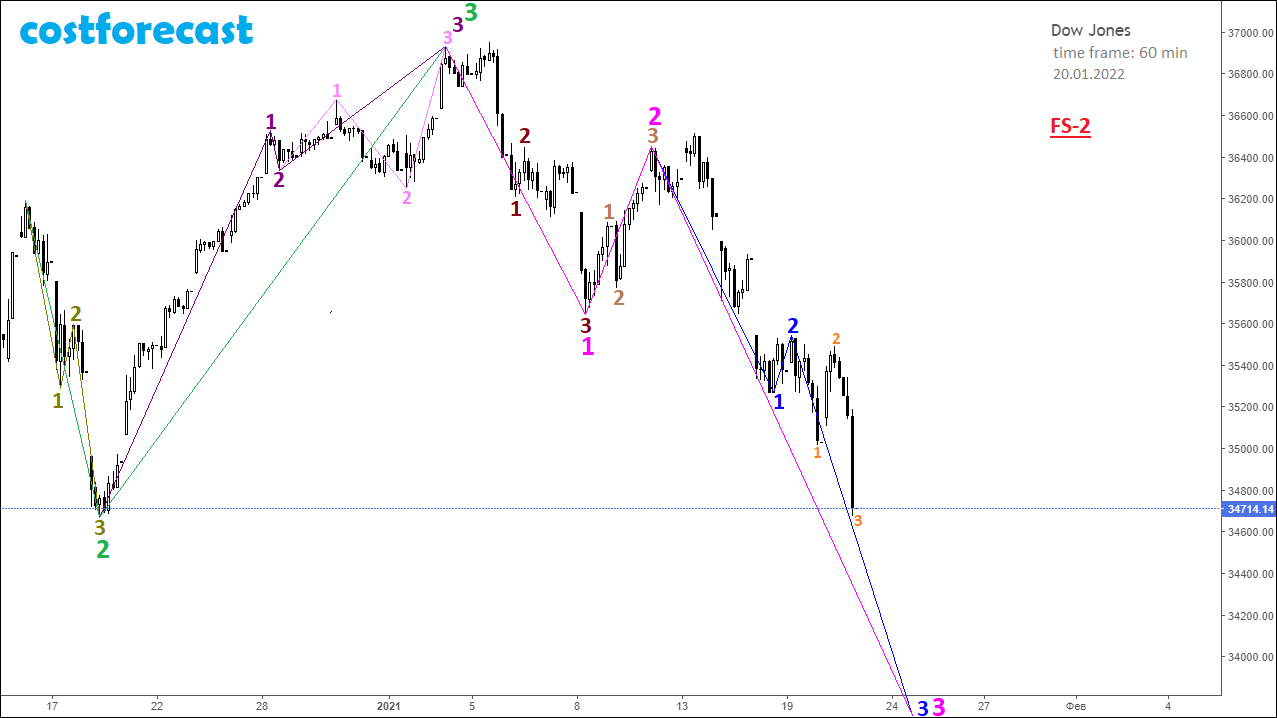
Dow Jones, fractal structure (time frame 1 hour / 01/25/2022).
As of 01/25/2022, according to an alternative model for the development of the FS-2 fractal structure, we can say that the fractal marked in pink is completed and represents the 1st segment of the fractal of a higher order, marked in red.
The completion of the pink fractal occurred with the simultaneous completion of the blue fractal, which is the 3rd segment of the pink fractal, and the blue fractal, which is the 3rd segment of the blue fractal.
In this case, it can be assumed that in the fractal structure of the chart, the formation of the 2nd segment of the red fractal, indicated by the purple fractal, is underway.
The 1st segment of the purple fractal is the green fractal. With this in mind, we can say that the upcoming dynamics of the index will be upward as part of the formation of the 2nd and 3rd segments of the purple fractal.
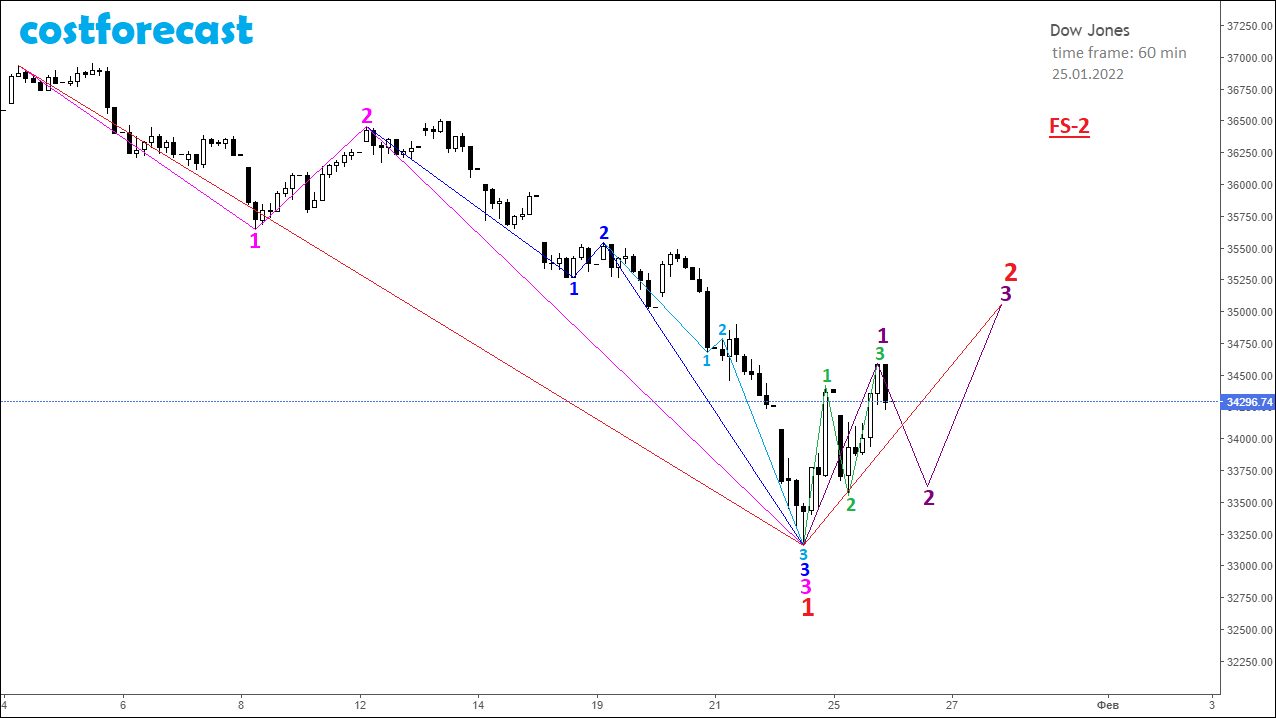
Dow Jones, fractal structure (timeframe 1 hour / 01/31/2022).
As of January 31, 2022, according to the alternative model for the development of the FS-2 fractal structure, we can say that the 2nd segment of the fractal, marked in red, is in the final stage of its formation.
After the completion of the purple fractal, which is the 2nd segment of the red fractal, the dynamics of the index will be downward as part of the formation of the 3rd segment of the red fractal.
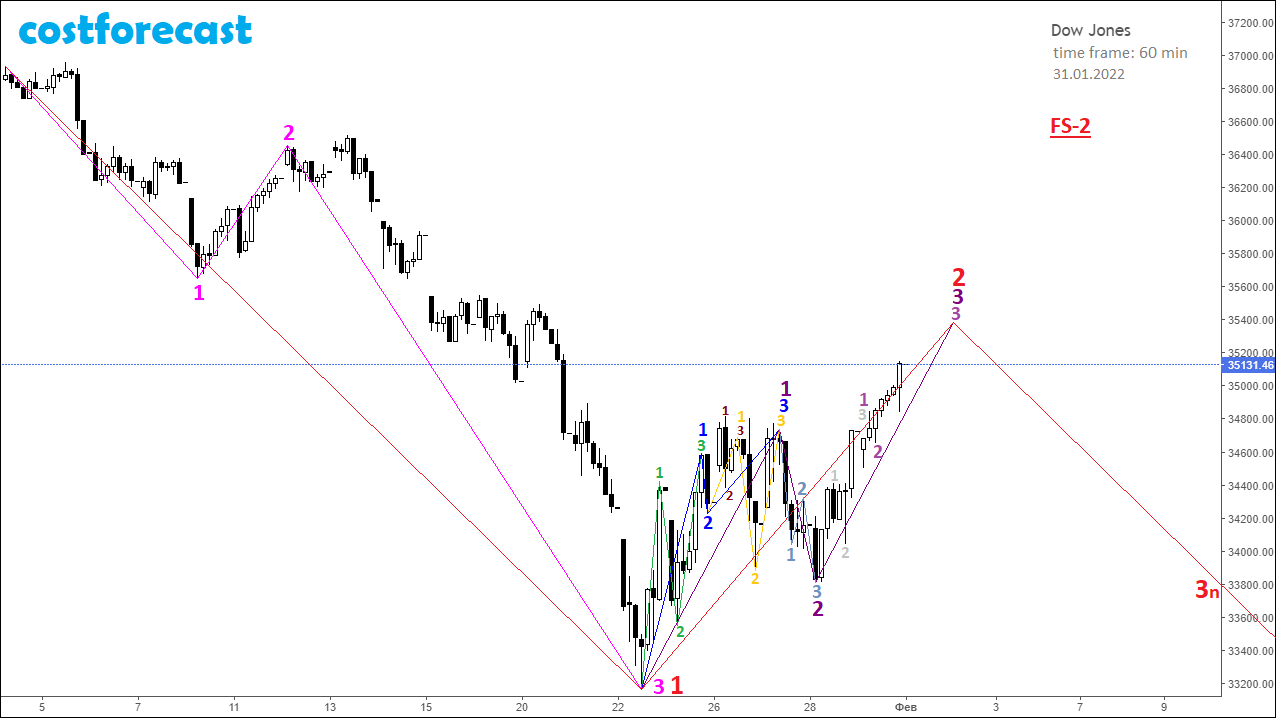
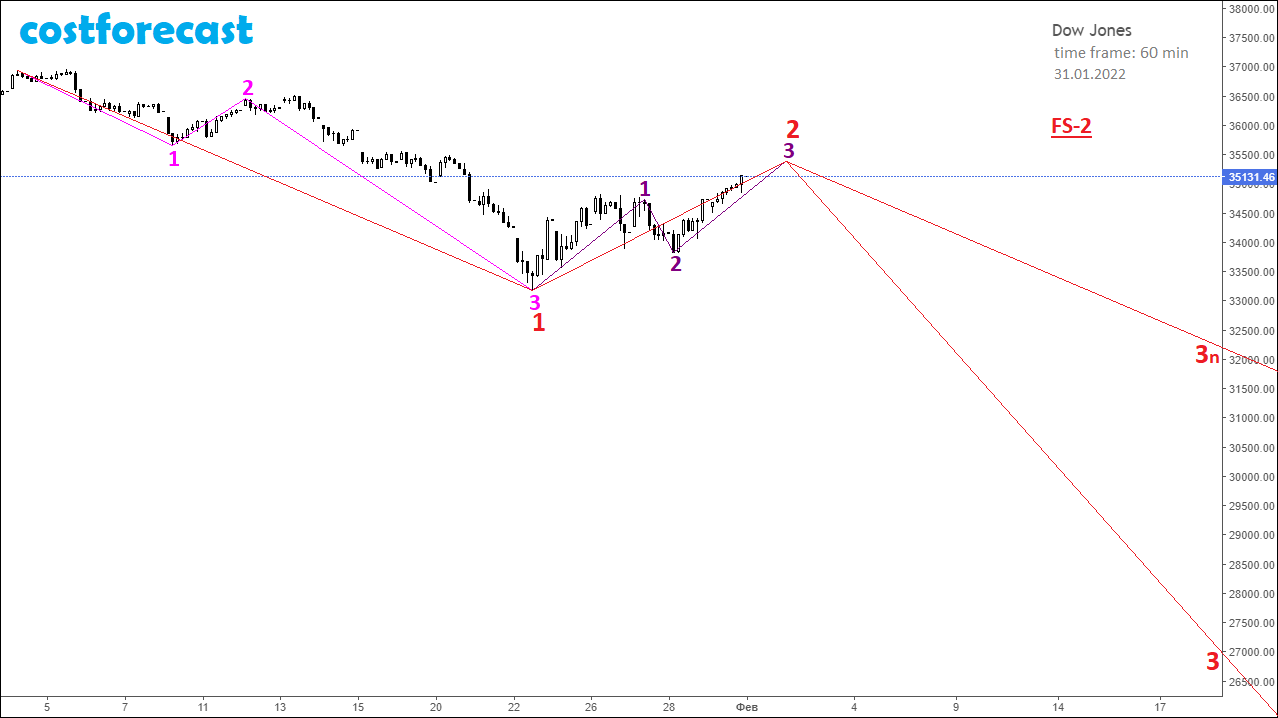
Dow Jones, fractal structure (timeframe 1 hour / 01/31/2022)_continued.
Taking into account the existing fractal structure on the chart of the Dow Jones index, built with a time frame of 1 hour, according to an alternative model for the development of FS-2 dynamics, the most likely is the fall of the index values to the level of 27,000 points as part of the formation of the 3rd segment of the fractal, designated in red.
The decrease in the index values will begin after the completion of the 2nd segment of the red fractal.
Dow Jones, fractal structure (timeframe 1 Day / 03/31/2022).
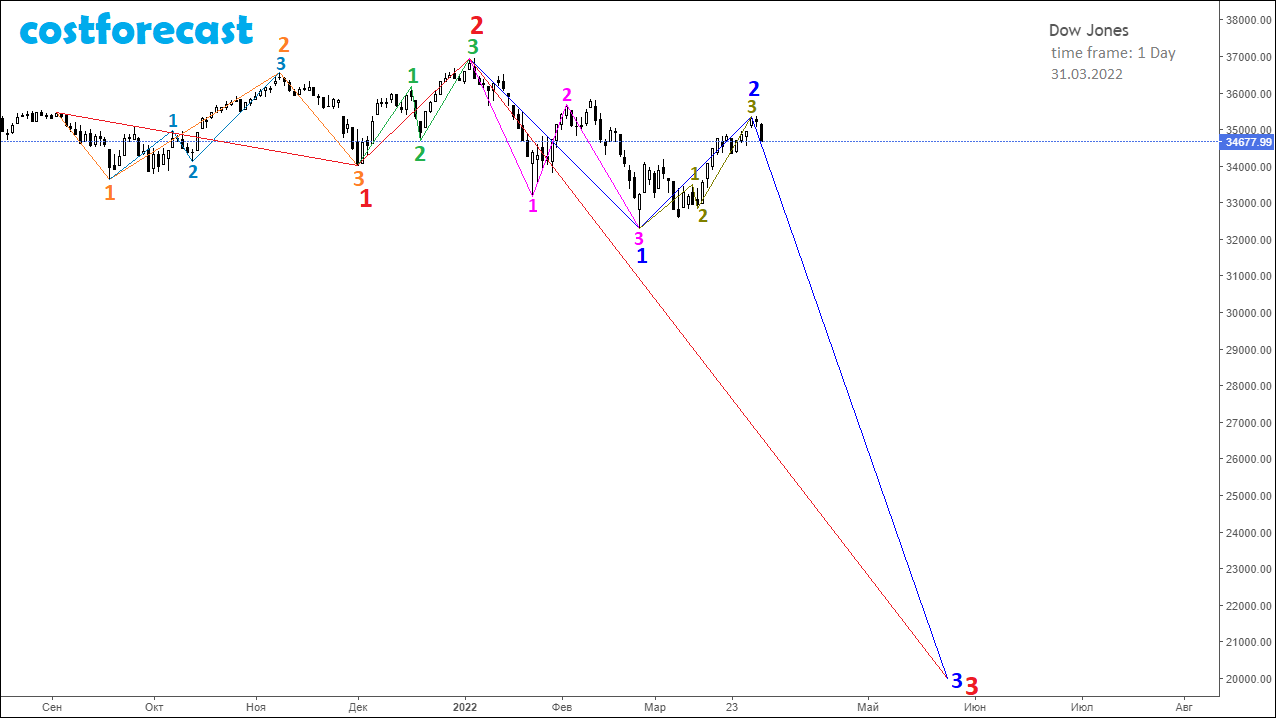
Taking into account the fractal structure of the Dow Jones index chart that was formed on March 31, 2022, built with a time frame of 1 day, we can assume that the formation of the 3rd segment of the fractal, which is indicated in red on the chart.
The 3rd segment of the red fractal is a fractal of a smaller order, marked in blue on the chart.
The 1st segment of the blue fractal was formed on the time interval (01/03/2022, 02/24/2022), on the chart it is indicated by a pink fractal.
The 2nd segment of the blue fractal was formed on the time interval (02/24/2022, 03/29/2022), on the chart it is indicated by an olive fractal.
Given the above, we can say that the upcoming dynamics of the Dow Jones index will be downward towards the level of 20,000 points as part of the formation of the 3rd segment of the blue fractal.
The completion of the blue fractal, which can occur around 05/18/2022, will mean the completion of a fractal that is one order of magnitude higher, which is indicated in red on the chart on the time interval (09/02/2021, 05/18/2022).
After the completion of the downward directed red fractal, the formation of an upward directed fractal in the direction of 26,000 points will follow.
Dow Jones, fractal structure (time frame 1 Week / 07/12/2022).
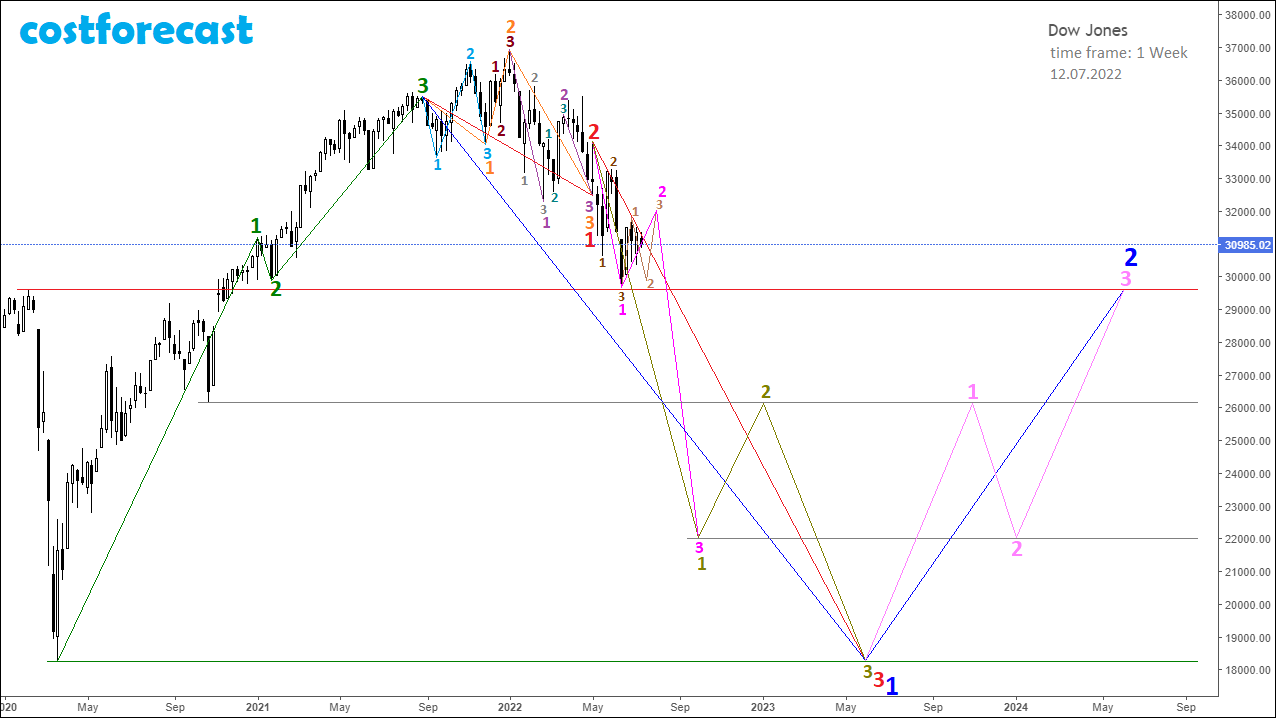
Taking into account the fractal structure of the Dow Jones Index chart that was formed on 07/12/2022, built with a 1-week timeframe, we can assume that the current dynamics of the index values takes place as part of the formation of the 2nd segment of the fractal, which is indicated in bright pink. The future dynamics of values will continue in a sideways trend to form a fractal, indicated on the chart in light brown.
The completion of this light brown fractal will be the completion of the 2nd segment of the bright pink fractal, after which the index values will decrease to the level of 22’000 points as part of the formation of the 3rd segment of the bright pink fractal.
The bright pink fractal will represent the 1st segment of the higher order fractal, which is marked in olive color on the chart. After the index values drop to 22’000 points, the downward dynamics will end and an uptrend will follow to the level of 26’000 points as part of the formation of the 2nd segment of the olive fractal. After that, the downtrend will continue from 26,000 points to 18,000 points as part of the formation of the 3rd segment of the olive fractal.
The completion of the olive fractal will mean the completion of the 3rd segment of the higher order fractal, which is indicated in red, in which the 1st segment is indicated by an orange fractal, and the 2nd segment is a mono-segment.
As for the orange fractal, its formation began on September 2, 2021 and its 1st segment is indicated by a blue fractal, the 2nd segment is indicated by a dark brown fractal, and the 3rd segment is indicated by a light purple fractal.
Thus, the completed red fractal will be the 1st segment of the higher order fractal, indicated in blue. In this case, from the mark of 18'000 points, an uptrend should be expected towards the mark of 30'000 points within the formation of a pink fractal, which is the 2nd segment of the blue fractal.
Dow Jones, fractal structure (time frame 1 Week / 09/30/2022).
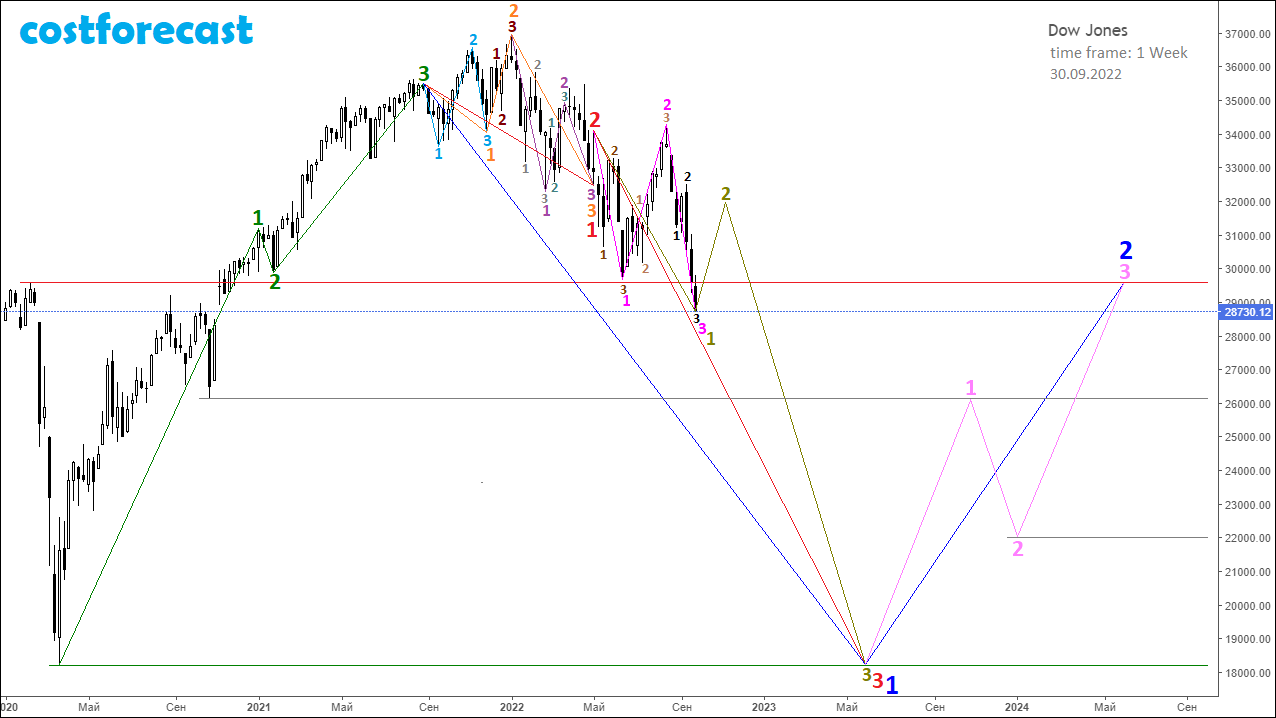
Taking into account the fractal structure of the Dow Jones index chart that was formed on September 30, 2022, built with a time frame of 1 week, it can be assumed that a fractal has formed in the fractal structure, indicated in bright pink, which is the 1st segment of a fractal of a higher order, which is indicated on graphics in olive color.
In this case, the upcoming dynamics of the Dow Jones index values will take place in an uptrend as part of the formation of the 2nd segment of the olive fractal, after which the downtrend will continue towards the 18,000 points mark.
The olive fractal formed in this way will be the 3rd segment of the higher order fractal, which is marked in red, and which will form the 1st segment of the even higher order fractal, marked in blue.
Dow Jones, fractal structure (time frame 1 Week / 11/18/2022).
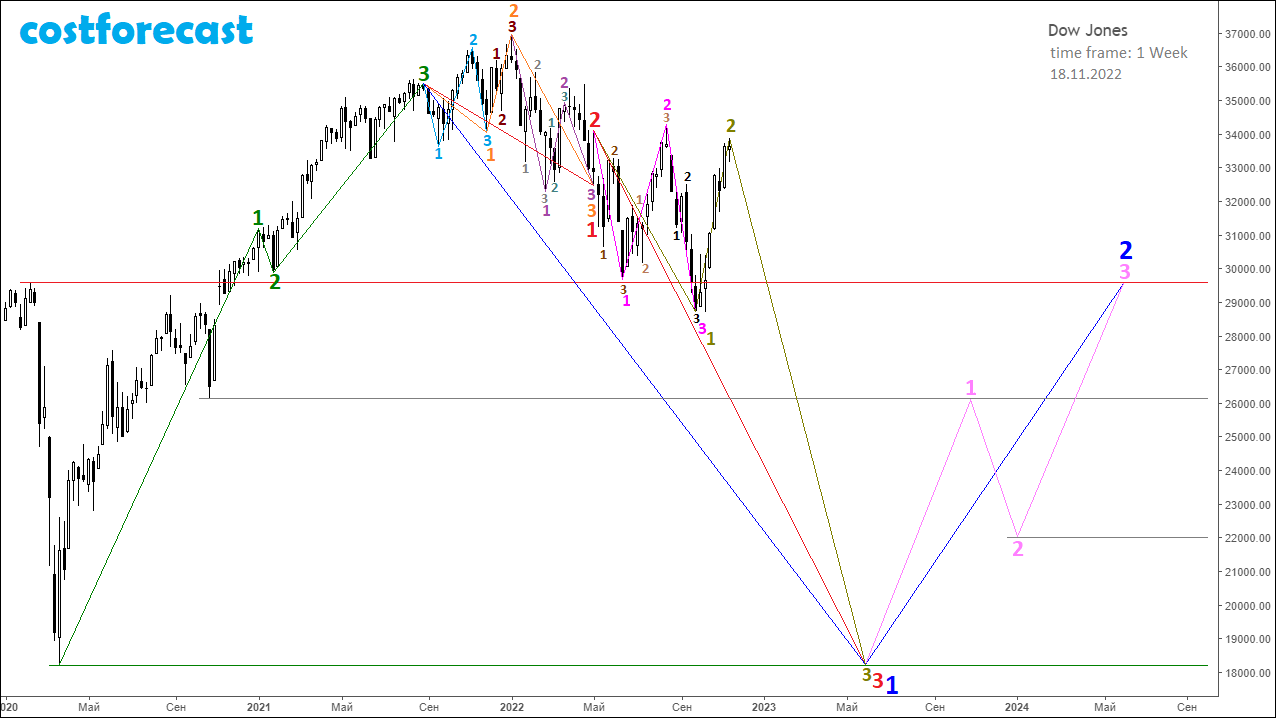
Analyzing the fractal structure formed on the graph of the dynamics of the Dow Jones index, built with a time frame of 1 week as of 11/18/2022, we can assume that in the time interval (09/30/2022; 11/14/2022) the 2nd segment of the fractal was formed , which is marked in olive color on the graph.
At the moment, the most likely scenario is that the future dynamics of the Dow Jones index will take place in a downtrend as part of the formation of the 3rd segment of the olive fractal towards the support level at around 18,000 points.
The 1st segment of the olive fractal was formed on the time interval (05/04/2022; 09/30/2022) in the form of an F23 fractal, indicated in bright pink.
After its completion, the olive fractal will be the 3rd segment of a fractal of a higher order, indicated in red, the 1st segment of which was formed on the time interval (09/02/2021; 05/02/2022) in the form of a fractal, which is indicated in orange, and The 2nd segment of this red fractal formed as a mono-segment on the time interval (05/02/2022; 05/04/2022).
In this case, the collapse of the American stock market will end with the formation in the fractal structure on the graph of the dynamics of the values of the Dow Jones index of the 1st segment of the fractal, marked in blue, representing the F11 fractal, which is marked in red.
The most likely end of the fall of the index may occur at around 18,000 points. However, anything can happen, and with very strong volatility, this support level can be easily broken.


