Price Pattern Analysis for US Dollar, S&P 500, Gold and Grude Oil - S&P 500 Probes Support, Gold at Low, Crude Oil Hits Levels Unseen Since 2009

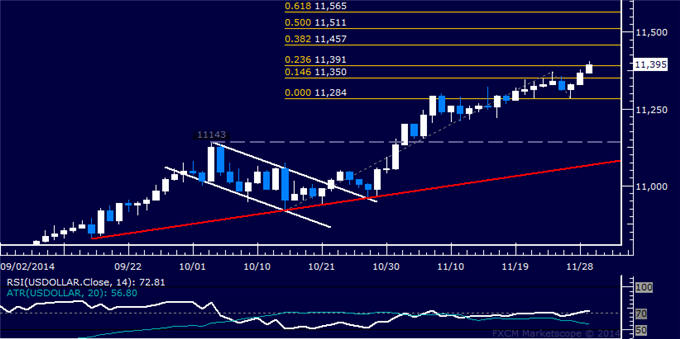
Buyers are back on the offensive, with prices pushing to a new five-year high. A daily close above the 23.6% Fibonacci expansion at 11391 exposes the 38.2% level at 11457.
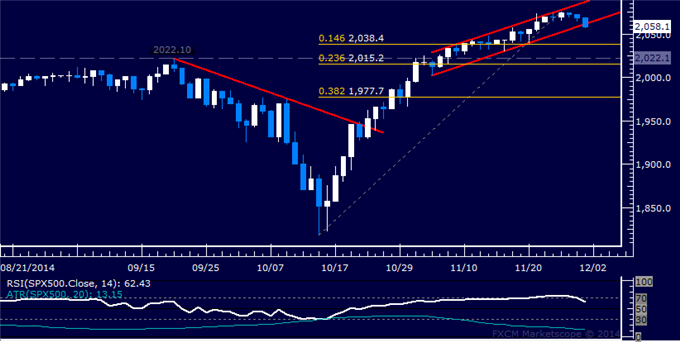
S&P 500 TECHNICAL ANALYSIS
Prices are probing below support
at the bottom of a rising channel set from early November (2061.70),
with a breach of this barrier on a daily closing basis exposing the
14.6% Fibonacci retracement at 2038.40.
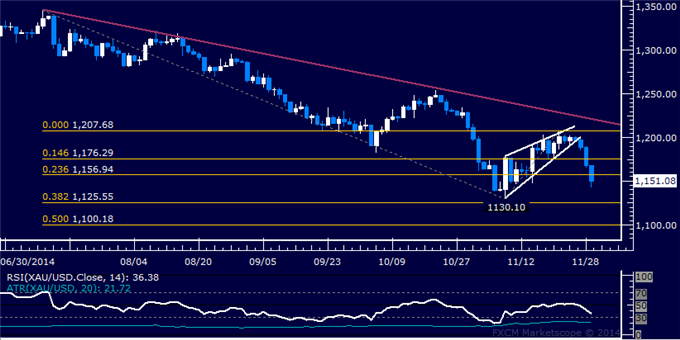
GOLD TECHNICAL ANALYSIS
Prices turned lower as expected,
completing a Rising Wedge chart pattern. A daily close below the 23.6%
Fibonacci expansion at 1156.94 exposes the 1125.55-1130.10 area
(November 7 low, 38.2% level).
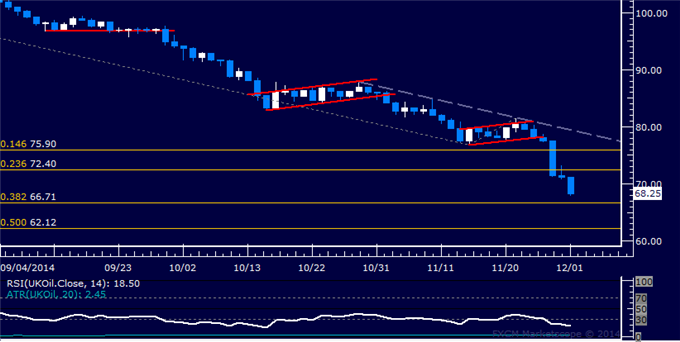
CRUDE OIL TECHNICAL ANALYSIS
Prices continue to face heavy
selling pressure, dropping to the weakest level in five years. A daily
close below the 38.2% Fibonacci expansion at 66.71 exposes the 50% level
at 62.12.