• Обзор
  • Отзывы (1)
  • Обсуждение (21)
  • Что нового

ASPCT Boom Crash Pandora

5

Профессиональный Инструмент для Скальпинга на Deriv

Внимание! Индикатор будет продан в ограниченном количестве!!!

Предыщуие 5 копий были проданы по 250$

Оставшиеся 4 копии будут проданы по 350$

Следующая цена 500$


Описание:

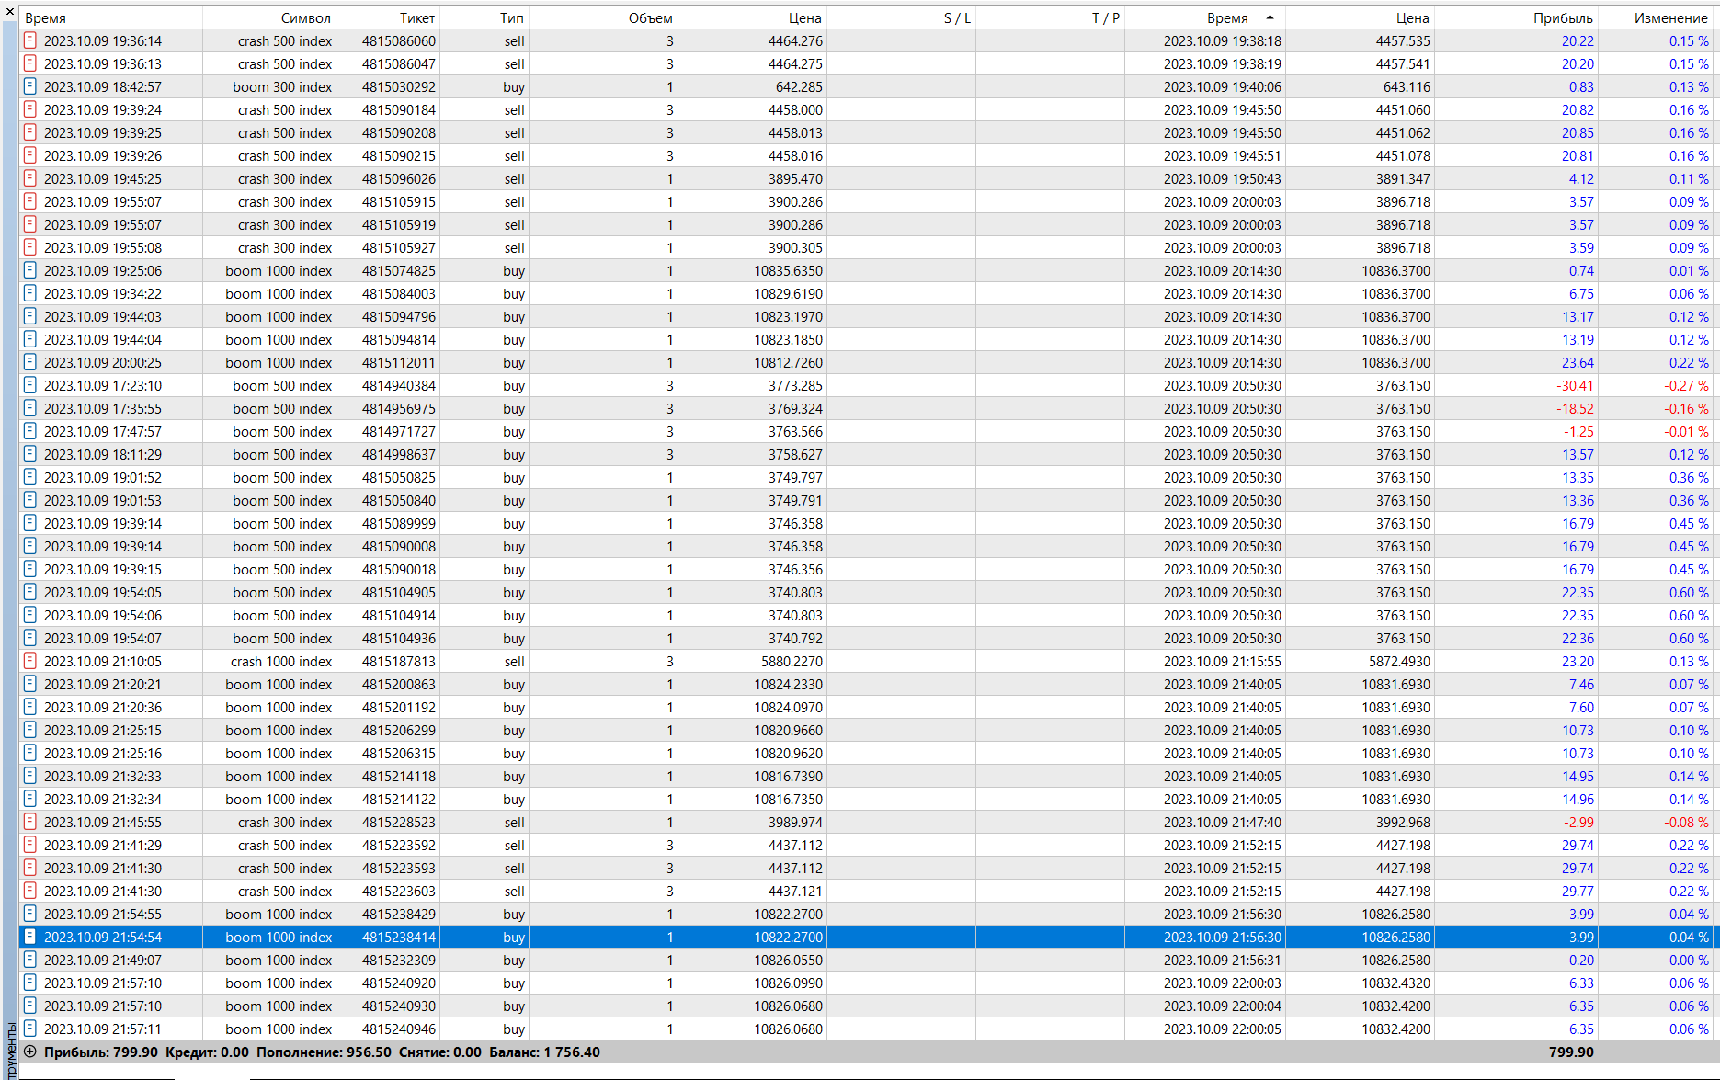
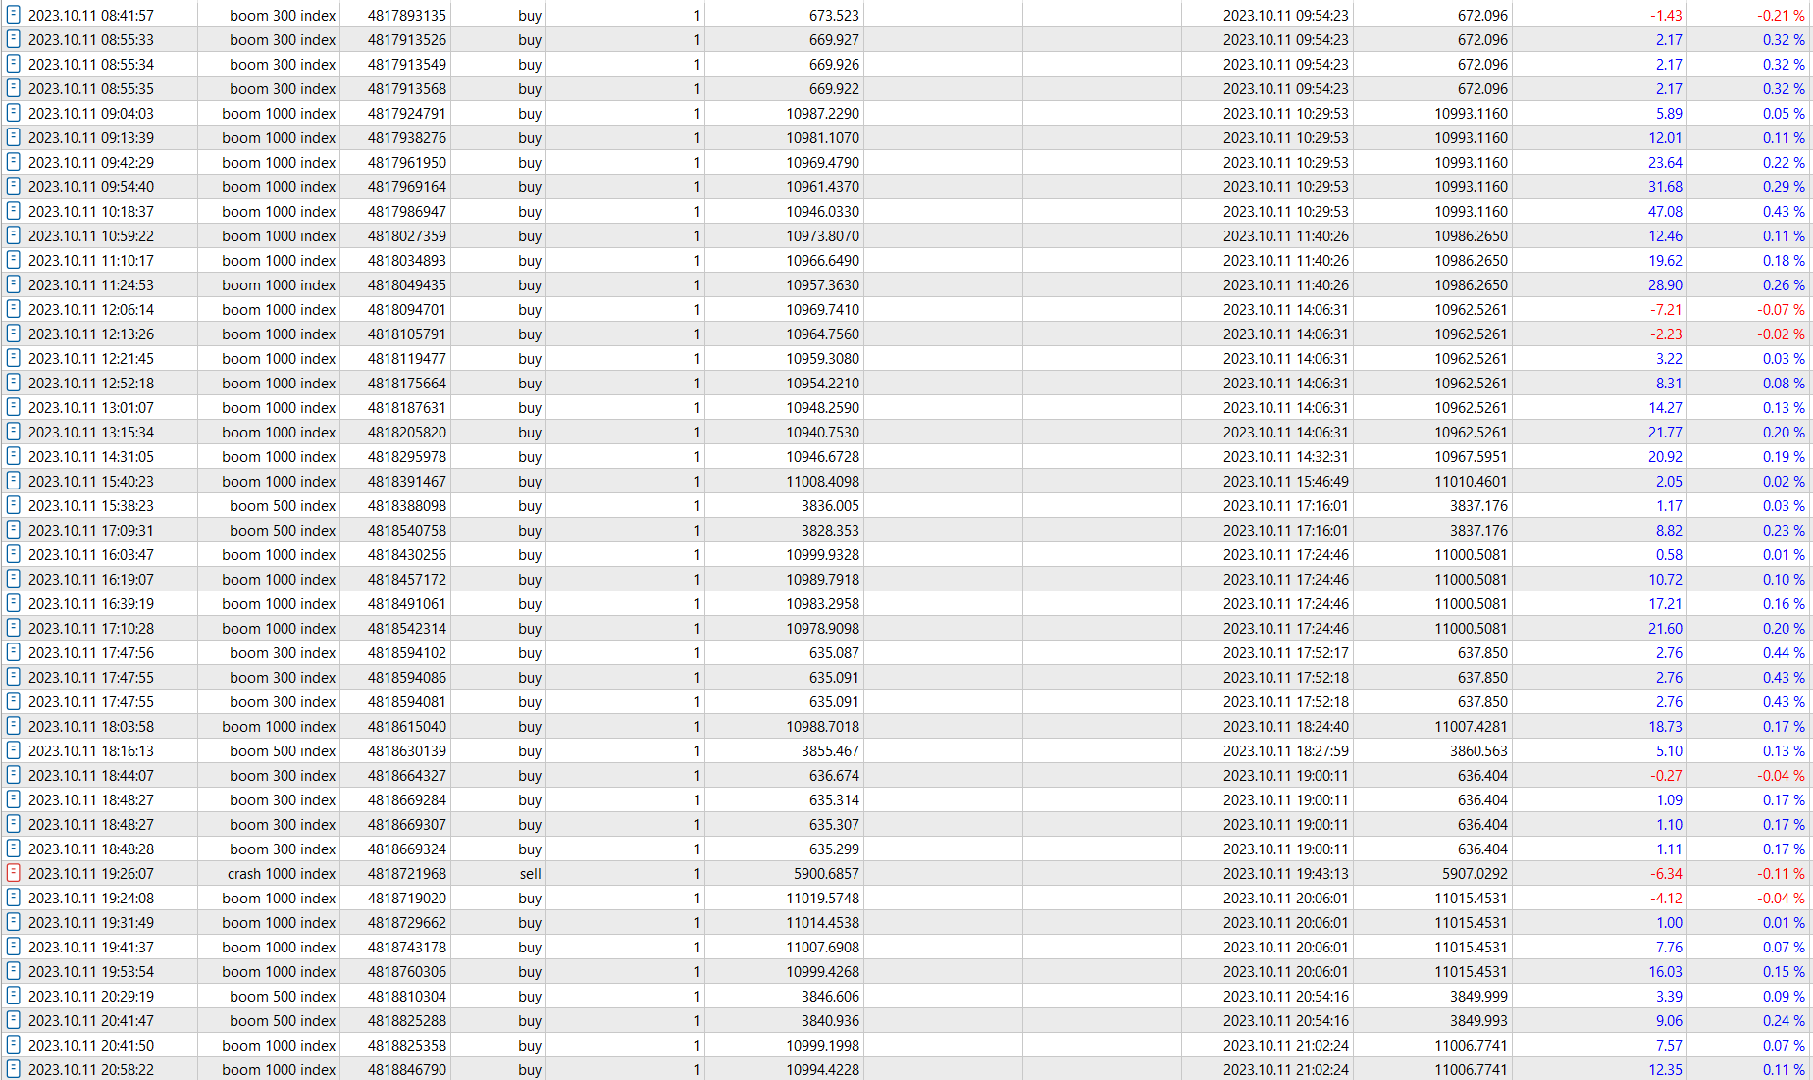
Этот торговый индикатор предназначен для профессиональных трейдеров, ориентированных на скальпинг. Разработанный с учетом особенностей рынка, он предоставляет высокоточные сигналы для торговли в сторону спайков. Работает на таймфрейме М1 и поддерживает следующие символы: Boom 300 Index, Boom 500 Index, Boom 1000 Index, Crash 300 Index, Crash 500 Index, Crash 1000 Index.

Функциональные Особенности:

- Направление:
  - Торговля ведется только в направлении спайков.

- Фильтры и индикаторы
  -
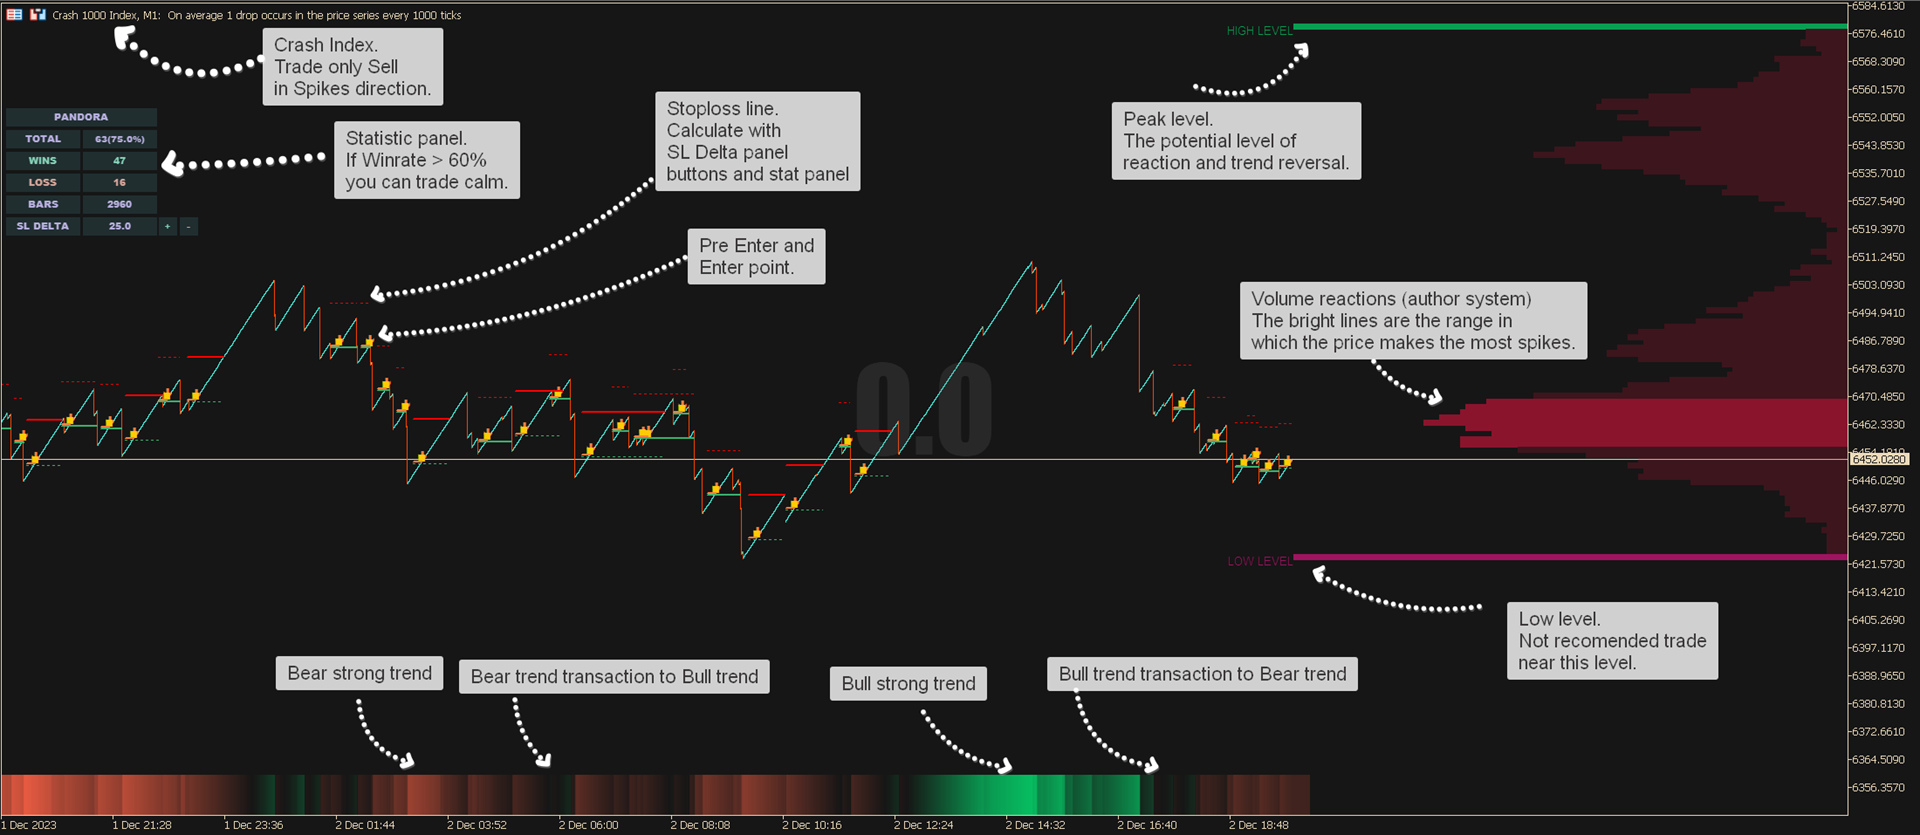
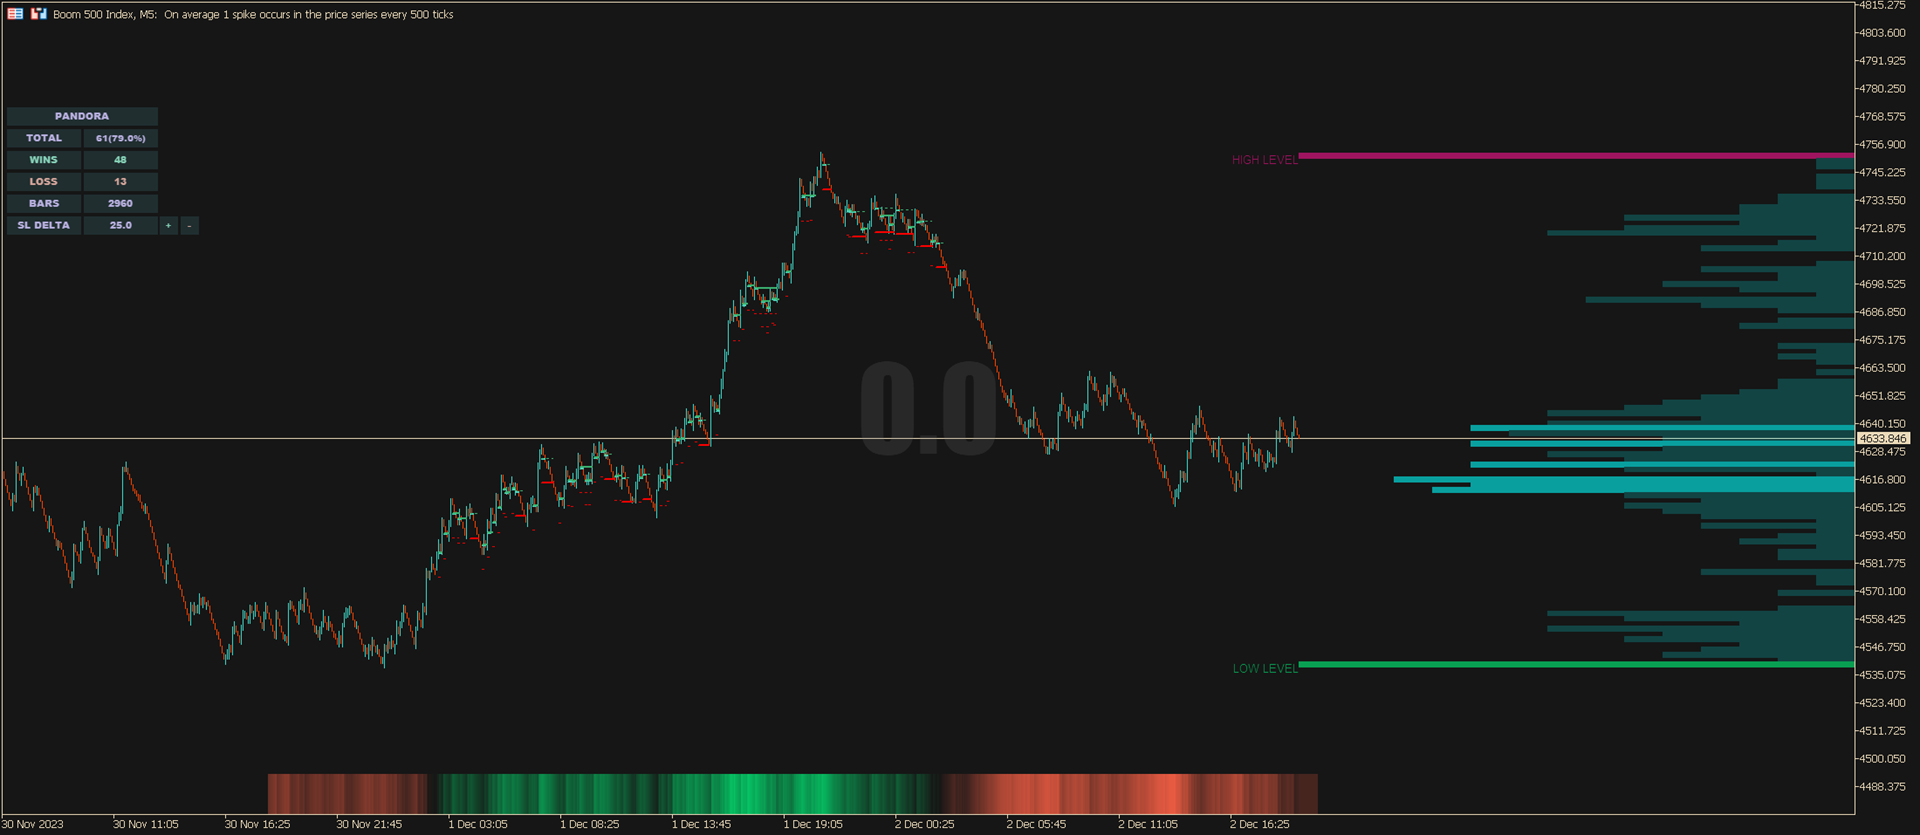
Авторский индикатор Объемов реакций который отображает зону в которой цена чаще всего отбивалась Спайками
  - Авторский индикатор тренда и его силы, для анализа угасания тренда и текущего тренда
  - Уровни максимум цены и минимум цены за указанный период для оценки потенциальной точки входа или разворота

- Алерты:
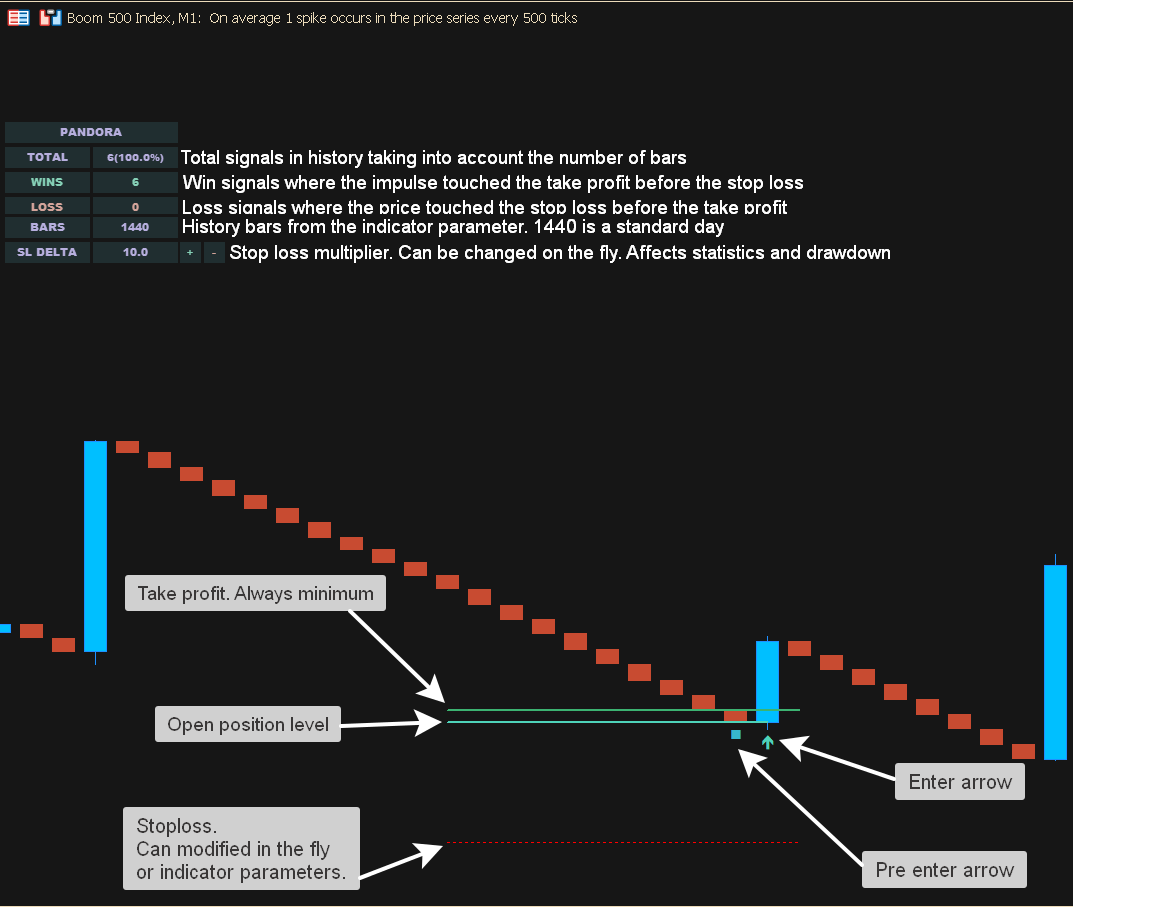
  - Предварительный алерт перед выдачей сигнала.
  - Точка входа подается на следующей свече.

- Уровни:
  - Отображение уровней стоплосс согласно установленным параметрам.

- Рекомендации:
  - Продемонстрировано отличное качество сигналов при увеличении дельты стоплосса и использовании торговой сетки ордеров.

- Панель статистики и управления:
  - Предоставляет статистику за указанный период последних баров.
  - Отображает общее количество точек входа, побед и поражений.
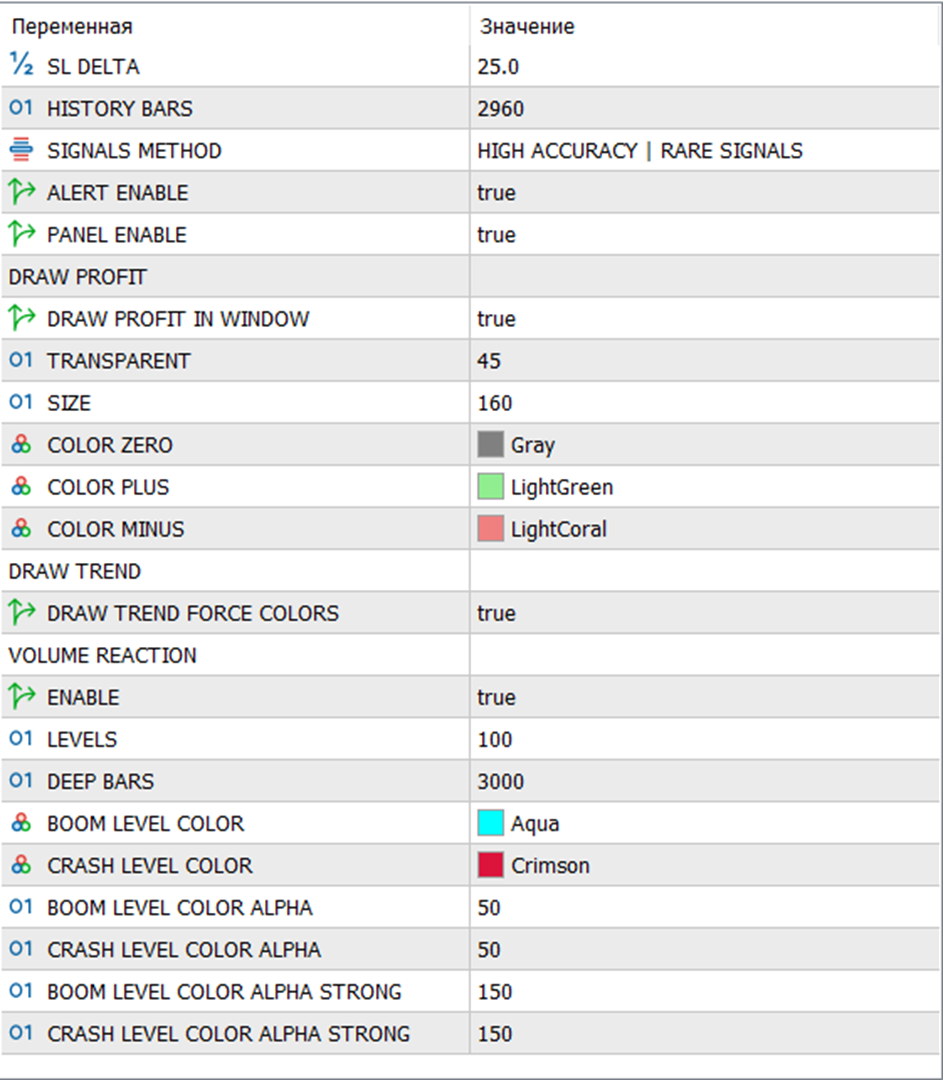
  - Размер дельты стоплосса регулируется в реальном времени.

- Статистика:
  - Победа - пробой уровня тейкпрофит до касания стоплосса, и наоборот.

- Дополнительная статистика:
  - Рекомендуется установить количество баров на несколько дней для более точной оценки. 1440 баров это сутки.

- Управление множителем стоплосса:

  - Возможность регулировать множитель стоплосса в реальном времени с помощью кнопок + и -. 

- Принцип работы:

Индикатор дает ранний сигнал на вход в сделку (квадрат), а на следующей свече показывает точку входа. Вы можете войти в сделку уже по раннему сигналу, если он подтвержден другими факторами. Для более точного определения момента входа вы можете использовать дополнительные авторские индикаторы, такие как Объем реакций, Индикатор тренда и Уровни Максимума и Минимума. Таким образом, если вы видите точку входа, которая находится в яркой зоне Объема реакций, цвет тренда совпадает с направлением спайков, и точка входа не касается красного уровня Максимума или Минимума, то вероятность успешной сделки выше.

Важные Замечания:

- Дельта Стоплосса:
  - Повышение дельты стоплосса может увеличить винрейт и доходность, но также повысит возможную просадку.

- Параметры:
  - Рекомендуется заранее установить значение дельты стоплосса.

- Типы Сигналов:
  - 1. Много сигналов, низкая точность.
  - 2. Высокая точность, меньше сигналов.
  - 3. Очень точные сигналы, очень мало их.

Рекомендации по Типам Сигналов:

- 1. Подходит для высокочастотной торговли с необходимым мощным мани- и риск-менеджментом.
- 2. Очень точные сигналы подходят для торговли большими лотами или свинг-торговли.

Важно! Перед покупкой продукта обязательно тестируйте его в тестере стратегий. Ни один продукт не может гарантировать ожидаемые результаты. Торговля ведется под свою ответственность.
Теперь у вас в распоряжении инструмент, который позволяет эффективно скальпировать рынок с использованием профессиональных стратегий. Помните о необходимости тестирования перед реальной торговлей и придерживайтесь рекомендаций по управлению рисками. Удачи в торговле!


Отзывы 1
Christian Rodas
28
Christian Rodas 2024.01.03 22:30 
 

As described, easy to use and very complete

Рекомендуем также
Disclaimer : Keep in mind that seasonal patterns are not always reliable. Therefore, thoughtful risk management is crucial to minimize losses.  Seasonal patterns in the financial world are like a well-guarded secret that successful investors use to their advantage. These patterns are recurring price movements that occur during specific periods or around special events. Additionally, there are also intraday patterns that repeat. For example, Uncle Ted from Forex Family suggests examining previou
Impulse fractals indicator - is counter-trend oriented complex market fractal pattern.  Market creates bull/bear impulse, trend starts, fractals on impulsed wave are an agressive pullback signals. Buy arrow is plotted when market is bearish and it's impulse showed up-side fractal, and sell arrow is plotted when market is bullish and it's impulse showed dn-side fractal. Main indicator's adjustable inputs : impulsePeriod - main period of impulse histogram  filterPeriod  - smoothes impulse accordi
Ignition
Dansie Software Limited
Strategy Overview The Ignition EA tries to take advantage of sudden momentum when the Ignition pattern is detected. The final bar in the ignition pattern has a small opening wick, a very little or no closing wick, is large in comparison to recent bars and must start from the lower end of the current range (for a bullish ignition) Quick Testing Use Symbol EURUSD, Timeframe M2, and remove the GBPUSD symbol from the "Symbols" input (stratergy 1 and stratergy 2) Settings The below settings
TPO Profile MT5
Kyra Nickaline Watson-gordon
Definition : TPO is a Time Price Opportunity. Instead of using bars or candles with an Open, High, Low, and Close price, each "bar" in a Market Profile is represented by horizontal bars against the price It is called Market Profile terminology. In other words time-price-opportunity (TPO) profiles are histograms of how much time was spent at each price within the span of the profile. By using a TPO chart, you are able to analyze the amount of trading activity, based on time, for each price leve
Value Chart Candlesticks
Flavio Javier Jarabeck
4.67 (9)
The idea of a Value Chart indicator was presented in the very good book I read back in 2020 , " Dynamic Trading Indicators: Winning with Value Charts and Price Action Profile ", from the authors Mark Helweg and David Stendahl. The idea is simple and the result is pure genius: Present candlestick Price analysis in a detrended way! HOW TO READ THIS INDICATOR Look for Overbought and Oversold levels. Of course, you will need to test the settings a lot to find the "correct" one for your approach.
FREE
MIDAS Super VWAP
Flavio Javier Jarabeck
4.29 (14)
Imagine VWAP, MVWAP and MIDAS in one place... Well, you found it! Now you can track the movement of Big Players in various ways, as they in general pursue the benchmarks related to this measuring, gauging if they had good execution or poor execution on their orders. Traders and analysts use the VWAP to eliminate the noise that occurs throughout the day, so they can measure what prices buyers and sellers are really trading. VWAP gives traders insight into how a stock trades for that day and deter
FREE
Reverse side scalper is the manual trading system, that works on choppy(anti-trend) market. As a rule markets are on 80% choppy and only 20% is trend phase. System is based on custom step Moving and RSI and reverse pattern. System defines up movement, down movement, trend / choppy phases. Indicator plots Buy signal arrow when current direction is down and phase is trend, Sell signal arrow is plotted when currently is up movement and phase is trend. As a rule it allows to "catch" local maximum/mi
Aggression Volume
Flavio Javier Jarabeck
3.86 (21)
Aggression Volume Indicator is the kind of indicator that is rarely found in the MQL5 community because it is not based on the standard Volume data provided by the Metatrader 5 platform. It requires the scrutiny of all traffic Ticks requested on the platform... That said, Aggression Volume indicator requests all Tick Data from your Broker and processes it to build a very special version of a Volume Indicator, where Buyers and Sellers aggressions are plotted in a form of Histogram. Additionally,
FREE
Created by an expert in algorithmic trading, it helps you spot and make the best market moves. Amazing Wise uses a mix of Stockhastik, MA, a Japonnaie chadelier filter and an AI that enables it to trade economic announcements and a Grid overlay to take the stress and emotion out of trading. You can also add a Stop Loss if you need it. Recommended pairs: GBPAUD, USDCAD, EURUSD, AUDUSD, EURGBP and AUDCAD Timeframe depends on the type of risk you wish to use. Recommended M15 High risk, M30 M
Vwap RSJ
JETINVEST
4.93 (14)
VWAP RSJ is an indicator that plots the Hourly, Daily, Weekly and Monthly  VWAP Lines. Large institutional buyers and   mutual funds   use the VWAP ratio to help move into or out of stocks with as small of a market impact as possible. Therefore, when possible, institutions will try to buy below the VWAP, or sell above it. This way their actions push the price back toward the average, instead of away from it. Based on this information I developed this indicator that combines 4 types of VWAP T
FREE
Индикатор строит текущие котировки, которые можно сравнить с историческими и на этом основании сделать прогноз ценового движения. Индикатор имеет текстовое поле для быстрой навигации к нужной дате. Параметры : Symbol - выбор символа, который будет отображать индикатор; SymbolPeriod - выбор периода, с которого индикатор будет брать данные; IndicatorColor - цвет индикатора; Inverse - true переворачивает котировки, false - исходный вид; Далее идут настройки текстового поля, в которое можн
Sasi22
Salvatore Pecchia
Turn Stock Manager into Your New Business Opportunity – You can sell Stock Manager to your customers as a service by selling License. – The Licenses is managed in a Web Admin dashboard. – Highly flexibility structure that allows customers to host their database in Cloud or Self-hosted. – Admin/Staffs can create unlimited number of license for selling. please test me now
Session Control индикатор сессий. В зависимости от того, с какого континента в определённый период происходит активность торгов, и подразделяют весь дневной распорядок на несколько торговых сессий. За счет того, что в каждый отдельный промежуток времени к торговому процессу подключаются биржевые и банковские площадки с разных уголков планеты и заключается круглосуточное функционирование рынка Форекс.  Существует 4 основных торговых сессий:  Тихоокеанская. Европейская. Американская. Азиатс
FRB Trader - Our mission is to provide the best support to customers through conted and tools so that they can achieve the expected results FRB Support and Resistance - Indicator places lines on the chart to show Support and Resistance regions. - You can choose the timeframe you want to calculate, as well as the colors of the lines. - Algorithm calculates the points where the strengths of the asset are considered and are extremely important for decision making.
FREE
Представляем RSIScalperPro - революционный индикатор на основе RSI для MetaTrader 5, специально разработанный для скальпинга на графике одной минуты. С RSIScalperPro у вас будет мощный инструментарий для точных сигналов входа и выхода, чтобы повысить вашу торговую эффективность. RSIScalperPro использует два различных индикатора RSI, которые предоставляют четкие сигналы для уровней перекупленности и перепроданности. Вы можете настроить временные периоды и ограничительные значения двух RSI в соот
Tick Database — экспорт тиковой базы из терминала MT5 в MT4. Утилита помогает получить доступ к тиковой базе в реальном времени. Это нужно для генерации синтетических графиков в терминале MT4, в котором изначально не предусмотрена загрузка тиковой базы. Например, можно организовать постоянный доступ к тиковой базе для утилиты " Seconds Chart ", которая в терминале МТ4 помогает строить секундные графики.
FREE
Here we have the Start Midas Fibo Bands , I confess that it is an indicator that excited me enough to operate because I was able to find more defined rules. Well, the indicator has the functions of the other indicators of the Start line , which is a possibility to plot several Midas on the screen, you can move the anchor point using keyboard shortcuts and use the legend to differentiate one anchor from another. The rules that I have analyzed for my possible setup are recommended to the entry, st
VWAP Indicator MT5
Kyra Nickaline Watson-gordon
Description : VWAP (Volume-Weighted Average Price) is the ratio of the value traded to total volume traded over a particular time horizon. It is a measure of the average price at which pair is traded over the trading horizon. Read More. All Symbols and All Timeframes are supported. Indicator Inputs :     VWAP Mode : Mode of VWAP Calculation. Options can be selected : Single,Session,Daily,Weekly,Monthly     Volumes : Real Volumes,Tick Volumes     Price Type : Used price for cal
MW Volume
Martin Bittencourt
4 (5)
The Martinware Volume indicator plots a colored moving average over volume bars. The coloring uses three colors and can be done in different ways choosable by the user and is applied both to the average as to the volume bars. Three types of coloring are possible: None: no coloring is done Increasing or decreasing: changes the color depending on the current value being bigger or lesser than the previous one Volume relative to average: colors vary if the current volume is bigger or lesser then
FREE
УР VolumeTrend   UR VolumeTrend — самый четкий индикатор объема, показывающий продолжающийся тренд с точки зрения объема. Отлично работает с другими индикаторами, такими как UR TrendExhaustion, чтобы сигнализировать о локальных максимумах и минимумах. Ограничено всего двумя параметрами — чем выше значения, тем дольше будут отображаться тренды. Экстремумы градиента показывают возможное истощение объема, чтобы поймать потенциальный разворот. Две линии - Тренд объема и Среднее значение. Лучшее
Индикатор горизонтальных объемов ( Horizontal Volumes ) - отражает с помощью гистограммы, объем заключенных сделок по определенной цене без привязки за временем. При этом гистограмма появляется непосредственно в окне терминала, а каждый столбик объема легко сопоставить со значением котировки валютной пары. Индикатор практически не требует изменения настроек, а при желании с ними может разобраться любой трейдер. Объемы заключенных сделок имеют большое значение в биржевой торговле, обычно увели
VWAP and MVWAP
Flavio Javier Jarabeck
4.17 (6)
Volume Weighted Average Price (VWAP) is a trading benchmark commonly used by Big Players that gives the average price a Symbol has traded throughout the day. It is based on both Volume and price. Additionally we put in this indicator the MVWAP (Moving Volume Weighted Average Price). For those who do not know the usage and the importance od this indicator I recommend a great article about this subject at Investopedia ( https://www.investopedia.com/articles/trading/11/trading-with-vwap-mvwap.asp )
FREE
Volume Weighted Average Price or VWAP is an indicator wich shows different average prices on chart. This is very useful to find strong negotiation price areas and as trend following. Configurations: Day, Week and Month - Show different VWAPs according to the period. You can change each line style on "colors" tab. Any doubt or suggestion please contact us. Enjoy! This is a free indicator, but it took hours to develop. If you want to pay me a coffee, I appreciate a lot   <3 PayPal, Skrill, Ne
FREE
New to Binary Options Trading? You are not able to win while trading binary options? Need help with your trading? You have come to the right place! This indicator provides Put (SELL) and Call (BUY) signals for binary options on the M1-M15 timeframes. Advantages Ability to easily recognize impulsive moves. Effective and flexible combination to different trading strategies. Advanced statistics calculation following the entry point. Signals strictly on the close of a bar. Works in all symbols and
Простейший индикатор для ручной торговли. Для комфортной торговли так же имеется эксперт https://www.mql5.com/ru/market/product/41133 Суть идикатора: уровни строяться на основе Moving Average с выбранным периодом по ценам High и Low. На разнице между High и Low строятся следующие уровни выше и ниже. В случае если бар не выходит за уровни, помечается зеленой меткой. Данную метку и уровни можно использовать для выставления отложенных ордеров когда цена на долго застревает между уровнями. Входны
FREE
BoxProfile MT5
Evgeny Shevtsov
4.56 (9)
Индикатор отображает профили объёма по принципу вложенности. Периоды профилей предустановлены так, что каждый последующий профиль имеет протяжённость вдвое большую, чем протяжённость предыдущего профиля. Помимо профилей индикатор отображает кластеры объёма, отсортированные по цвету, в зависимости от содержащегося в них объёма. Особенности работы индикатора Индикатор работает на типовых таймфреймах от M5 до MN, но для вычислений использует исторические данные меньших таймфреймов: M1 - для тайм
FREE
The new update makes this indicator a complete tool for studying, analyzing and operating probabilistic patterns. It includes: On-chart Multi-asset percentage monitor. Configurable martingales. Twenty-one pre-configured patterns, including Mhi patterns and C3. An advanced pattern editor to store up to 5 custom patterns. Backtest mode to test results with loss reports. Trend filter. Hit operational filter. Martingale Cycles option. Various types of strategies and alerts. Confluence between patter
Tape Reading, flow monitoring. FabFlowInPrice   is a powerful indicator for those who like Tape Reading (Times & Trades). It presents the volumes traded at each price level, considering the purchase, sale and direct aggressions for each level. Excellent tool for market flow analysis. Thought of flow so monitor who is attacking the most, buyers, sellers or direct exchanges, thought FabFlowInPrice. The indicator displays information in 4 distinct and fixed periods, on any timeframe: @Day - All
Этот индикатор сделан на основе дискретного преобразования Хартли. Использование этого преобразования позволяет применять разные подходы при обработке финансовых временных рядов. Отличительная особенность этого индикатора - его показания относятся не к одной точке на графике, а ко всем точкам периода индикатора. При обработке временного ряда индикатор позволяет выделять различные элементы временного ряда. На этом подходе построен первая возможность фильтрации - просто отбрасываются все ненужные
John Bollinger's normalized MFI (Fund Flow Index). Bollinger bands are used to calculate overbought/oversold areas. It takes three input parameters: MFI period - MFI calculation period MFI Applied Volume - Calculates the volume of MFI transactions BB period - Calculation period of the Bollinger band BB deviation - Brin deviation Calculation: NormMFI = (MFI-BL) / (TL-BL) Among them: TL = BBands(MFI, BB period, BB deviation, UPPER_BAND) BL = BBands(MFI, BB period, BB deviation, LOWER_BAND) MFI - M
С этим продуктом покупают
IVISTscalp5
Vadym Zhukovskyi
5 (3)
Представляем вам индикатор iVISTscalp 5 , который не только уникален, но и эффективен в использовании при анализе торговых операциях. Этот индикатор основывается на временных данных и является результатом многолетнего опыта и глубокого анализа финансовых рынков. Индикатор iVISTscalp 5 отличный помощник для ручной торговли. Удобство, простота и визуализация. Все самое сложное спрятано внутри. Мы максимум упростили настройки и использование индикатора iVISTscalp 5 . Индикатор подходит для всех
note: this indicator is for METATRADER4, if you want the version for METATRADER5 this is the link:  https://www.mql5.com/it/market/product/108106 TRENDMAESTRO ver 2.4 TRENDMAESTRO recognizes a new TREND in the bud, he never makes mistakes. The certainty of identifying a new TREND is priceless. DESCRIPTION TRENDMAESTRO identifies a new TREND in the bud, this indicator examines the volatility, volumes and momentum to identify the moment in which there is an explosion of one or more of these data a
Indicador en MQL5, que obtiene el promedio de 10 EMAS, que son alineadas según Fibonacci, obteniendo un promedio, que sera suavizado.  Se puede ingresar un numero desde 2 a N, que multiplica a los EMA-Fibonacci. Funciona en cualquier criptomoneda, etc. etc... pudiendo calcular el futuro segun la tendencia de las EMAS. Funciona excelentemente en tramos largos, determinando exactamente el mejor inicio/salida. El precio inicial por apertura sera por un periodo de tiempo, luego aumentará.
TREND HARMONY MT5 – Multi Timeframe Trend and Phase and Pullback Level Visualizer indicator for Metatrader5 The TREND HARMONY indicator automates deep trend analysis and generates visualizations for you. Take control of your trades by eliminating uncertainty! Revolutionize your trading experience with precision and insight through the TREND HARMONY Multi Timeframe indicator – your ultimate MT5 trend visualization indicator. [  Features and Manual   | MT4 version |   All Products   ] Are you t
VTrende Pro
Andrii Diachenko
5 (1)
VTrende Pro - МТФ индикатор для трендовой торговли с панелью индикации для МТ5 !!! - Подробное описание на русском языке под видео (на Youtube) - !!! Хотя сигналы индикатора VTrende Pro можно использовать, как сигналы полноценной торговой системы, рекомендуется применять их в связке с ТС Билла Вильямса. VTrende Pro - это расширенная версия индикатора VTrende . Отличие Pro версии от VTrende: - Временные зоны - Сигнал V - сигнал 1-2 волн Основная задача индикатора - определить точки изм
RAD CRITICAL LEVES RAD indicator tracks “Relevant Volume” in real time, identifying accumulation and distribution processes, projecting them in the chart as SUPPORT or RESISTANCE zones. Natural   support   and resistance levels are generated by Volume Accumulation and Distribution processes. As these processes evolve, levels at which the relevant volume in the market place is positioned, become difficult areas to cross upwards or downwards. By using this information, traders can identify very s
Weis Wave with Alert MT5
Trade The Volume Waves Single Member P.C.
4.93 (15)
Rental/Lifetime Package Options and Privileges  * For optimum results the yearly or lifetime package is suggested due to live training ! Rent Monthly Six Months   Yearly/Lifetime Weis Wave with Speed with Alert+Speed Index x x x Manual  x x x Quick Set up Video x x x Blog x x x Lifetime Updates x x x Setup and Training Material x x Free Rectangle Break Alert Tool      x Discord Access Channel "The SI traders" x 2-hour live methodology training x How to trade with it:    http://
WanaScalper
Isaac Wanasolo
1 (1)
A scalping indicator based on mathematical patterns, which on average gives signals with relatively small SL, and also occasionally helps to catch big moves in the markets (more information in the video) This indicator has three main types of notifications: The first type warns of a possible/upcoming signal on the next bar The second type indicates the presence of a ready signal to enter the market/open a position The third type is for SL and TP levels - you will be notified every time price r
ИНДИКАТОР, основанный на ИСКУССТВЕННОМ ИНТЕЛЛЕКТЕ, который генерирует возможные записи колл- и пут-опционов для бинарных опционов. Индикатор работает по 3 разным стратегиям: 1) считывая объемы, он посылает сигнал, когда цена должна развернуться 2) через расхождение между ценой и объемом он посылает сигнал, когда тренд должен продолжиться или развернуться. 3) благодаря сближению цены и объема он посылает сигнал о том, что тренд должен продолжиться. Индикатор работает на всех таймфр
Индикатор предназначен для того, чтобы вовремя закрывать позиции по рынку. Например: досрочно фиксировать прибыль, если цена не достигла TakeProfit, а рынок разворачивается. Индикатор анализирует импульс, а не тренд. О тренде никакой информации он не дает. Индикатор хорошо подходит для поиска дивергенции. Индикатор Ershov 38 Parrots динамически подстраивается под рынок и выявляет импульсы движения цены средней и высокой амплитуды. На мелкие скачки цены почти не реагирует.  Принципиальное о
Технический индикатор Smooth Price (Гладкая цена) используется для построения гладкой линии максимально приближенной к цене торгового инструмента и служит для устранения ее шумовых составляющих. Индикатор является частью торговой системы Monarch, но здесь он представлен как самостоятельный инструмент технического анализа. Основой индикатора служит кластерный цифровой фильтр , который, в отличии от проекта ClusterSMA , применяется непосредственно к ценовой таймсерии. Smooth Price не перерисовывае
Классификатор силы тренда. Показания на истории не меняет. Изменяется классификация только незакрытого бара. По идее подобен полной системе ASCTrend, сигнальный модуль которой, точнее его аппроксимация в несколько "урезанном" виде, есть в свободном доступе, а также в терминале как сигнальный индикатор SilverTrend . Точной копией системы ASCTrend не является. Работает на всех инструментах и всех временных диапазонах. Индикатор использует несколько некоррелируемых между собой алгоритмов для класси
Currency Index Watcher - это простой инструмент для тех, кто хочет торговать на рынке Форекс, используя индексы валют . После завершения расчетов показываются конкретные торговые возможности , и подаются сигналы по ним. Currency Index Watcher можно настроить непосредственно с панели управления : Индексы 8 валют: EUR, USD, GBP, JPY, CHF, AUD, CAD, NZD с возможностью выбирать для анализа индексы и синтетические пары. Выбор возможностей осуществляется в соответствии со следующими критериями: Minima
SmartTrendMt5 - индикатор тренда и торговых сигналов, основанный на принципе совмещенного анализа расчетных опорных точек внутри канала Келтнера. Индикатор формирует в отдельном окне канал Келтнера (по умолчанию линии красного цвета и линия синего цвета - середина канала), а также гистограмму расчетных опорных точек для каждой свечи (по умолчанию столбцы гистограммы желтого цвета). Индикатор устанавливается обычным образом на любой торговый символ с любым временным интервалом. Преимущества инд
Premium level - это уникальный индикатор с точностью правильных прогнозов  более 80%!  Данный индикатор тестировался более двух месяцев лучшими Специалистами в области Трейдинга!  Индикатор авторский такого вы больше не где не найдете!  По скриншотах можете сами увидеть точностью данного инструмента!  1 отлично подходит для торговли бинарными опционами со временем экспирации на 1 свечу. 2 работает на всех валютных парах, акциях, сырье, криптовалютах Инструкция: Как только появляется красная стре
Indicador en base a la pendiente de la linea de precio, dibuja una línea de color cuando sube a base de los precios que previamente has sido procesados o linealizados, y cuando baja la pendiente la linea linealizada toma otro color. En este caso se a considerado 6 lineas de diferentes procesos desde pendientes largas hacia las cortas, observándose que cuando coincidan las pendientes se produce un máximo o mínimo, lo que a simple vista nos permitirá hacer una COMPRA O VENTA.
Ищете мощный индикатор для торговли на рынке Форекс, который поможет вам с легкостью определить прибыльные торговые возможности? Не ищите ничего, кроме Beast Super Signal. Этот простой в использовании индикатор, основанный на тренде, постоянно отслеживает рыночные условия, ищет новые развивающиеся тренды или отслеживает уже существующие. Beast Super Signal дает сигнал на покупку или продажу, когда все внутренние стратегии совпадают и на 100% совпадают друг с другом, что устраняет необходимость
Индикатор Coefficient Of Determination (COD) представляет собой значение коэффициента детерминации или квадрат коэффициента корреляции между зависимой переменной — ценой и объясняющей переменной — тиковым объемом. Что это дает нам на практике? COD отлично распознает кульминацию трендовых движений, что позволяет подбирать оптимальные точки и ловить развороты рынка. Как использовать индикатор: Наиболее популярная торговая стратегия строится совместно с трендовым индикатором Moving Average (MA), пе
Fibonacci Múltiple 12, utiliza la serie fibonacci plasmado en el indicador fibonacci, aumentadolo 12 veces según su secuencia. El indicador fibonacci normalmente muestra una vez, el presente indicador se mostrara 12 veces empezando el numero que le indique siguiendo la secuencia. Se puede utilizar para ver la tendencia en periodos cortos y largos, de minutos a meses, solo aumentado el numero MULTIPLICA.
Recommended TimeFrame >= H1. 100% Non Repainted at any moment.  Use it carefully, only with Trend Direction. Trading Usage: 2 Variants: as Range System or as BreakOut System (Both Only With Trend Direction)::: (Always use StopLoss for minimise Risk); [1] as Range System: (Recommended) in UP TREND:  - BUY in Blue Line , then if price goes down by 50 points (on H1) open Second BUY.   Close in any Profit you wish: TrailingStop(45 points) or Close when Price touches upper Gold Line. in DOWN TR
En base a cálculos matemáticos de determino una linea Horizontal que cruza a todas las señales de trading, mostrando los máximos y mínimos. La linea horizontal parte en dos las subidas y bajadas de las señales de trading, de tan manera que es fácil identificar los máximos y mínimos, y es inteligente por que es sensible a las subidas y bajadas, afín de no quedarse en un solo lado por siempre, trabaja excelentemente con otros indicadores suavizadores ya que les garantiza que en un intervalo de tie
этот индикатор является индикатором детектора спайков, он специально разработан для обмена на Boom 1000, Boom 500, Crash 1000 и Crash 500 Мы рекомендуем использовать его только для индексов Deriv Boom и Crash. Его настройки интуитивно понятны, знакомы, просты в использовании имеет функции уведомления; звуковые уведомления и push-уведомления. этот инструмент прост в использовании, прост в обращении Это обновление основано на разных стратегиях для шипов.
Limitless MT5  - это универсальный индикатор который подойдет каждому как начинающему так и опытному трейдеру работает на всех валютных парах криптовалютах сыре акциях Limitless MT5 - уже настроен и не требует дополнительной настройки   А теперь главное Почему  Limitless MT5 ? 1 полное отсутствие перерисовки  2 два года тестирования лучшими специалистами в трейдинге 3 точность правильных сигналов превышает 80% 4 хорошо показал себя в торговле во время выхода новостей Правила торговли  1 сигнал н
Indicador en MQL5, recibe la información del precio SUAVIZADO, lo procesa anulando los picos inteligentemente, y el resultado lo envía al desarrollo de la escalera que iniciara y subirá o bajara según el peldaño o INTERVALO ingresado Ingreso PERIODO = 50 (variar segun uso) Ingreso MULTIPLICA AL PERIODO = 1 (variar segun uso) Segun la configuración la escalera puede pegarse o separarse de los precios,, Se aplica toda la linea de tiempo, y a todas las divisas, etc.  
Micro  ******************* Секундные графики MT5 ********************** Более точного инструмента для входа в сделку вы не найдёте. Входные параметры: Timeframe, sek - период построения графика, секунды Displayed bars - отображаемые бары Step of price levels, pp, 0-off - шаг отрисовки ценовых уровней, пункты Scale points per bar, 0-off - масштаб в пунктах на бар Show lines - отображение текущих уровней Show comment - отображение комментария Standard color scheme - стандартная цветовая сх
QuantXMarketScanner is a multi assets indicator for MT5 - Mathematical model based on 7 custom moving averages indicators  - Adaptable on Currencies, Stocks and Crypto - Automatic setup, self optimized About QuantXsystem Products: –         Simple installation & integration into MT5   –         Unlimited License after purchase (for one user) –         Automatic pattern recognition to identify the best timing and price levels. –         Trading indicators are displayed directly and automatica
QuantXSTocks Trading Range Indicator for MT5: INSTRUCTIONS TO USE OUR INDICATOR:- User needs to take trade on Arrow or after an Arrow CandleStick, You can achieve up-to 35-125 pips target by this Indicator. Best Timeframes for Stocks and Indices are M30 and H1: AMAZON M30 (50 pips) TESLA M30 (50 pips) APPLE M30 (50 pips) ADOBE M30 (50 pips) NASDAQ100 H1 (125 pips) The above are the approximate amount of pips you can achieve by this Indicator, Green arrow appears to be buy arrow while the Red a
Super Suavizador
Cesar Juan Flores Navarro
Indicador en MQL5 que obtiene el promedio de 10 EMAS que son alineadas y procesadas según Fibonacci luego el promedio es suavizado"  Se ingresa un número de 2 a N que multiplica los EMA-Fibonacci y por consiguiente aumenta los fibonacci, resultando un promedio.   Se ingresa un número que suaviza los EMA-Fibonacci. Considerando los números 1/1 seria la suavización minima. Considerando los números 3/5 seria la suavización media. Considerando los números 10/30 seria la suavización alta.....etc
Trend and Signals MT5  indicator scans  30 trading Instruments (Forex, Metals and Indices).     It uses special algorithm on the  current market   based on   Pure Price Action   and display the overall trend and signal on the dashboard. When signals are produced the indicator sends alert and notification. Strategy for Signals This indicator uses the daily timeframe to determine the direction of the trend. The hourly timeframe is used to identify possible entries. Main trend and is determined by
This indicator is based on a mathematical formula and an ANN combined, designed to make a model(using previous prices) of the most recent market condition (any chart*) in order to use the model as a forecasting tool. *This indicator can operate on any chart/timeframe, but it's suggested you use multiple timeframes for each trade because this method relies solely on the time factor, you can not use this indicator to predict price volatility, but if it's fit correctly it will show you when the nex
Другие продукты этого автора
Доброго времени суток! Представляю вам торговый технический индикатор для синтетических индексов брокера Deriv. Данный индикатор работает ТОЛЬКО с нижеуказанными индексами: Boom 300 Index Boom 500 Index Boom 1000 Index Crash 300 Index Crash 500 Index Crash 1000 Index Индикатор создан для подачи сигналов на открытие среднесрочных сделок в сторону Спайков. Но вы можете открывать сделки и в противоположную Спайкам сторону, на свой риск. Торговля только на М1. Другие ТФ не гарантируют корректную р
Доброго времени! Представляю вам информационную панель для подключения стрелочных индикаторов. Панель создавалась в помощь в торговле на Бинарных опционах. Но может использоваться на любых типах торговли.  Принцип работы Панель является информационной и переключателем между графиками. Панель считывает значения указанного вами индикатора имеющего свои буфера. В идеале стрелочные индикаторы. Панель отображает заданные торговые символы в разных указанных вами таймфреймах.  При появлении сигнала,
Доброго времени, коллеги! После покупки, напишите мне в личные сообщения чтобы я добавил вас в приватный чат и телеграм канал для общения по теме с другими участниками. Представляю вам советник для синтетического индекса Boom 500 Index предоставленный брокером Deriv. Это скальпирующий хеджевый советник. Актуальные конфиги Особенности советника: Работает на М1 таймфрейме не зависимо от того таймфрейма на котором вы установили советник Содержит настройки позволяющие провести оптимизацию и подобр
Фильтр:
Christian Rodas
28
Christian Rodas 2024.01.03 22:30 
 

As described, easy to use and very complete

Petr Zharuk
1546
Ответ разработчика Petr Zharuk 2024.01.03 23:43
Enjoy your use and decent performance.
Ответ на отзыв
Версия 1.6 2023.12.16
-Исправлен баг с отсутствием уведомлений
Версия 1.5 2023.12.02
-Оптимизирована логика точек входа
-Добавлен индикатор тренда внизу экрана с индикацией силы тренда
-Добавлен авторский индикатор Объемов реакций
-Добавлены настройки для новых функций
-Добавлены индикаторы предыдущего максимума и минимума цены
-Оптимизация кода и графики
Версия 1.4 2023.10.26
-Радикальное обновление улучшающее качество и кол-во сигналов. Сигналы теперь преимущественно подаются по тренду в сторону спайков.
Версия 1.3 2023.10.23
-Фикс счетчика профита
Версия 1.2 2023.10.23
-Добавил цвета на счетчик профита открытых позиций.
Версия 1.1 2023.10.23
-Добавил счетчик профита открытых позиций. Настраиваемый.
-Улучшил качество сигналов на режиме Очень точный.