Смотри обучающее видео по маркету на YouTube
Как купить торгового робота или индикатор
Запусти робота на
виртуальном хостинге
виртуальном хостинге
Протестируй индикатор/робота перед покупкой
Хочешь зарабатывать в Маркете?
Как подать продукт, чтобы его покупали
Технические индикаторы для MetaTrader 4 - 123

Этот индикатор подходит для торгов на паре и еще много других. Также имееться интерактивная панель для быстрой смены настроек. Сам индикатор использует универсальные расчеты дополнительной точности, но пока они оптимизированы под некоторые валютные пары. Множество настроек можно настраивать на главном меню . Свои расчеты он отображает на графике в ввиде значков. Значки бывают двух видов.В тестере работает отлично по умолчанию в настройках. Можно указать цвет для его значков. Удачных торгов.

Стрелочный Форекс индикатор - это незаменимый инструмент для успешного скальпинга на валютном рынке. С его помощью трейдеры могут легко определить моменты, когда стоит открывать позицию на покупку или продажу, и таким образом получать прибыль, не теряя времени на анализ графиков. Красная и синяя стрелки индикатора, своего рода светофор, являются визуальными инструментами, которые позволяют с легкостью определять направление тренда. Красная стрелка сигнализирует о возможности открытия короткой п
KT Day Trading MT4 provides simplified Buy and Sell signals using a combination of some specific candlestick patterns occurring in the market exhaustion zones.
These signals are designed to identify market reversals and entry/exit points. The indicator can be used to trade on any timeframe from the 1 Minute up to the Daily chart.
Features
Three types of entry signals according to the market structure i.e. Trend following, Range bound, and Counter trend signals. Crystal clear Entry, Stop-L
NATR - это нормализованная версия индикатора ATR Используется для измерения уровня волатильности в % от обшей волатильности инструмента, а не в пунктах как обычный ATR
Например NATR с периодом 10 будет показывать средний размер свечи в % за 10 последних свечей или сколько процентов в среднем проходит инструмент за 1 свечу Это позволяет привести значения любых любых исследуемых инструментов к единому знаменателю Имеет простую и понятную настройку Наглядно показывает периоды всплеска волатильн
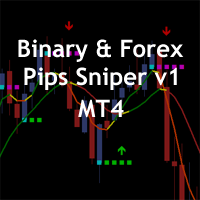
The Binary & Forex Pips Sniper MT4 indicator is based on technical analysis of two moving average and the slope of the slow moving average. The moving average helps to level the price data over a specified period by creating a constantly updated average price. Upward momentum is confirmed with a bullish crossover "Arrow UP", which occurs when a short-term moving average crosses above a longer-term moving average. Conversely, downward momentum is confirmed with a bearish crossover "Arrow Down", w

"AV Stop Hunter" is an indicator for MetaTrader 4, which draws entry arrows for long and short after so-called Stop Hunt candles and has several notifications about them. Since this is a smart money concept , the periods H1 and H4 are the best. Increasing volume improves the signal, lines and arrows are then thicker. The MQL5 variant has colored stop-hunting candles.
Definition :
Stop hunting, also known as stop running, is the practice of institutional traders (smart money) of driving t
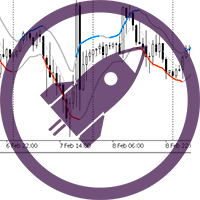
"Scalper Channel MT4" это современный канальный индикатор, показывающий трейдеру направление торговли. Для работы индикатор использует встроенные и собственные технические средства и новую секретную формулу. Загрузите его на график и индикатор цветом покажет вам направление входа: Если верхняя граница ценового канала индикатора синего цвета - открывайте позицию на покупку. Если нижняя граница ценового канала индикатора красного цвета - открывайте позицию на продажу. Если граница индикатора серог
Symbol Syncyro Swich - это утилита которая позволяет переключать одновременно торговый символ сразу на нескольких графиках. Если вы используете несколько графиков одного символа с разными таймфреймами для анализа и хотите сменить символ торгового инструмента,
то эта утилита как раз для Вас!!!
Одним нажатием на кнопку с надписью торгового символа Вы легко его поменяете с помощью данной утилиты.
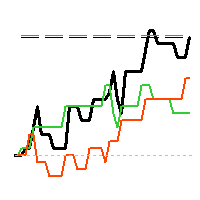
"AV Monitor" is an indicator for MetaTrader 4, which alowes a history analysis of the closed orders. It helps to achieve a quick visual analysis of your own trading or different expert advisors among themselves. Compare and analyze your expert advisors: Which one is the best?
I use an "AV Monitor MT5" indicator per running expert advisor chart to track its performance split into long & short, as well as an index chart e.g. DOW with this indicator and the setting "Show Balance & Equity" to tra

If you are a market operator looking for an advanced solution to identify trends and trend reversals in financial markets, the Weiss Wave indicator could be what you need. Based on the principle of Elliott wave analysis and combining multiple indicators, the indicator provides a comprehensive view of the market in an easy and intuitive way, even for less experienced traders. With clear and easy-to-interpret buy/sell signals, the indicator provides reliable guidance for identifying trends and tre

In case you get Laguerre S crat indicator, you will get Laguerre Scrat Ea as a Gift. To get Ea and det a iled m anu al PDF contact me PM. Default settings are for usd/cad H4 For St able Long term Profits Laguerre Scrat is a trading system based on 4 indicator combinations in the shape of one indicator. Laguerre indicator (upgraded), CCI, Bollinger bands and market volatility factor. It generates arrows in the indicator window and nuts on the price chart, doubling arrows for a better view where

if you want to put your "SL" in a safe place you should see the place of "SL" before opening the Order with this indicator no need to measure your "SL" on the chart many times please watch the video of this indicator:
you can change the style of this indicator: width, color, length, Time Frame, distance
if you need more info & video message me if you wanna see the video you should send me message Telegram ID: @forex_ex4 i also have other experts and indicators that will greatly improve your
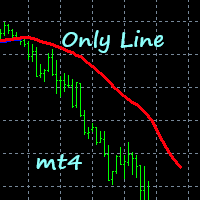
Use this indicator to help determine when to open buys or sells based on the color of the line. Excellent for scalping. Settings: Deviation. TrendPeriod.
Features Alerts. How to use: Simply attach to any chart with default settings. When used on lower timeframes (M1,M5,M30,H1), confirm on higher timeframes. Buy: Blue line below price. Best results when line is blue on multiple timeframes. Sell: Red line above price.
Best results when line is red on multiple timeframes.
Or change settin
RumahForexID Momentum Scalping Indicator is the best momentum indicator ever created, and why is that? The indicator works on all timeframes and assets, the indicator is made after 6 years of experience in forex. You know many momentum indicators on the internet are unhelpful, and difficult to trade, but RumahForexID Momentum Scalping Indicator is different , The indicator shows wave momentum, when the market is about to trend or consolidate, all that in one simple and clear indicator!
Ruma

Pinpoint Pro Indicator is a multi-time frames indicator, which uses more than five built-in MT4&MT5 indicator to generate trading signals. This indicator can perform several functions, such as: Send signals notification to mobile phone Gives precise signal entry upon following signal checklist points Can be used in all market such as currency pairs, stock market, metals, commodity, synthetic pairs and cryptocurrency pairs One built-in indicator can be used for signal verification before enterin

This indicator uses a special algorithm to plot the 4 lines for trading. Great for scalping. Does not feature any alerts and is best used manually after confirming the line displays. No need to set up the indicator. How to use: Attach to any chart. Can be used on any time frame. If used on lower time frames, check higher time frames for confirmation. Buy : - Wait for green and white lines to be above the level 50 dotted line, then open buys. - Buy when the green line crosses below the white line

Extreme Price Meter
На основе исторической рыночной информации индикатор рассчитывает, каким будет следующий ценовой экстремум с высокой вероятностью разворота. Он генерирует 2 ценовых диапазона, где высока вероятность покупки или продажи. Легко убедиться в высокой точности индикатора, учитывая стрелки, которые он выставляет, когда свеча закрывается за пределами полос вероятности. Уведомления для рабочего стола, телефона и электронной почты.
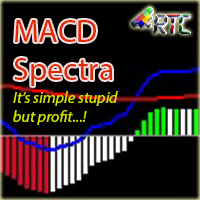
MACD Spectra - простой, но прибыльный индикатор для торговли! Этот индикатор может использоваться на всех временных интервалах и валютных парах. С точностью более 90%, этот индикатор идеально подходит как для новичков, так и для профессиональных трейдеров, которые ищут лучший индикатор для помощи своей торговой деятельности. Просто следуйте за цветом гистограммы, положением гистограммы и положением линий Signal и MACD, чтобы легко входить и выходить с рынка. Не ждите больше, давайте получать ста

Fibonacci retracement is an object or function that is often used by traders to determine values of fibonacci levels. When to open position, where is the breakout or limit point, stop loss position and take profit position can be determined based on fibonacci levels. But commonly, this object only can be used manually in Metatrader 4 (MT4). Therefore we need an indicator of fibonacci retracement. The use of indicator will make decision making easier, faster, and more consistence. We recommend t
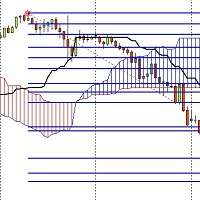
I have developed an indicator based on both the fibo musang strategy and the price breaking of the ichimoku cloud and it has amazing results
the features are:
1- Once activated it give you the trend where you are from the chart
2- After a trend change it gives you an alert on PC or notification on your phone if you are away.
3- It sends you the exact prices to take an order and 3 take profit levels and your stoploss.
4- It works on every timeframes from 1m to MN.
5- It works on pairs
Check My Product
Contact me to discover all my services
Pivot indicator is a tool used by many traders. It can be used by beginners and experts alike and allows you to identify support and resistance levels. Pivot indicator is a widely used tool because over the years it has shown the validity of the levels it calculates and can be easily integrated into your trading strategy. Pivot levels can be used on different timeframes and based on the chosen time duration, calculate levels using dail
Really simple tool that can be attached to any graph to keep an eye on the account status. It run as an indicator but actually is just a simple monitor. There are three sections: -account market status : infos about global open orders profit/loss, margin required, market status, etc. -account info: simple infos but good for setting lots amount, knowing contract size, server id, etc. -time data: in order not to get mad on time shifts, you have some info about local, broker, GMT time, plus winter/

This is an arrow formed by strong reversal candlesticks it is used on muti time frame or m15 and above for gold and h1 and above for currency pairs (can be used at m5 after strong volatile news) This indicator is 100% non-repain and non-repoint Have a success probability of bringing in more than 90% profit Your stop loss when entering your order is behind the arrow and will be very low it will only be 20 pips or 30 pips at m15 (note in larger timeframes it may be longer) How To USE When the
The "Stochastic Multi Period Buy Sell Alert" is a powerful technical indicator designed to analyze price momentum and trend strength across multiple timeframes. This indicator is a valuable tool for traders looking to identify profitable trading opportunities. With the indicator, you can monitor price movements in three different timeframes, namely M15, M30, and H1. The indicator calculates the Stochastic K value for each timeframe and determines whether the price is in an oversold or overbought

ИНДИКАТОР ЛИНЕЙНОЙ РЕГРЕССИИ Индикатор представляет собой Линию Линейной Регрессии и линии поддержки и сопротивления, полученные на основе стандартного отклонения относительно Линейной Регрессии. Настраиваемые параметры:: Rango Tendencia: количество баров или периодов, рассматриваемых в качестве ссылки для индикатора.. AmpDesv: амплитуда или количество раз, учитываемых стандартным отклонением линейной регрессии для ее представления. Colores: возможность выбора цветов из палитры для представлени
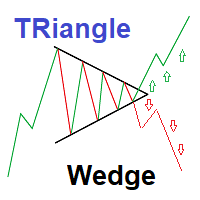
Strategy set to trade Triangle wedge break
This is a simple very effective strategy based on detecting and showing triangle wedges formation Strategy set to trade Triangle wedge break Red Arrows appears on crossing triangle down Green Arrows appears on crossing triangle Up You can also trade lower and upper triangle limit :(new version may be released to allow arrows for side ways trading) ---Sell on price declines from High triangle Level - Buy on increasing from Lower triangle level 2 inpu

Indicator customers will get Ea based on Fiter indicator for free as a Bonus. (watch video to see Ea in action) Fiter is EMA+ATR*RSI hibrid yellow line combined with Moving average red line, cross of which gives much smoother results than two simple Ma cross usage in trading. Effectiveness is proven by backtest and comparison with two simple Ma crosses. History shows that this method Fits with different market conditions and it can be boldly used in real manual trading for determining big trend

MT5 Version Order Blocks ICT Kill Zones SMT Divergences ICT Breakers
The ICT Breakers indicator is a powerful tool for traders looking to gain an edge in the market. This indicator is based on the order flow and volume analysis, which allows traders to see the buying and selling pressure behind the price action. This information can be extremely valuable in identifying key levels of support and resistance, as well as potential turning points in the market. Breaker blocks are areas where i

Осциллятор Чайкина ( Chaikin Oscillator ) — это индикатор импульса, созданный Марком Чайкиным , и, очевидно, индикатор назван в честь своего создателя. Он измеряет импульс линии распределения и накопления, используя формулу схождения-расхождения скользящих средних (MACD). На основе данных об этом импульсе мы можем получить представление о направленных изменениях в линии распределения и накопления.

This indicator is a supporting tool which helps you draw/update any chart object once. The additions or changes are automatically synchronized to all linked chart windows of the same instrument. Setup is simple. Open all required charts you want to work on, attach the indicator to each chart window and start using it.
Its only allowed to attach one indicator to each chart. Once attached, you can draw on any chart (as long as it has this tool attached as indicator) and the drawing will show up

This indicator was constructed using decision trees. I will only give a few insights into the algorithm since it is original. But there are 4 trees in the inputs and by default they are 10. The decision tree logic for buy signals is as follows: If the MACD line is less than certain bullish divergence (determined by the "BUY_TREE_1" and "BUY_TREE_2" variables) The decision tree logic for sell signals is as follows: If the MACD line is greater than certain bearish divergence (determined by the
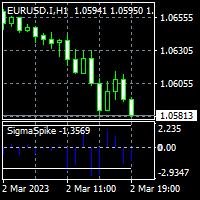
To get access to MT5 version please click here . - This is the exact conversion from TradingView: "SigmaSpikes(R) per Adam H. Grimes" by "irdoj75" - This is a light-load processing and non-repaint indicator. - All input options are available. - Buffers are available for processing in EAs. - You can message in private chat for further changes you need. Thanks for downloading
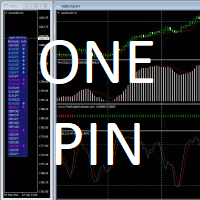
Transform indicators into trading signals JagzFX OnePin Basic allows a wide range of MT4 Custom Indicators to be transformed into multi-symbol trading signals without the need to write any code. You can use OnePin to create 'At A Glance' dashboards showing your preferred technical indicators and even send buy/sell signals to a PIN compatible dashboard just as JagzFX pinTrader. Whilst I have tried to limit the amount of technical jargon needed to use this PIN, there are a few terms that might nee

The Multi Channel Trend indicator was developed to help you determine the trend direction by drawing channels on the graphical screen. It draws all channels that can be trending autonomously. It helps you determine the direction of your trend. This indicator makes it easy for you to implement your strategies. The indicator has Down trend lines and Up trend lines. You can determine the price direction according to the multiplicity of the trend lines. For example , if the Down trend lines start to

The Hero Line Trend indicator was developed to help you determine the trend direction by drawing channels on the graphical screen. It draws all channels that can be trending autonomously. It helps you determine the direction of your trend. This indicator makes it easy for you to implement your strategies. The indicator has Down trend lines and Up trend lines. You can determine the price direction according to the multiplicity of the trend lines. For example , if the Down trend lines start to

Технический индикатор "Reversal patterns" является математической интерпретацией классических разворотных паттернов: Pin Bar, Harami и Engulfing. То есть «Разворотного бара», «Харами» и «Поглощения». Данный индикатор позволяет определить момент разворота котировок на основе рыночной динамики и победителя между «быками» и «медведями». Индикатор отображает момент разворота на локальных максимумах и минимумах графика любого таймфрейма, что позволяет повысить точность сигнала. Также индикатор имеет
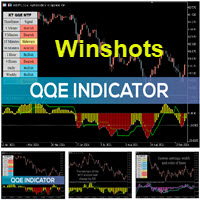
The Qualitative Quantitative Estimation (QQE) indicator is a technical analysis tool developed for the MetaTrader 4 (MT4) trading platform. It is designed to help traders identify potential trend reversals and to determine the strength of a current trend. The QQE indicator is calculated based on the Relative Strength Index (RSI) and Moving Average (MA) indicators. The RSI is used to determine the momentum of price movements, while the MA is used to smooth out the price data and identify trends.
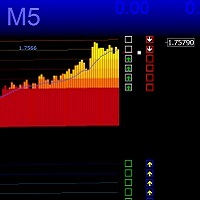
Канал TMA формирует расчёт зеркальным методом, что позволяет плавно компенсировать пробойные удары и точнее определять разворот, канал имеет дополнительную защиту от сужения, канал имеет ускоритель направляющей с заданными настройками, сигналы появляются на возврате направляющей линии, Версия MTF 2023 позволяет индивидуально настраивать канал на другие временные рамки и разные инструменты, возможны доработки, рекомендуется Gold M1 M5
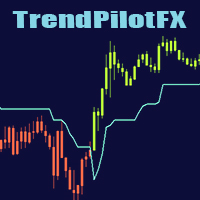
This Mql4 indicator smooths the trend by changing candle colors without altering their size, allowing for better price action reading. It also includes a trend line for trade entry and exit points. Smooth out market trends and improve your price action reading with this powerful Mql4 indicator. Unlike Heikin Ashi, this indicator changes candle colors without altering their size, providing you with a clearer picture of market movements. In addition, it includes a trend line that traders can rely

The product Divergence Macd Obv Rvi Ao Rsi is designed to find the differences between indicators and price. It allows you to open orders or set trends using these differences. The indicator has 4 different divergence features. To View Our Other Products Go to the link: Other Products
Divergence types Class A Divergence Class B Divergence Class C Divergence Hidden Divergence
Product Features and Rec ommendations There are 5 indicators on the indicator Indicators = Macd Obv Rvi Ao Rsi 4 dif
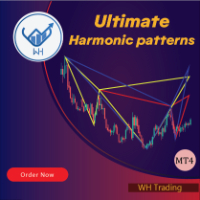
Добро пожаловать в индикатор распознавания Ultimate Harmonic Patterns Паттерн Гартли, паттерн Летучая мышь и паттерн Сайфер — популярные инструменты технического анализа, используемые трейдерами для определения потенциальных точек разворота на рынке.
Наш индикатор распознавания Ultimate Harmonic Patterns — это мощный инструмент, использующий передовые алгоритмы для сканирования рынков и выявления этих моделей в режиме реального времени.
С нашим индикатором распознавания Ultimate Harmonic Pat
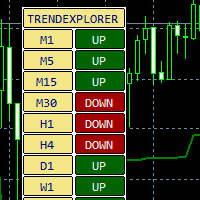
Индикатор направления тенденции торгового инструмента на разных таймфреймах. Используется авторская методика вычисления тенденции. Можно включать и отключать разные таймфреймы. Подходит для работы с валютными парами, акциями, фьючерсами, криптовалютами. Настройки:
ATR Multiplier - Множитель ATR; ATR Period - Период индикатора ATR; ATR Max Bars (Max 10.000) - Количество баров для расчета; Candle shift to Calculate - Бар начала отчета; On/Off Timeframe M1 - Включение разных таймфреймов; On/Off

"Price reversal arrows" Forex индикатор, который показывает на часовом графике (PERIOD_H1) стрелками точки разворота цены, является одним из наиболее популярных инструментов для трейдеров на рынке форекс. Этот индикатор используется для определения наиболее вероятных точек разворота цены, которые могут помочь трейдерам принимать более эффективные торговые решения. Индикатор "Price reversal arrows" работает на основе различных математических алгоритмов и формул, которые анализируют данные о пред

This Indicator will notified you when time to entry into the market, build with double william percent range strategy. --> Buy Notification will flag with the blue arrow --> Sell Notification will flag with the red arrow After Flag Appear, the market usually explode but carefully you must performs double check because weakness of this indicator when in the end of the trend

This Indicator will notified you when market going to trend reversal, build with candlestick pattern strategy
--> Sell Reversal Notification will flag with the Yellow arrow
--> Buy Reversal Notification will flag with the Pink arrow
After Flag Appear, the market usually reverse but carefully you must performs double check because weakness of this indicator when market in the middle of the trend
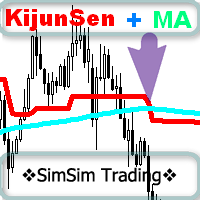
Очень простой но эффективный индикатор. A very simple but effective indicator.
В основе линия KijunSen индикатора Ichimoku и построенная средняя МА на этой линии. Сигнал на покупку или продажу: это точка пересечения двух линий!!!
Сам часто использую линию KijunSen индикатора Ichimoku для торговли, если цена ВЫШЕ рассматриваю только ПОКУПКИ, если НИЖЕ только ПРОДАЖИ.
А после усреднения линии KijunSen и формирования лини KijunSen МА, появились точки пересечения двух линий, которые можно ин

M1 GPT Scalping – это готовый торговый инструмент для стратегии скальпинга на финансовых рынках. Этот индикатор используется для обнаружения точек входа и выхода из позиций на графиках с периодом M1 (одна минута). M1 GPT Scalping работает на основе анализа ценовых данных и индикаторов технического анализа. Индикатор отображает стрелки на графике, отображающие точки входа и выхода из позиций. Точность индикатора составляет 85-90%. Стратегия скальпинга с использованием M1 GPT Scalper заключается

Real Pro Signal indicator is designed for signal trading. This indicator generates trend signals.
It uses many algorithms and indicators to generate this signal. It tries to generate a signal from the points with the highest trend potential.
This indicator is a complete trading product. This indicator does not need any additional indicators.
The indicator certainly does not repaint. The point at which the signal is given does not change.
Features and Suggestions Time Frame: H1 W
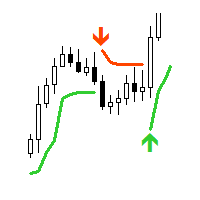
"AV SuperTrend" is an indicator for MetaTrader 4. The supertrend indicator is popular for determining the trend and positioning stops or as trailing support. I use this indicator in several expert advisors for trend analysis.
Supertrend indicator signals can be selected in the form of entry arrows and notifications, as well as various sounds.
Settings :
- Period
- Multiplier
- Alert buy signal: arrow color
- Alert sell signal: arrow color
- Alert yes/no
- Sound: choice or no
-

Индикатор торговли бинарными опционами : Надежный инструмент для ваших сделок Этот индикатор специально разработан для торговли бинарными опционами и доказал свою высокое качество, надежность и достаточную точность, в зависимости от динамики графика. Основные моменты: Интерпретация сигналов : Когда появляется синий крестовый сигнал, это указывает на потенциальный вход в сделку, хотя сам по себе он считается слабым сигналом. Однако, если синий крест сопровождается стрелкой, это считается более н

Индикатор для Краткосрочной Торговли: Основа вашей успешной стратегии Этот инструмент предназначен для пипсовки или скальпинга на финансовых рынках. Он может стать отличной отправной точкой для создания собственной торговой стратегии. Особенности: Неперерисовка сигналов: Индикатор обеспечивает надежные сигналы, которые не изменяются после их появления. Сигнал появляется на следующей свече после события, которое его вызвало. Отличные сигналы в условиях высокой волатильности: При наличии хорошей в

Simple supply and demand indicator which should help identify and visualize S&D zones. Settings:
Color for supply zones, color for demand zones - default colors are set for dark (black) background.
Number of how much zones should be created above and below current price - value "3" means there will be 3 zones above current price and 3 zones below current price. Principle:
When price creates "V", reversal zone is registered. Rectangle filled based on zone type (supply / demand) is drawn if pri
Индикатор для бинарных опционов без перерисовки представляет собой мощный инструмент для трейдеров. Он гарантирует надежность сигналов, не меняя их после их появления. Особенности: Неперерисовка сигналов: Индикатор обеспечивает стабильные и достоверные сигналы, которые не изменяются после формирования. Время экспирации: Сигналы появляются на открытии свечи и имеют экспирацию в течение одной свечи текущего таймфрейма. Метод перекрытия: В случае убыточной сделки рекомендуется использовать метод пе

Perfect Cross Arrows indicator is designed for signal trading. This indicator generates trend signals.
It uses many algorithms and indicators to generate this signal. It tries to generate a signal from the points with the highest trend potential.
This indicator is a complete trading product. This indicator does not need any additional indicators.
The indicator certainly does not repaint. The point at which the signal is given does not change. Signals are sent at the beginning of new can
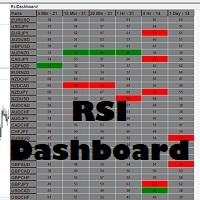
Never miss when a pair is being oversold or overbought again!! This RSI dashboard allows you to monitor RSI levels on 6 different time frames for up to 30 different currency pairs. This dashboard is packed with features including: 1. Monitoring of 6 customizable time frames (M1, M5, M15, M30, H1, H4, D1, W1, M1) 2. You can set the overbought/oversold levels you want for EACH time frame and they will be highlighted in the dashboard when a pair gets to that level
3. You can also set the RSI perio

Этот индикатор предназначен для определения времени наибольшей торговой активности внутри дня. После этого вычисления индикатор строит наиболее значимые торговые уровни. Сравнение этих уровней с реальным движением цены может дать информацию о силе и направлении рыночных тенденций.
Особенности работы индикатора Таймфрем должен быть ниже D1. Рекомендуемые таймфреймы: M15, M30 и H1. Таймфреймы выше H1 могут дать слишком грубую картину. А использование таймфремов ниже M15 может привести к появлен

1. Strictly speaking, it is not an indicator because it is a real-time position of the main force. It is only displayed through indicators, as it is real-time. 2. There is no drift or future in the indicator. The indicator has a profit of over 300 W in three months, with a winning rate of 99%. The auxiliary arrow indicator was written by me with an old foreigner and spent $5000, which is free for everyone to test.
3. The indicator is applicable to the virtual currency index of gold, crude oil
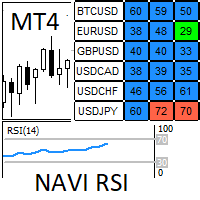
Нави RSI: Ищите сигнал относительной силы индекса в зонах перекупленности или перепроданности на каждом символе и соответствующем временном промежутке. Мы очень удобно плаваем по графикам и экономим много времени. Визуальные сигналы и уведомления появляются, когда RSI находится в зонах перекупленности и перепроданности. Визуальные сигналы и уведомления независимы как для символов, так и для временных промежутков, что очень удобно для управления уведомлениями на мобильном телефоне, когда мы отсу
What is the RVOL Indicator?
It is well established that volume (including tick volume) is a valuable indicator of trader commitment to a price movement. The challenge with using volume for intraday trading is that there is a general cycle of increasing and decreasing volume associated with the different regional trading sessions. The Relative Volume, or RVOL, indicator helps to overcome this by comparing the current volume with the average volume for that time of day, calculated over a period

Use my recommended broker: https://icmarkets.com/?camp=61478 You have most likely heard about the term "Less is more". I can tell you one thing that's also the case with the Monkey RSI on Bollinger indicator! One indicator will give you the best of both worlds, easy to determine trend, the strength of the trend and overbought and oversold levels. This indicator is very simple to follow: Green line uptrend Red line downtrend Above band overbought Below band oversold With this indicator you cou

Introducing Daily Hedge - Your Advanced Custom Hedge System for Forex Trading Unleash the Power of Daily Hedge - Your Ultimate Trading Companion Experience the next level of trading sophistication with Daily Hedge, an advanced custom hedge system designed to revolutionize your Forex trading experience. With its cutting-edge features and intelligent algorithms, Daily Hedge empowers you to make informed decisions and seize profitable opportunities like never before. Unlocking Advanced Trading Str

Great Strong System indicator is designed for signal trading. This indicator generates trend signals.
It uses many algorithms and indicators to generate this signal. It tries to generate a signal from the points with the highest trend potential.
This indicator is a complete trading product. This indicator does not need any additional indicators.
The indicator certainly does not repaint. The point at which the signal is given does not change.
Features and Suggestions Time Frame:

This Indicator is use the ZigZag to calculate the Upper and Lower Bound and the uptrend and the downtrned. Red for downtrend, Green for uptrend and Yellow is for the horizontal trend this horizontal trend also bookmarked the upper limited and the lower limited the the price swings. Or in simple the Support and the Resistance level. However, You may use the Heikin Ashi to confirm the trend of the buy sell signal above. I cannot guarantee the win rate, Nevertheless, you must study well the timef
Возможно вы ранее читали в книгах по техническому анализу о таком понятии как "наклон рынка", или "наклон тренда". В метатрейдере есть такой инструмент как "трендовая по углу". Но при работе на автомасштабируемых графиках этот инструмент становится полностью абстрактным, и как следствие бесполезным. Идея этого нового параметра, включенного в индикатор AllAverages_Speed, заключается в придании такому понятию как "наклон тренда" конкретных числовых значений, а также дальнейшее использование нового

Как торговать с помощью этого индикатора: когда рисует красную стрелку - открываем сделки на продажу. когда рисует синюю стрелку - открываем сделки на покупку. Master Trend Pro - предсказывает будущее направление цены, с помощью регрессионного сглаживания стандартного мувинга. Индикатор стрелкой показывает куда будет двигаться с высокой вероятностью цена. Этот индикатор подходит для торговли по стратегии скальпинга на таймфреймах M1 и M5. Если индикатор рисовал синюю стрелку, а потом начал рисо

This is a simple arrow system based on MACD indicators Main/Base line and MACD Levels. It gives you alerts when MACD's Main Line crosses above/below certain level. Which type of alerts available? 1. It paints on chart Up/Down Arrows. 2. Popup message and sound alert in trading terminal window. 3. Push notification or Alert on your android and ios mobile phones (requires MT4 or MT5 app installed!)

This is a simple arrow system based on Engulfing Candlestick Pattern. It gives you alerts on your smartphone when there is an engulfing candlestick pattern happens. Which type of alerts available? 1. It paints on chart Up/Down Arrows. 2. Popup message and sound alert in trading terminal window. 3. Push notification or Alert on your Android and IOS mobile phones (requires MT4 or MT5 app installed!) *Note: Use it on higher timeframes like H4 (4 hours), D1 (1 Day) then find trade opportunities on s
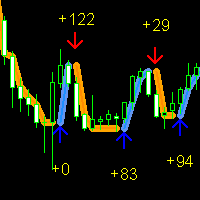
Forex Gump Signal - новый индикатор из серии ForexGump. Этот индикатор, в отличии от других, определяет точки разворота цены с помощью математического вычисления скорости стандартного мувинга. Когда скорость мувинга замедляется, индикатор интерпретирует это как сигнал на разворот тренда. Это позволяет индикатору улавливать даже самые незначительные точки разворота цены. Для того, чтобы индикатор начал анализировать более крупные точки разворота, необходимо уменьшить параметр "first_slowdown" и у
This is a MACD indicator which displays an up-arrow/down-arrow on the main chart window when MACD line cross zero and signal line. 1) The arrows on the main chart are very useful to traders because it will draw trader's attention to change of trend or momentum instantly. 2) It is definitely easier and faster than looking at the sub-window at the bottom of the screen. It is an important tool for MACD strategy. 3) User can opt for displaying the MACD cross Signal arrows which are in line with the
Amazing Pro Signal indicator is designed for signal trading. This indicator generates trend signals.
It uses many algorithms and indicators to generate this signal. It tries to generate a signal from the points with the highest trend potential.
This indicator is a complete trading product. This indicator does not need any additional indicators.
The indicator certainly does not repaint. The point at which the signal is given does not change.
Features and Suggestions Time Frame: H
MetaTrader Маркет - единственный магазин, где можно скачать демоверсию торгового робота и подвергнуть его проверке и даже оптимизации на исторических данных.
Прочитайте описание и отзывы других покупателей на заинтересовавший вас продукт, скачайте его прямо в терминал и узнайте, как протестировать торгового робота перед покупкой. Только у нас вы можете получить представление о программе, не заплатив за неё.
Вы упускаете торговые возможности:
- Бесплатные приложения для трейдинга
- 8 000+ сигналов для копирования
- Экономические новости для анализа финансовых рынков
Регистрация
Вход
Если у вас нет учетной записи, зарегистрируйтесь
Для авторизации и пользования сайтом MQL5.com необходимо разрешить использование файлов Сookie.
Пожалуйста, включите в вашем браузере данную настройку, иначе вы не сможете авторизоваться.