Смотри обучающее видео по маркету на YouTube
Как купить торгового робота или индикатор
Запусти робота на
виртуальном хостинге
виртуальном хостинге
Протестируй индикатор/робота перед покупкой
Хочешь зарабатывать в Маркете?
Как подать продукт, чтобы его покупали
Технические индикаторы для MetaTrader 4 - 109
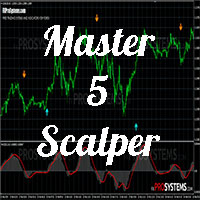
Привет трейдерам, особенно скальперам. на этот раз я представляю специальный индикатор для скальперов на 5-минутном таймфрейме
Ожидается, что этот индикатор будет полезен новичкам, которые запутались в поиске индикатора скальпера, который легко понять.
хорошо давай
Этот индикатор работает только на 5-минутном таймфрейме. Этот индикатор также может отправлять уведомления трейдерам через мобильные устройства, введя MQID на вашей торговой платформе.
Этот индикатор использует модифицированн
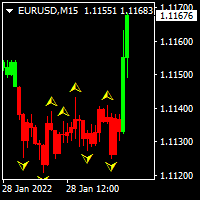
This indicator helps you to build position and profit when market turns in your favor. You will build your full position by trading many small position. If there is green colored candle on the chart, you could add long position. If there is red colored candle on the chart, you could add short position. I personally spread my full size position in to 5-10 small position. I use small target of 2-5 pips on eurusd pair.
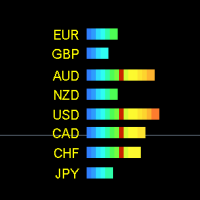
"Forex strength meter full" - новая усовершенствованная версия популярного индикатора. В этой версии мы изменили входные фильтры и сделали сигналы индикатора более быстрыми и более точными. Теперь этот индикатор можно использовать в торговле еще более эффективнее чем его базовая бесплатная версия. Новая версия индикатора построена на алгоритмах самообучения и способна самоанализировать свои сигналы, чтобы исключать ложные потоки данных информации. Почему нужно использовать этот индикатор? Он хор
Color Levels - удобный инструмент для тех, кто использует технический анализ с использованием таких инструментов, как Трендовая линия и Прямоугольник. Имеется возможность настройки двух пустых прямоугольников, трех закрашенных и двух трендовых линий. Настройки индикатора крайне просты и делятся на пронумерованные блоки: С цифрами 1 и 2 вначале - настройки пустых прямоугольников (рамок); С цифрами 3, 4 и 5 - настройки закрашенных прямоугольников; С цифрами 6 и 7 - настройки трендовых линий. Объе

Этот индикатор имеет универсальный алгоритм торговли, который основан на импульсе цены . Все максимально упрощено - только сигналы на Buy и Sell . Есть оповещения, чтобы не пропустить открытие позиции.
Не требует оптимизации и дополнительных настроек!
Для любых типов инструментов: валюты, нефть, металлы, криптовалюты. Для любых таймфреймов: от M1 до D1 . Для любых стилей торговли: скальпинг, интрадэй, свинг, долгосрок . Если Вам необходима дополнительная информация или есть вопросы
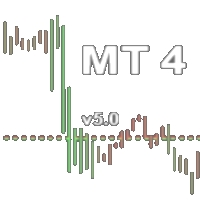
Индикатор закрашивает бары по цвету, выбор цвета ведется из расчета торгового объема валютного инструмента. вертикальную линию есть возможность перемещать для изучения на исторических данных горизонтальные линии отвечают за максимальный и минимальный бар зеленый большой объем красный маленький объем настройки: выбор ширины окраски бара выбор количество баров для расчета
Есть возможность доработать индивидуально: вывод звуковых сигналов вывод сообщения в телеграмм комбинировать с другим индика

The Qv² Halifax - Indicator developed through a complex series of calculations, which aims to easily identify buylng and selling signals.
Buy signal are indicated by up arrows.
Sell signal are indicated by down arrows.
An important detail: In order to make the indicator work, the timeframes M1, M5. M15. M30, H1 D1 must be all updated.
It can be used on all pairs (I use it on Gold).
it is a very good deal in the trending market
To learn more about my work click here

The indicator (Current Strength) is represented in a separate window by Blue and Pink histogram . The parameter NPeriod represents the number of bars on which we calculate the variation of forces, the recommended value is 5. The Blue histogram measures the buyers force , while the Pink histogram measures the sellers force . The change in color signifies the change in strength which leads t he price . Each drop (especially below 52.8) after touching levels 96.3 or 1.236 must be condidered

(Автоперевод) Большинству трейдеров известен знаменитый японский индикатор Хейкин-Аши , созданный в 1700-х годах Мунехисой Хоммой . Иногда его пишут Heiken-Ashi , но его значение остается прежним, а именно «средний бар» по-японски. Это реализация очень известного индикатора Heikin Ashi , но с несколькими дополнительными функциями. Во-первых, он позволяет взвешивать его значения по объему , будь то объем тиков , реальный объем или псевдообъем на основе истинного диапазона. Основное преимущество з
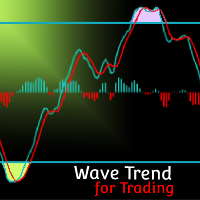
MT5 Version Wave Trend MT4 Wave Trend is an oscillator, which helps identifing in a extremely accurate manner market reversals. The Oscillator being obove the overbought level and a cross down of the fast into the slow MA usually indicates a good SELL signal. If the oscillators is below the oversold level and the fast MA crosses over the slower MA usually highlights a good BUY signal. The Wave Trend indicator can be also used when divergences appear against the price, indicating the current mo
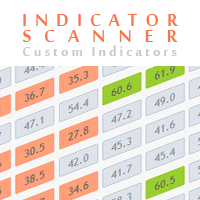
Advanced Indicator Scanner is a multi-symbol multi-timeframe scanner that works with hundreds of custom indicators available across the web including mql5 website market and codebase indicators.
Advanced Indicator Scanner features:
Scans your indicator in 28 customizable instruments and 9 timeframes. Monitors up to 2 lines(buffers) of an indicator. Showing of indicator value on buttons. You can choose between 3 alert modes: Single symbol and timeframe Multiple timeframes of a symbol Multipl

RSI Trend Line - это простой индикатор, который рисует линий тренда. Параметры: LevelStep - шаг между максимумами и минимумами. Period_RSI - стандартный параметр индикатора RSI. UpperLineColor - задает цвет линий тренда для UP. LowerLineColor - задает цвет линий тренда для Down. Alerts - параметр отвечает за Вкл/Выкл уведомления при пересечений линий тренда с RSI. По умолчанию стоит Вкл.
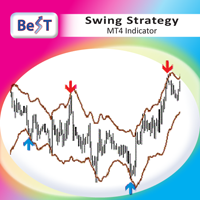
BeST Swing Strategy is a Metatrader indicator based on the corresponding Jim Berg's work about volatility as described in his article "The Truth About Volatility" (TASC 2/2005).The indicator consists of 2 channel lines deriving as (MA +/- times the ATR) and can be used as a standalone trading system.The outlier prices of the Market as of the indicator's values can be used for producing Entry and Exit Signals.
Advantages of the indicator == Uses 2 Swing Strategies (Normal and Reverse)
== Ne
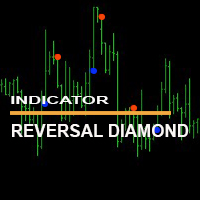
Индикатор " Reversal Diamond Indicator" мощный инструмент для торговли на рынке форекс. " Reversal Diamond Indicator" не перерисовывается и не меняет свои значения при переключении временных периодов. The "Reverse Diamond Indicator" indicator is a powerful tool for trading on the forex market. The "Reverse Diamond Indicator" does not redraw and does not change its values when switching time periods.

Индикатор " Nostradamus ind" мощный инструмент для торговли на рынке форекс. " Nostradamus ind" не перерисовывается и не меняет свои значения при переключении временных периодов. The "Nostradamus ind" indicator is a powerful tool for trading on the forex market. "Nostradamus ind" does not redraw and does not change its values when switching time periods.

Индикатор "Trend direction ind" является трендовым индикатором. Индикатор "Trend direction ind"не запаздывает, выдает сигналы на нулевом баре и не перерисовывает при переключении таимфреймов. С индикатором "Trend direction ind" вы будете с легкостью определять текущую тенденцию. The "Trend direction ind" indicator is a trend indicator. The "Trend direction ind" indicator does not lag, gives signals at the zero bar and does not redraw when switching time frames. With the "Trend direction ind
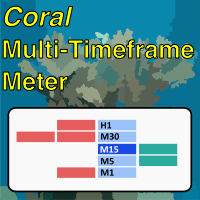
Coral Multi TF Meter allows you to quickly see how price is moving on a single currency pair across multiple timeframes at once. You can select which timeframes to display; the size, position, colors of cells; whether to display values or not; and how often the meter is updated. The calculation is based on ATR distance for each displayed timeframe. Hover over the header cell for the row (with the currency name in it) to see the current ATR value (in pips) for that period. When "Display Values
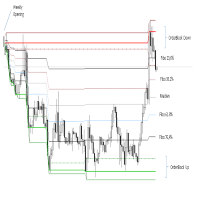
The indicator is activated at the beginning of each week and detects both bullish and bearish ORDERBLOCK potentials. These levels are of high operational probability, being able to use a minimum ratio of 3 to 1 to maximize profits. It is recommended to use pending orders at the OB levels of the chart and place the SL up to a maximum of 20 pips from the entry price.
Submit the indicator to Backtesting to become familiar with its performance and complement it with other trend or oscillation typ

The indicator is triggered at the start of each trading day and detects both bullish and bearish ORDERBLOCK potentials. These levels are of high operational probability, being able to use a minimum ratio of 3 to 1 to maximize profits. It is recommended to use TimeFrame M5 to M30 for a proper display and consider pending orders at the OB levels of the chart and place the SL up to a maximum of 20 pips from the entry price.
Submit the indicator to Backtesting to become familiar with its performa

Универсальная, очень простая но надёжная торговая стратегия для ловли откатов после сильного импульса. Подходит как для Форекса, Стоков и Бинарных опционов. Чем выше ТФ, тем точнее сигналы, но реже входы. Можно применять как вход для работы по одному(двум) барам, так и для построения небольшой сетки из 3-5 колен как с мартингейлом так и без. Для Бинарных опционов просто время экспирации. В индикаторе есть алерты, пуш уведомления, уведомления на почту. Можно настроить расписание работы. Можно н

Это инструмент для проверки сторонних стрелочных индикаторов с выводом статистики на экран. Так же можно применить для них встроенные фильтры. Или можно вообще создать свою систему из одних только встроенных фильтров. Блок ADX Включение ADX - вкл/выкл использование индикатора ADX ( Average Directional Movement Index ); Период - период используемого индикатора; Уровень - сигнальный уровень для используемого индикатора; Тип цены - тип цены для используемого индикатора; Блоки

Система для визуализации популярных шаблонов ценовых формаций. После подключения индикатор автоматически отобразит на графике следующие формации: Пиноккио бар (“пинбар”) - свеча с небольшим телом и длинным “носом”, очень известный разворотный шаблон; Внутренний бар - свеча, диапазон которой лежит внутри диапазона предыдущей свечи. Такая формация представляет неопределённость рынка; Внешний бар - свеча, диапазон которой превышает диапазон предыдущей свечи. Такая формация представляет неопре
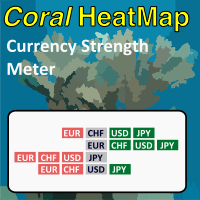
Coral Heatmap is a currency strength meter based on the ATR values for the selected timeframe. There are two main view modes: All Currencies (default) - see the ranked strength of all currencies in a single view Selected Currency - see the relative strength of all other currencies compared to a selected currency You can optionally display the timeframe selection toolbar; timeframe is always synchronized to the current chart timeframe. Use keyboard shortcuts to quickly navigate currencies (up/d
Индикатор "BO indicator at zero bar" для торговли бинарных опционов. Индикатор выдаёт свои сигналы на нулевом баре не перерисовывает и не меняет свои показатели при переключении временных периодов. Рекомендую использовать индикатор совместно с другим индикатором как фильтр "BO indicator at zero bar" indicator for binary options trading. The indicator gives its signals on the zero bar, does not redraw and does not change its indicators when switching time periods. I recommend using the indicato
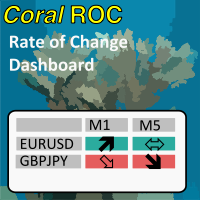
Coral Rate of Change Dashboard displays "rate of change" calculations across multiple symbols and timeframes simultaneously. See at a glance which pairs are moving, and how quickly. Receive alerts when any symbol + timeframe is experiencing very strong movement. You can display data for currency pairs, or for individual currencies (takes the average for each currency across all available pairs). See the CoralDash product description for the core functionality of the dashboard (symbol exposu
Индикатор "Reversal zone" показывает силовые уровни и возможные точки разворота на текущем графике. Индикатор "Reversal zone" поможет трейдеру разобраться с текущей ситуацией The "Reverse zone" indicator shows power levels and possible reversal points on the current chart. The "Reverse zone" indicator will help the trader to deal with the current situation

Индикатор "Trend zone" Помощник трейдеру, показывает на графике текущую тенденцию. Он надеюсь станет незаменимым индикатором в ваше трейдинге. Индикатор не перерисовывается и не меняет свои значения про переключение временных периодов The "Trend zone" indicator is a trader's assistant, shows the current trend on the chart. I hope it will become an indispensable indicator in your trading. The indicator does not redraw and does not change its values about switching time periods
Индикатор "Zigzag levels" основан на индикаторе зигзаг. Индикатор показывает зоны уровней поддержки и сопротивления относительно индикатору зигзаг. Индикатор "Zigzag levels" сделает хорошую службу в вашем трейдинге. Всем больших профитов!!! The Zigzag levels indicator is based on the zigzag indicator. The indicator shows the zones of support and resistance levels relative to the zigzag indicator. The Zigzag levels indicator will do a good service in your trading. Big profits for everyone!!!

Индикатор Omega Point использует сложную многофункциональную систему для определения начала трендов, которые с высокой доли вероятности будут длится длительное время. Система использует несколько сложных режимов расчета тренда, благодаря чему индикатор подстраивается под спецификации разных валютных пар, и подходит как для консервативной, так и для агрессивной торговли. Индикатор делает необходимые расчеты, и показывает важную информацию, о том, как бы исполнилась сделка, если бы трейдер вошел в
Индикатор ищет и отображает на графике большие тени автоматически на основе волатильности. Тени дополнительно фильтруются размером волны. Алгоритм анализирует пробой фрактала тенью в указанном диапазоне и отображает уровень . В настройках можно включить мультвалютный дэшборд . Алерт выбирается между текущим графиком или всем листом дэшборда. Сигналы на большие тени и те, что пробили фрактальный уровень можно включить отдельно . Blog-Link - Retest and Fake Breakout with UPD1 .
Торговые патте
移動平均線クロス、ボリンジャーと移動平均線のクロス、移動平均線の角度でサイン表示
MT5インジケータ こちらに サイト とがあります。 このインジケータは3つのパターンでサインを表示(切り替え可能)します。 ① 移動平均線のクロス ② ボリンジャーバンドと短期移動平均線とのクロス ③ ボリンジャーバンドと短期移動平均線とのクロスと、中期移動平均線と長期移動平均線の角度 移動平均線のクロス 指定した短期移動平均線と長期移動平均線のゴールデンクロスでは買いサイン、デットクロスでは売りサインを表示します。 ディフォルトでは短期は5,長期は20となっています。 もちろん変更可能になります。 移動平均線の種類をEMA(指数平滑移動平均線)やSMMA(平滑化移動平均)などに変更可能で適する価格も変更可能になります。 ボリンジャーバンドと短期移動平均線のクロス ボリンジャーバンド(以降BB)と短期移動平均線のクロスでサインを表示します。 ディフォルトではBB+1σと5MAのゴールデンクロスで買いサイン、BB-1σと5MAのデットクロスで売りサインでサインを表示します。 BBの期間や
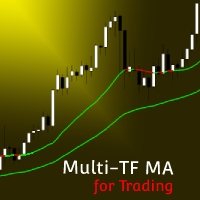
MT5 Version Multi Timeframe MA MT4 Multi Timeframe MA MT4 is an indicator that offers the representation of up to 3 MAs with different Periods and Timeframes. This allows the user to reprensent in one chart and timeframe information coming from other timeframes and get notified as any of the MAs crosses another one. Multi Timeframe MA is the first indicator in the market that offers Multi Timeframe interactions and a high customization level from up to 7 different MA types (SMA, EMA, WMA,
KT Bollinger Shots works using a striking blend of the slingshot pattern and the mean-reversion phenomenon applied to financial markets.
In addition, a mathematical algorithm is used with variable deviation to fine-tune the indicator's signals on a different level.
Winning Trade: After a signal, if price touches the middle band in profit, it is considered a winner. Losing Trade: After a signal, if price touches the opposite band or touches the middle band in loss, it is considered a loser.
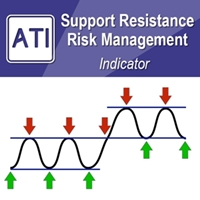
Introduction to Support Resistance Risk Management Support Resistance is the most trusted technical analysis. However, the risk management for the support and resistance is not practiced often. Hence we provide one effective risk managment method for the support and resistance trader. In the book: Scientific Guide To Price Action and Pattern Trading (Wisdom of Trend, Cycle, and Fractal Wave), how to use Support Resistance is described as well as Fibonacci Analysis, Harmonic Pattern, Elliott Wave

Индикатор сигнализирует о появлении возможного дивергентного бара на основе формы бара без определения ангуляции. Бычий дивергентный бар – это бар, который закрывается в своей верхней половине (чем выше, тем лучше), имеет более низкий минимум, чем у предыдущего бара, и резко уходит вниз от индикатора “Аллигатор”. Медвежий дивергентный бар – это бар, который закрывается в своей нижней половине (чем ниже, тем лучше), имеет более высокий максимум, чем у предыдущего бара, и резко уходит вверх от “А

Индикатор сигнализирует о появлении возможного дивергентного бара на основе формы бара и его стандартного отклонения от индикатора “Аллигатор”. Бычий дивергентный бар – это бар, который закрывается в своей верхней половине (чем выше, тем лучше), имеет более низкий минимум, чем у предыдущего бара, и резко уходит вниз от “Аллигатора”. Медвежий дивергентный бар – это бар, который закрывается в своей нижней половине (чем ниже, тем лучше), имеет более высокий максимум, чем у предыдущего бара, и резко
PAX BDB Trade Chaos system of Bill Williams (Bearish/Bullish divergent bar)
One of the signals of the "Trade Chaos" system of Bill Williams. (First wiseman) When bar moving away from the "Alligator" indicator and there is divergence on the Awesome Oscillator indicator, it shows a potential point of movement change. It is based on the opening/closing of the bar, the position relative to the previous ones, the Alligator and AO. When trading, the entrance is at the breakthrough of the bar(short

Scalping channel - индикатор направления движения цены. Куда смотрит канал - туда движется цена. Когда канал смотрит вниз, а цена находится вверху канала - открываем сделку на продажу. Когда канал смотрит вверх, а цена находится внизу канала - открываем сделку на покупку. Это простая скальпинговая стратегия для торговли внутри дня, на таймфреймах M1, M5, M15, M30. Каждый кто купит этот индикатор, получит в подарок робота скальпера, который торгует по этому индикатору автоматически.
Если то

Индикатор в реальном времени дает сигналы на покупку и на продажу. При выборе направления по основному тренду около 75-80% сигналов отрабатывают в профит. Абсолютно все сигналы остаются на графике и не меняют своего положения, поэтому можно легко протестировать работу индикатора как на истории, так и в тестере стратегий. Настройки индикатора просты и логичны: параметр Velocity отвечает за количество и частоту появления сигналов, оптимальное значение от 10 до 40 в зависимости от рабочего таймфре

Scalping Points Pro - индикатор который показывает на графике точки возможного разворота цены и не перерисовывает свои сигналы. Так же, индикатор отправляет трейдеру сигналы на Email и Push. Точность сигналов данного индикатора примерно 92-94% на таймфрейме M5 и более 95% на таймфрейме H1. Таким образом этот индикатор позволяет трейдеру достаточно точно открывать сделки и прогнозировать дальнейшее движение цены. Индикатор не перерисовывает свои сигналы.
Индикатор работает на таймфреймах от M1 д

Scalping Snake Pro - уникальный скальпинговый индикатор, который показывает трейдеру моменты разворота цены и не перерисовывается. Этот индикатор, в отличии от многих других в интернете, не перерисовывает свои значения. Он рисует сигналы на самом первом баре, что позволяет не запаздывать с открытием сделок. Этот индикатор при появлении сигнала отправляет трейдеру на телефон и email уведомления. Весь этот функционал Вы получаете всего за 147$. Как торговать с помощью этого индикатора?
Открываем
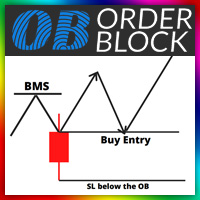
Orde Block Detector: The order block detector can automatically identify the breakthrough of the market structure. After the trend framework breaks through, the order block area can be drawn automatically. In order to draw the OB area more accurately, we also automatically find the candle on the left and right sides of the original candle according to its trading principle, and draw a more accurate ob area through more subtle quantitative rule judgment. Futures : 1. Customize the BMS color, and

Этот индикатор зон спроса и предложения рисует зоны на графике и отправляет оповещения, когда цена достигает или пробивает зону. Его также можно использовать для получения предупреждений о регулярных двойных вершинах/основаниях вместо зон. Можно использовать фильтры RSI, объема и дивергенции, чтобы отфильтровать только самые сильные сетапы. В сочетании с вашими собственными правилами и методами этот индикатор позволит вам создать (или усовершенствовать) собственную мощную систему. Этот индикатор
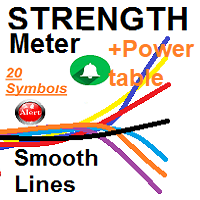
separate indicator window for Currencies Strength smooth lines for up to 20 symbols based on (5) time frames &&& MAIN Window Power TABLE for up to 20 Symbols for (5) timeframes and the Total calculated Symbols strength for each
1- Currencies Strength - It draws smooth lines for up to 20 currencies pairs representing Volatility strength and power calculated by 5 selected time frames not only ***Works on any Time frame but i recommend from M15 M30 H1 .... (lowest frames need higher index of
Индикатор предназначен для определения пробоев уровня фрактала Билла Вильямса на графике инструмента в MetaTrader4.
После установки индикатора на график инструмента, при возникновении пробоя уровня фрактала Билла Вильямса, сигнальный бар (свеча) отмечается цветным указателем (стрелкой) в направлении пробоя.
Для большей наглядности можно добавить на график инструмента стандартный индикатор "Фрактал Билла Вильямса".
При добавлении индикатора на график инструмента можно настроить его параме
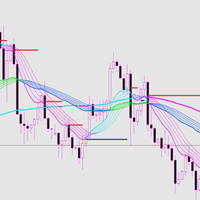
This indicator has good trend malleability and a good trend resistance support line. Index characteristics The color changes, following the trend of different levels. The support and resistance line means that the price follows or reverses.
Basic display A price tag showing historical support and resistance. Shows the approximate recommended range of historical entry positions, as well as take-profit and stop-loss recommendations, and target forecasts. Display the judgment of the current direc

Bollinger Bands Breakout Strategy has an Arrows and Scanner Dashboard indicator set. It is for MT4 (Metatrader 4) platform.
When price breaks out of a Bollinger Outer Band in a powerful way, it becomes a great position for scalping. Because the next few bars will most likely keep going in the same direction. Especially if Middle band is also sloping towards that breakout. It's also great for Binary options when using 2-3 next few bars.
Strategy: BUY Bollinger Bands:
- Price breaks out of
Индикатор Market Reversal Catcher ищет точки разворота рынка или серьезные откаты. Для этого он анализирует предыдущие ценовые движения и с помощью гибкого алгоритма оценки вероятности разворота, а также дает рекомендации по точкам входа и выставляет рекомендуемые цели прибыли для открытых по сигналу позиций. Инструкция по использованию - Читать
Версия для MetaTrader 5 - здесь Индикатор очень прост в применении и не требует изучения большого числа информации для того, чтобы понять как он р
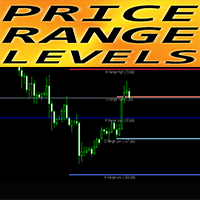
Forex Indicator "Room_UP_DWN_Day_Week_Month" for MT4 Indicator " Room_UP_DWN_Day_Week_Month " is very useful auxiliary indicator It shows you daily, weekly and monthly most probable levels , which can be reached by price (price range levels). Daily range is useful for intraday traders Weekly & Monthly ranges are for Swing and Long term traders Indicator is excellent to plan your Take Profit targets or arrange Stop Losses . // More great Expert Advisors and Indicators are available here: https
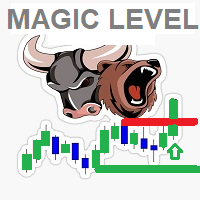
::: THE MAGIC PRICE LEVEL ::: * this smart indicator detects market direction By identifying super candles and Big Price Actions to generate major support/ resistance levels * It detects the major breakout Candles with Candle body size and shows it in a separate window to give a great indication of market power and direction * Support resistance lines are detected by a unique strategy using bars patterns and bars size * the only major magic Price level will be showed on the chart depending o
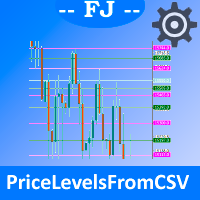
This indicator allows you to load different prices, price lines, from file. You can easily import the same information between all your windows, without the worry of replicating the same information window to window. In addition, up to 6 different groups are allowed to be able to configure their visualization in a different way and the possibility of activating or not visually each group, at your convenience.
Configuration, indicator variables:
-IndicatorON_OFF: Allows you to enable or di

Supply Demand Zones indicator for possible BUY / Sell Zones based on smart volumes indicator two levels of buy/Sell Zones : Main BUY/SELL area SUPPLY area in Red DEMAND area in Green your strategy is to follow generated Arrows : 1- you can Buy when price is Closed above a green BUY area and above high of previous candle 2- you can Sell when price is Closed below a red SELL area and below low of previous candle Also, a separate indicator window for SMART CANDLES used to detect the Big Supp

Fibo Panda is an indicator that can help you predict the end of daily trends. If the daily price has reached the END L4 or END H4, means the Daily volume is enough. If the daily price has reached the Highest or Lowest, means the price has reached the highest or lowest level. Price must touch the End Hi or End Low Level to complete the price movement of each timeframe. A conclusion can be made whether to buy or sell. If the price is in the High Guard and Low Guard areas it means the price is now

TripleStar Trend Indicator, Breakthrough Solution For Trend Trading And Filtering With All Important trend Tool Features Built Inside One Tool! This is a custom MT4 ( Metatrader 4 ) indicator that analyzes the trend and volatility analyzer indicator. In addition, It identifies the beginning and the end of the trend that works for most currency pairs and timeframes. The Trend Monitor indicator is using an optimized formula based on momentum to calculate the trend volatiltiy.
Our indicator
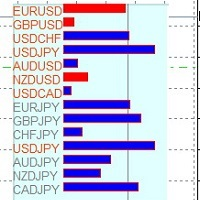
This is an indicator that calculates the correlation between the most important cross with the coefficient of Bravais-Pearson. You can choose the timeframe and the evaluation period. It is a useful tool to anticipate the movements of currencies related. If a currency cross has already anticipated the movement, it can be expected that the correlated currency pairs could also follow the opposite (inverse correlation) or equal (direct correlation) movement. This indicator run with USD, EUR, JPY, CA
Indicator that measures the strength of major currencies against other currencies. When the strength of one currency exceeds that of the other it is time to open a position in BUY or SELL. It is possible to enable the notifications from the parameters and to insert or not the signals in the graph directly. Very reliable indicator that is based on the whole market of the main currencies and not just on the single currency cross.
"BUYUK SAVDOGAR" TM разработал эту стратегию для поддержки всех кто торгует на бинарных опционах. Если вы торгуете бинарными опционами, попробуйте эту торговую систему. Большинство пользователей сообщают о хороших результатах. Торговая система основана на лучшем алгоритме. Торговая система помогает определить рыночную ситуацию по объему. Потеря интереса в ту или иную сторону к текущей цене влияет на дальнейшее движение цены. Невозможно обнаружить эту информацию человеческим глазом. Цифры под с
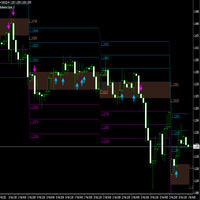
A breakout refers to when the price of an asset moves above a resistance area, or moves below a support area . Breakouts indicate the potential for the price to start trending in the breakout direction. For example, a breakout to the upside from a chart pattern could indicate the price will start trending higher. The indicator works with arrows in case of breakthrough, you also have a level of 1 tp, a level of 2 tp, a level of 3 tp. For more information, welcome to our Telegram Group. https:/
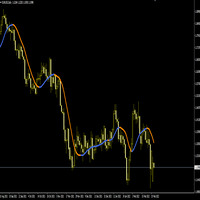
The Hull Moving Average (HMA) attempts to minimize the lag of a traditional moving average while retaining the smoothness of the moving average line. Developed by Alan Hull in 2005, this indicator makes use of weighted moving averages to prioritize more recent values and greatly reduce lag. The resulting average is more responsive and well-suited for identifying entry points. For more information, welcome to our Telegram Group.
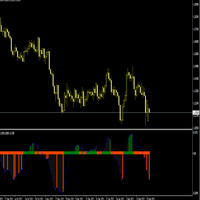
The Slope indicator measures the slope of a linear regression , which is the line of best fit for a data series. A 20-period Slope, therefore, measures the slope of a 20-day linear regression. ... In general, a positive slope indicates an uptrend, while a negative slope indicates a downtrend. How do you use slope Indicator?
By applying the slope indicator to both the price chart and the price relative , chartists can quantify the price trend and relative performance with one indicator. A po

The super channel is a very profitable indicator to be used preferably on TF H1 and H4 also in a combined version using two of them together. Its signal is excellent and used with evaluation of supports and resistances the signal is very precise. The first warning signs are the dots, green dot warning of an upcoming buy signal, red dot warning of an upcoming sell signal. The blue arrows is the buy opening signal, the red arrow is the sell opening signal.

The MaxandMin Indicator when used with the Super Canale Indicator gives strength to the input signal. When the arrow of this indicator appears with that of the Super Channel the signal is input, when it appears alone the signal is alert. You can also use this indicator with price action to define the true highs and lows of the price. Its use with the Super Canale indicator gives an additional warning signal or profitable entry.

Для любителей ишимоку я оставляю вам этот индикатор, который позволяет вам увидеть ишимоку кумо следующих двух периодов в текущем периоде. Значения индикатора в периоды выше текущего корректируются автоматически, необходимо только ввести параметры основного ишимоку (у него стандартные параметры 9,26,52) и на основе этих параметров остальные 2 облака или кумо рассчитываются.
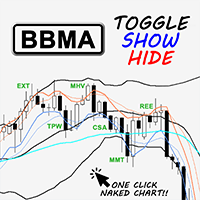
Intro A customizable toggle indicator based on BBMA (Bollinger Bands & Moving Averages) trading system which allows traders to switch between BBMA & Naked Chart in one click, without having the need to change the chart template.
Main Features One Click Toggle Show/Hide : Switch to naked chart in just one click! Combine it with other trading strategy as you prefer to give more confluence on your trading. All drawn objects will not be affected by the indicator toggle show/hide function. Customi

Indicator plots price cycle blocks and sends signals with smart volume confirmation. Price cycles and fractals are combined to determine the demand/supply blocks. The indicator can be used alone or combined with other Cycle Indicators Inputs: Period: Recommended value is between 35 and 55( Which are Set 1 and Set 2 periods of cycle sniper ) Engulfing: If true, you will be able to see the engulfing bar confirmation. Volume Filter: True (The arrow comes with volume confirmation ) Videos with dif
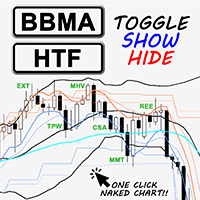
Intro A customizable toggle indicator based on BBMA (Bollinger Bands & Moving Averages) trading system which allows traders to switch between BBMA & Naked Chart in one click, without having the need to change the chart template. Added ability to view higher time frame zones on a lower time frame chart, in one click, to assist traders on multi-time frame analysis.
Main Features One Click Toggle Show/Hide : Switch to naked chart in just one click! Combine it with other trading strategy as you pr

Wave Anatomy Visit: http://www.tradethevolumewaves.com for more information
Construct your own 5 Waves and analyze the price movements stages:
Easy Movement Hard time to move Fast move This indicator is based on Wyckoff’s, David’s Weis and my Speed Index Theory. This indicator will you help analyze what is happening in 5 Price Waves that you can construct yourself. This tool is designed for scalpers and swing traders and will help them to analyze any wave on any timeframe at the same tim

What Is MT4 Candlestick Pattern Indicator Candlestick patterns are groups of candlestick that have a meaning for the trader. These groups are usually composed of two, three, four, or five candles and indicate some form of price action happening. In many cases traders use these patterns to decide what to do next. Candlestick Pattern Indicator for MT4 is a plugin that allows you to see the most common candlestick patterns on your chart. The indicator scans the chart and detects popular patterns, m

Ichimoku panel is an indicator that shows the behavior of different ichimoku signals in all time frames.
System parameters:
TENKAN SEN: Average period of Tenkan Sen.
KIJUN SEN: Average period of Kijun Sen.
SENKOU SPAN B: Average period of Senkou SpanB.
SHOW TENKAN..KIJUN: shows the crossing of the moving averages TENKAN SEN and KIJUN SEN.
SHOW KIJUN..KUMO: shows the position of the kijun sen moving average with respect to the kumo or ichimoku cloud.
SHOW CHICOU..KUMO: shows the po
Индикатор технического анализа Trainspotting , показывает точки для входа в рынок, точки потенциального разворота рынка. Интеллектуальный алгоритм индикатора точностью определяет тренд. Использует два параметры для настроек. Индикатор построен для простого и эффективного визуального обнаружения тренда с дополнительным фильтром сглаживания.
Вы уже устали от постоянных взлетов и падений? Не стоит становится жертвой неустойчивых движений рынка, пора уже как-то от этого избавиться! Уже сейчас вы
MetaTrader Маркет - единственный магазин, где можно скачать демоверсию торгового робота и подвергнуть его проверке и даже оптимизации на исторических данных.
Прочитайте описание и отзывы других покупателей на заинтересовавший вас продукт, скачайте его прямо в терминал и узнайте, как протестировать торгового робота перед покупкой. Только у нас вы можете получить представление о программе, не заплатив за неё.
Вы упускаете торговые возможности:
- Бесплатные приложения для трейдинга
- 8 000+ сигналов для копирования
- Экономические новости для анализа финансовых рынков
Регистрация
Вход
Если у вас нет учетной записи, зарегистрируйтесь
Для авторизации и пользования сайтом MQL5.com необходимо разрешить использование файлов Сookie.
Пожалуйста, включите в вашем браузере данную настройку, иначе вы не сможете авторизоваться.