Testing patterns that arise when trading currency pair baskets. Part III
Andrei Novichkov | 13 February, 2018
Introduction
We are approaching the final part of testing patterns that arise when trading currency pair baskets. As you may remember, in our previous article, we described the pattern that forms when the combined indicator graph crosses the moving average. We also considered the possibility of using it as a filter for the overbought/oversold line breakthrough pattern.
We have already evaluated the development of patterns occurring on the combined indicator-oscillator graphs. This topic can be considered complete.
Let's test the last type of patterns. In the main article about trading currency pairs, it is described under the numbers 4 and 5. Let me briefly remind you where you can find such patterns.
Each pair currency belongs to its basket. For example, EURUSD represents two currency baskets — EUR and USD ones. The behavior of this pair can be analyzed using two combined indicators — one for each basket. We analyze the difference between the readings of these indicators in order to detect weakening or strengthening of pairs relative to each other. Hence, we are able to draw conclusions about the direction of the trend.
The combined indicator graph is based on the described principle, and we look for the patterns 4 and 5 on it. We already know their general appearance: one of them is based on a breakthrough of overbought/oversold lines (we will test it in this article), the second one is at the intersection of the combined indicator and the moving average.
Let's recall the advantages of this type of pattern:
- The analysis becomes more accurate, because it takes into account the behavior of both currencies of the pair rather than one (as in previous articles here and here).
- The market entry according to these patterns is performed only on one pair, and not on the whole basket. This, in turn, gives us some other advantages:
- much less drawdown;
- greater psychological comfort for a trader and convenience in the day-to-day position management.
Research pattern
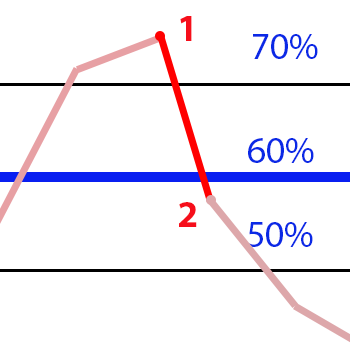
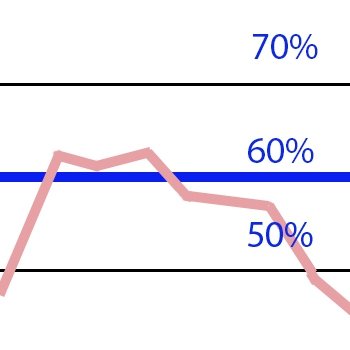
Research patterns remain the same, although we will look for them on a new combined indicators graph. First, let's have a look at the pattern of an overbought/oversold level broken through by a combined indicator graph. Let's assume that we already know the levels' positions. The pattern is well known in technical analysis and described here. We will identify it at the candle closing. It should look noticeable:
| Target pattern |
No pattern |
|
|
Tools for starting the research
As before, we use the "United WPR" indicator and tools based on it. The main indicator codes have already been shown before. In the current article, they are attached as test.zip. First, let's define the possible number of trades.
Possible number of trades
We have already determined the possible number of trades more than once. We do this to compare the results and to assess the position of overbought and oversold levels. As you may remember, the location of these levels in the parent WPR indicator is as follows:
- Overbought level - 20%
- Oversold level - 80%
But the "Combined WPR" changes from -100% to +100%, therefore the levels shift to +60% and -60%, respectively. If the number of their breakthroughs is comparable with the already obtained results, then we will assume that the levels retain their position.
We will conduct our research on H1, H4 and D1 timeframes in the following order.
- Place the testDistance.mq5 indicator on the chart. It has two other indicators available — testWPRjpy.mq5 and testWPeur.mq5.
- First, change the code of the last two indicators: each of them should work with one currency of the pair, the testDistance.mq5 indicator is placed on. For example, the testWPRjpy.mq5 indicator contains currency pairs for the JPY basket, while testWPReur.mq5 — for the EUR one. Therefore, testDistance.mq5 is placed on EURJPY.
- Place the testIndexZig-Zag1.mq5 indicator above the testDistance.mq5 indicator graph (we have already described the former in one of our previous articles). It breaks the range of testWPReur.mq5 values (from 100% to -100%) by intervals from 0 to 99 and calculates the number of breakthroughs falling within each interval. The obtained value is assumed as the testIndexZig-Zag1.mq5 indicator working result (let's call it simply "result" below) and saved to a file. Generating such a file is the main goal of the current stage. Below is the fragment of the file provided in the form of a table for more convenience:
Interval number Indicator range Min indicator value Max indicator value Number of breakthroughs ... ... ... ... ... 47 -4 -6 -4 3 48 -2 -4 -2 5 49 0 -2 0 5 50 2 0 2 7 ... ... ... ... ... - Let's analyze the resulting files.
We can work with all analyzed pairs similarly changing the testWPRjpy.mq5 and testWPeur.mq5 indicators for each of them. We will use EURJPY and EURUSD as an example.
Let's compare overbought/oversold level breakthroughs for these two pairs and for their currencies (EUR, USD and JPY) on three timeframes — H1, H4 and D1.
Most likely, there will be significantly less detected patterns than in the previously considered cases. The reason is simple: in order for the graph of this combined indicator to break through the overbought/oversold level, two events should happen simultaneously:
- a base currency is oversold;
- a quote currency is overbought,
or vice versa. In other words, it is necessary that one currency is as weak as possible, and the other is as strong as possible at the same time. This is not a very frequent situation, so the comparative number of breakthroughs will be small.
The coincidence of the two events described above may also be of a non-market nature, for example, a simultaneous release of "oppositely directed" news. In such cases, the concepts of "overbought" and "oversold" are not entirely correct, but we will stick to them in order not to complicate the matter.
The complete results of testIndexZig-Zag1.mq5 operation (generated files) are in the attached Files.zip archive. Testing was conducted on the entire available history.
Let's summarize the most significant results in the table:
Symbol |
Timeframe | ||
| D1 | H4 | H1 | |
| EURJPY | 2 / 3 | 19 / 19 | 39 / 46 |
| EURUSD | 3 / 1 | 17 / 17 | 31 / 50 |
| EUR | 5 / 1 | 15 / 16 | 67 / 73 |
| JPY | 5 / 5 | 20 / 17 | 79 / 62 |
| USD | 2 / 9 | 13 / 9 | 80 / 69 |
Let's clarify the contents:
- The first two lines are the results of testIndexZig-Zag1.mq5 operation on two selected currency pairs.
- The last three lines are the results of the testIndexZig-Zag1.mq5 indicator operation on three separate currency pair baskets. Each of the baskets is composed either for the base currency, or the quote currency of the pairs from the first two lines.
- Numerical data in the three columns to the right are the data on the number of oversold (-60%)/overbought (60%) levels found in the files from the attached Files.zip archive. For example, 80/69 means that 80 breakthroughs of level -60% and 69 breakthroughs of level 60% were detected.
Our task is to compare the data from the first two lines with the last three ones. The initial forecast for reducing the number of breakthroughs provided at the beginning of the section was justified on H1 timeframe and "failed" on H4 and D1. We can assume that H4 and D1 timeframes do not have enough breakthroughs for statistically confirmed conclusions, or perhaps we need to shift the overbought/oversold levels. But we will not do that yet. The analysis was performed in only two pairs which is insufficient for justified conclusions. Therefore, as soon as the statistics is accumulated, it may be necessary to adjust the location of overbought/oversold levels.
Nevertheless, we can draw one reasonable conclusion: as before, the number of market entries on D1 is negligible.
Starting the test
We have already tested a similar pattern. Therefore, let's use the ready-made testEAbasket2.mq5 EA implementing minimum changes to it.
- The EA calls the testDistance.mq5 indicator.
- The EA is allowed to enter the market at each pattern detection (at each overbought/oversold level breakthrough) despite already opened orders.
Let's slightly change the pattern form to increase the number of trades. Reflect these changes in the EA parameters.
- SELLPROFIT. When the combined WPR reaches this value, close all positions for basket sell. Default is 0%.
- SELL1LIMIT. This is the minimum value of the combined WPR for point 1 (see the image above) to start identifying the basket selling pattern. Default is 65%.
- SELL2FROM. Maximum value of the combined WPR for point 2 to identify the basket sell pattern. By default, 60% is an overbought level.
- SELL2TO. Minimum value of the combined WPR for point 2 for the final identification of the basket sell pattern. Default is 40%.
- BUYPROFIT. When the combined WPR reaches this value, close all positions for basket buy. Default is 0%.
- BUY1LIMIT. This is the maximum value of the combined WPR for point 1 to identify the basket buy pattern. The default is -65%.
- BUY2FROM. Minimum value of the combined WPR for point 2 to identify the basket buy pattern. By default, 60% is an oversold level.
- BUY2TO. Maximum value of the combined WPR for point 2 for the final identification of the basket buy pattern. The default is -40%.
Besides, the main indicator testDistance.mq5 applies the testWPRХХХ.mq5 indicators providing the values of the combined WPR of a certain basket. Change the last indicator calculation method from arithmetic to geometric mean. Different methods of calculating the indicator values were provided here with a detailed explanation. Here we will show only the fragment of the test indicator code responsible for the main calculation:
double m_dParam = 0.143; // 1/LG

double GetValue(int shift)
  {
   double dBuf[1];
   double res=0.0;

         res = 1;
         for (int i = 0; i < LG; i++) {
            CopyBuffer(h[i],0,shift,1,dBuf);
            if (bDirect[i]) res *= dBuf[0];
            else            res *= dBuf[0] + 100;
         }
         res = -MathPow (MathAbs(res), m_dParam);
   return (NormalizeDouble((res + 50) * 2, _Digits) );
  }
The full set of applied indicators and the EA is provided in the attached archive test2.zip.
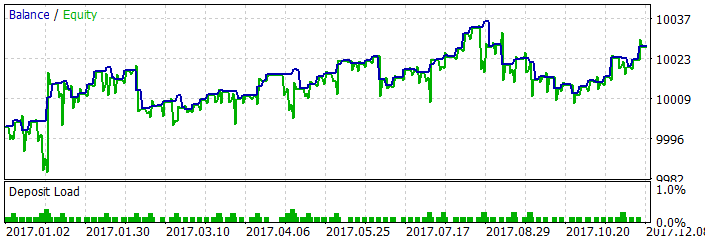
Let's start our work with EURUSD. The result for the last year:
Further tests on AUDUSD and USDJPY yield no trades. Apparently, simultaneous overbought on one currency of the basket and oversold on another are quite rare. Let's increase the number of breakthroughs by changing the pattern parameters and continue out test. The updated list of inputs is shown below.
- SELLPROFIT. No changes.
- SELL1LIMIT = 50%.
- SELL2FROM = 40%
- SELL2TO = 20%.
- BUYPROFIT. No changes.
- BUY1LIMIT = -50%
- BUY2FROM = -40%
- BUY2TO = -20%.
The EA test reports on main currency pairs are displayed in the attached archive result.zip. The obtained profit or loss is displayed in the table:
| AUDUSD | EURUSD | GBPUSD | NZDUSD | USDCAD | USDCHF | USDJPY | |
|---|---|---|---|---|---|---|---|
| H1 | -27.63 | 48.28 | 49.34 | -20.02 | -20.04 | 29.82 | -19.99 |
| H4 | -35.10 | 14.44 | 1.60 | -49.18 | -38.75 | -15 | 2.46 |
D1 timeframe shows almost no trades, therefore it is not included in the reports. On other timeframes, the trades are also scarce. Acceptable results are detected only on H1. It shows profit on three pairs (EURUSD, GBPUSD and USDCHF). Other majors show a loss, although it is not that significant and cannot be assumed the algorithm failure. Let's not forget that we tested the simplest EA version with no filtration, a single rule for market entry and a single one - for exit. Of course, this is insufficient for real trading. We may try to improve the EA and make it more efficient. Let's analyze the obtained results to find out what our next step should be in dealing with the algorithm.
Analyzing test results
The first thing we should stop at is the difference between the number of trades on H1 and H4. It is quite understandable that H4 has less trades since it has four times less candles compared to H1 for the similar interval. It might seem that the number of trades should also be four times less. In our research, this rule is somewhat adhered to: On all analyzed pairs, there are five times less trades on H4 than on H1. Since there are few trades on H1 as well, there is a question: What should we do if we want to trade on H4 following the method? There can be only one solution - "expand" the pattern even further:
- SELLPROFIT. No changes.
- SELL1LIMIT = 45%.
- SELL2FROM = 40%
- SELL2TO = 10%.
- BUYPROFIT. No changes.
- BUY1LIMIT = -45%
- BUY2FROM = -40%
- BUY2TO = -10%.
This might slightly increase the number of trades, but how can that affect profit and drawdown? Let's perform an additional test on two pairs - GBPUSD (it showed a good profit on H1) and AUDUSD (it showed a loss).
The result is obtained and connected as the archive result-1.zip. Indeed, the pattern "expansion" has expectedly increased the number of trades. Notably, the profitability/unprofitability has turned out to be "inherited" from H1 - GBPUSD saw the profit, while AUDUSD suffered the loss. But is it true that the pattern has been "expanded" and started identifying itself more frequently? Initially, the pattern appears on oversold/overbought line breakthrough. After the two "expansions", it is rather difficult to talk about a breakthrough and the new location of lines. Perhaps, traders should not look for that patterns on timeframes higher than H1 to be on the safe side.
Let's also have a look at drawdowns detected during the test. Their presence can be seen on the above screenshot depicting the EA test on EURUSD. Apart from drawdowns, we can also see that orders enter a solid profit only to return to much more modest positions later. We have already seen this when testing a similar pattern here. What are possible reasons?
- Drawbacks of the market exit rules. As you may remember, a market exit is performed when the Combined WPR breaks through its zero level. In other words, it moves into equilibrium between the base and quote currencies. Apparently, this is not enough, and we need other ways to define the exit time. But in this case, we will not apply any additional means to exclude an outside influence.
- Drawbacks of the pattern identification. We have expanded the inputs both on H1 and H4. While "expanding" the pattern, we have shifted the oversold/overbought levels up to 45-40%. Therefore, when the system automatically finds the pattern, no real oversold/overbought line breakthrough may happen yet. For example, the line may be broken for one currency only, or both currencies may oscillate around the oversold/overbought levels without actually crossing them. In such cases, the current trend probably continues and no reversal takes place. The probability of such course of events increases the more additional pattern "expansions" are performed. The wider the pattern inputs, the less significant it becomes. The described events may cause a drawdown.
Now, that the tests are complete, it is time to draw conclusions of our entire work.
Conclusion
- The pattern is not identified on D1 timeframe and rarely appears on H4. I do not recommend looking for it on timeframes higher than H1.
- We can "expand" the pattern by lowering demands for its form and quality to increase the number of possible trades. But if we overdo it, the pattern loses its power and does not reflect real overbought/oversold level breakthroughs. Therefore, expand the pattern with great care.
- Checking the pattern's profitability yielded no surprises. However, there are some promising features. No serious losses were detected on pairs, while some of them even showed profit, while in our previous tests, the H1 timeframe was completely in the red. The pattern clearly has a potential to yield a steady profit by applying standard technical means - trailing etc.
- The described pattern appears infrequently. It should be regarded as an additional signal reinforcing other patterns rather than the main tool for making market entry decisions. We will try to figure this out later.
Programs used in the article
| # | Name |
Type |
Description |
|---|---|---|---|
| 1 | test.zip | Archive |
Tools for determining a possible number of trades. |
| 2 |
Files.zip | Archive | Results of determining a number of potential market entries. |
| 3 | test2.zip | Archive | EA testing tools. |
| 4 | result.zip | Archive | Pattern testing html reports. |
| 5 |
result-1.zip | Archive |
Html reports on additional testing on H4. |