Watch the Market tutorial videos on YouTube
How to buy а trading robot or an indicator
Run your EA on
virtual hosting
virtual hosting
Test аn indicator/trading robot before buying
Want to earn in the Market?
How to present a product for a sell-through
Technical Indicators for MetaTrader 4 - 11

The PTS Divergence Finder Sell Indicator by Roger Medcalf - Precision Trading Systems.
This indicator only give Bearish - Sell Indications.
First and foremost, I have been asked many times why I did not provide a sell divergence indicator while happily providing a buy signal divergence finder for many years.
I gave the answer that sell divergences are less reliable than the buy divergences, which is still true.
Some solutions to change this were found, not by giving in to peer press
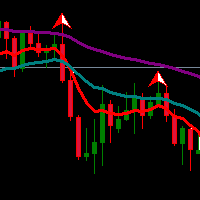
Exponential Moving Average (EMA) is an indicator that often be used by traders. Combination of two or three EMA indicators often applied to determine trend direction. Multiple EMA combined with fractals or oscillator indicator to detect overbought/oversold and divergence point also great to do in trading system.
If you like EMA indicator and want to get better indicator, highly recommended using EMA SuperTrend Strategy Indicator if you want to get better result in here:
https://www.mql5.com/
FREE

Ichimoku Signals Dashboard To test the indicator please download demo version here. Find Ichimoku signals as easy as you can. Ichimoku is one of the most powerful trends recognition indicators. And it has valid signals for the trades. This indicator scans several symbols and time-frames by the Ichimoku to find all the signals that you want and show in a dashboard. It's easy to use, just drag it onto the chart. It's better to add Ichimoku indicator to chart before adding this indicator. Ichimo

ADX indicator is used to determine the trend and its strength. The direction of the price is shown by the +DI and -DI values, and the ADX value shows the strength of the trend. If +DI is above -DI, then the market is in an uptrend, if on the contrary, it is a downtrend. If ADX is below 20, then there is no definite direction. As soon as the indicator breaks this level, a medium-strength trend begins. Values above 40 indicate a strong trend (a downtrend or an uptrend).
Multicurrency and multit
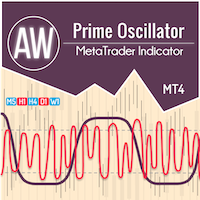
A combination of two oscillators. The first one displays the entry points, the second shows the current trend . The indicator can display oscillator signals by arrows in two modes, all fast oscillator signals or signals only in the direction of the current trend. It has a multi-timeframe panel and three types of signal notifications. Benefits: Suitable for day and scalping trading Trend filtering Simple and sensitive setup Multi-timeframe panel Suitable for integration into an advisor. Works on

Awesome MACD Indicator is a powerful trading tool that combines the strengths of Moving Average (MA) and Moving Average Convergence Divergence (MACD) to provide accurate and reliable trading signals. Designed for forex and stock traders, this indicator simplifies the identification of trading opportunities by detecting significant crosses in price movements. Key Features: MA and MACD Combination: Awesome MACD leverages the power of Moving Averages (MA) to identify short-term and long-term trends
FREE

After analyzing a numerous significant bear and bull markets, a peculiar principle has surfaced, dubbed the 5 Trend Lines Rule . It suggests that within a major bear or bull market, there are typically five false breakouts before the sixth breakout proves significant.
Parameters
Trend Line #1 Color: Magenta Trend Line #2 Color: Magenta Trend Line #3 Color: Magenta Trend Line #4 Color: Magenta Trend Line #5 Color: Magenta #1 Color: Yellow #2 Color: Yellow #3 Color: Yellow #4 Color: Ye
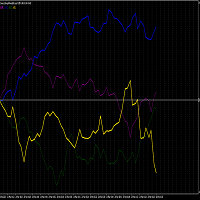
PLEASE NOTE THAT LIKE MANY SUCH INDICATORS ON THIS MARKET, THIS INDICATOR WILL NOT WORK AS A DEMO DOWNLOAD FOR STRATEGY TESTER. Therefore the 1 month option at the lowest cost allowed of $10 is available for you to test. One of the better ways to trade is to analyze individual instruments rather than in pairs. This is impossible with standard chart indicators on MT4. This volatility and strength meter allows one to trade the XAUUSD, XAUER or XAUAUD. Each instrument (not pair) is measured co
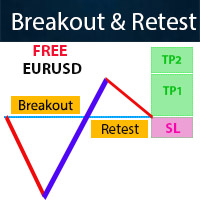
It is FREE on EURUSD chart. All Symbols version! Contact me for any questions Introduction The breakout and retest strategy is traded support and resistance levels. it involves price breaking through a previous level. The break and retest strategy is designed to help traders do two main things, the first is to avoid false breakouts. Many false breakouts start with a candlestick that breaks out of a level but ends with an immediate candlestick that brings the price back into the level. The
FREE

A "Volume Profile" is an advanced charting indicator that displays total volume traded at every price level over a user specified time period. The main components of the volume profile are POC ( Point Of Control - the price level, at which the maximum number of contracts were executed during a selected period), VAH ( Value Area High - the highest price in the Value Area) and VAL ( Value Area Low - the lowest price in the Value Area).
When we settled on the original indicator, we spent a lot o
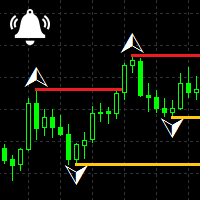
Fractals Notifier MT4 is a modification of Bill Williams' Fractals indicator. The fractal consists of two sets of arrows - up (upper fractals) and down (lower fractals). Each fractal satisfies the following conditions: Upper fractal - maximum (high) of a signal bar exceeds or is equal to maximums of all bars from the range to the left and to the right; Lower fractal - minimum (low) of a signal bar is less or equal to minimums of all bars from the range to the left and to the right. Unlike a stan

Previous Day's Close and Bar Shift Indicator for MetaTrader! The Previous Day's Close and Bar Shift Indicator is a tool designed to enhance technical analysis and decision-making in trading. With this indicator, you will have access to detailed information about the opening, high, low, and closing levels of any bar, allowing for precise and comprehensive analysis of market movements. Imagine having the ability to nest one timeframe within another, enabling detailed analysis of each bar across di
FREE

The Signal Strength Meter is a Multi-Currency, Dual Timeframe Interactive Indicator, which calculates the strength of buy and sell signals, and displays a score for each symbol on a display board. Get a 7-Day Free Trial Version: Click Here (Full Access to The Indicator for 7 Days) Check Video Below For Complete Demonstration, and User Manual here . Key Features:
Allows you to see multiple currency signals from one chart Analyses the signals from more than a dozen classic indicators Identi

Description Indicator for MT5 is here. It displays alternative (mathematically calculated) support and resistance levels, as well as the levels the price is most likely to achieve in the near future. The calculation is based on history data, and the quality of quotes is critical when generating lines. The lines built by Magneto Pro and Magneto Weekly Pro do not change on the entire calculation period.
Application Magneto Pro can be used both in conjunction with an existing strategy and as a se

AdvaneZigZag Indicator
Are you tired of the limitations of the traditional ZigZag indicator? Meet AdvaneZigZag, the ultimate tool to simplify your market structure analysis and enhance your trading strategies. Designed with flexibility and precision in mind, AdvaneZigZag brings you advanced features to navigate the market with confidence.
Key Features:
1. Enhanced Flexibility:
- While maintaining the familiar simplicity of the conventional ZigZag indicator, AdvaneZigZag offers superi
FREE

** All Symbols x All Time frames scan just by pressing scanner button ** *** Contact me after purchase to send you instructions and add you in "Divergence group" for sharing or seeing experiences with other users. Introduction MACD divergence is a main technique used to determine trend reversing when it’s time to sell or buy because prices are likely to drop or pick in the charts. The MACD Divergence indicator can help you locate the top and bottom of the market. This indicator finds Regular div

MACD divergence indicator finds divergences between price chart and MACD indicator and informs you with alerts (popup, mobile notification or email). Its main use is to find trend reversals in the chart. Always use the divergence indicators with other technical assets like support resistance zones, candlestick patterns and price action to have a higher possibility to find trend reversals. Three confirmation type for MACD divergences: MACD line cross zero level Price returns to previous H/L Creat
FREE
AW Super Trend -This is one of the most popular classic trend indicators. It has a simple setting, allows you to work not only with the trend, but also displays the stop loss level, which is calculated by this indicator. Benefits:
Instruments: Currency pairs , stocks, commodities, indices, cryptocurrencies. Timeframe: М15 and higher. Trading time: Around the clock. Shows the direction of the current trend. Calculates the stop loss. It can be used when working with trading. Three types of not
FREE

Nas100 killer V2 (See video of how we test the indicator live) 1000% non-repaint indicator appears on current candlestick. Timeframes: M5, M15, M30, H1, H4. Works on pairs such as (NAS100, US30, SPX500, and Gold) The indicator is strictly for scalping do not hold trades for too long. Orange arrows look for selling opportunities. Light Blue arrows look for buying opportunities.
Download the free version here.
A Full Concept of BUY/SELL Scalping Strategy Trend detection is one of the basic challenges of every trader. Finding a way to tell when to enter a trade is very important, timing is a game changer, not too early and not too late. Sometimes, due to not knowing the market conditions, the trader closes his positions with a small profit or allows the losses to grow, these are the mistakes that novice traders make. Indicator Trend Whipper is a complete trading st

SuperOsma Arrow is a supertrend osma based indicator that give buy and sell signals , the indicator is non repaint and it comes with a dashboard that shows signals stats.
Recommended timeframe :15 and above
Buy : Buy arrow appear on bar open , set tp and sl as drawn on chart
Sell : Sell arrow appear on bar open , set tp and sl as drawn on chart ================================ The Dashboard shows history signals info : 1.win-rate % 2.how many winners 3.how many loser 4.how many consecutive wi

Apollo Price Action System is an indicator that is completely based on the Price Action principle. The indicator gives a signal to buy or sell as soon as the conditions for entering the market are formed according to the indicator's strategy. The indicator can be used as a basic trading system or as an addition to your own trading system. The indicator can be used with any time frame but D1 is recommended. This indicator is very easy to use. You just need to follow the signals. The indicator dis

Are you looking for Price Levels and Price Channels and Price VWAP and Volume On Balance Indicators ? Now you have all in one !!! With Alarm and Push Notification. Info on your chart is showing you: where current price is and all levels, channels and vwap, how big is current On Balance Volume, is it going Bearish or Bullish, and who has the power, Buyers or Sellers. Up and down arrows showing you growing Seller or Buyer Volume. Lines showing you all Levels and Channels. Search f
FREE
Thank you for your interest in "Goldfish Indicator". I have been trading since 2008. I usually trade on Renko chart in reversal pattern with Goldfish Indicator. If you share your vps details with me, I will connect your account (Live/Demo). To get proper results copy my trades for at least 30 days. Minimum Deposit: $1000 Leverage: 100:1 Profit Target: Monthly average profit target is 10% to 20%+/- Draw-down: The average drawdown is 10% to 20% Risk
Warning: Trading financial products on margin
FREE

Detect strength for uptrends and downtrends by tracking Buy Power and Sell Power. Stay on the right side of the market by being able to determine whether the market is in a bull or bear trend and how strong the trend is.
Free download for a limited time! We hope you enjoy, with our very best wishes during this pandemic!
Trend Trigger Factor aims to ride out sideways movement, while positioning the trader in the correct side of the market to capture big trends when they occur. It was orig
FREE

Just another Auto Fibonacci Retracement indicator . However, this is the most Flexible & Reliable one you can find for FREE. If you use this indicator and you like it, please leave a review/comment. If you are looking for a more advanced Fibo indicator, check this Free Trend-Based Fibo indicator .
### FEATURES ### Auto-calculate up to 7 Fibonacci levels on your customized frame. Adjust levels as your need. Use High/Low price or Open/Close price to calculate. Freeze the levels and don't re
FREE

Introducing Spread Screener and Candle Time Indicator - your all-in-one solution for seamless forex trading analysis! Designed with traders like you in mind, this cutting-edge tool revolutionizes the way you monitor spreads and track server time across multiple currency pairs. Best of all, it's completely free to download! Spread Screener empowers you to effortlessly monitor the spread of multiple currency pairs simultaneously. No more tedious switching between charts or guessing which pairs off
FREE

Free automatic Fibonacci is an indicator that automatically plots a Fibonacci retracement based on the number of bars you select on the BarsToScan setting in the indicator. The Fibonacci is automatically updated in real time as new highest and lowest values appears amongst the selected bars. You can select which level values to be displayed in the indicator settings. You can also select the color of the levels thus enabling the trader to be able to attach the indicator several times with differe
FREE

*This is tradingview bot converted to mql4*
The UT Bot Alert Indicator is an advanced technical analysis tool designed to help traders optimize their trading performance. This innovative indicator is based on the proven UT Bot system, which utilizes multiple indicators to deliver accurate signals that can help traders make better decisions. The UT Bot Alert Indicator provides a range of features that can help you stay on top of market trends and capitalize on opportunities. Here are some of i
FREE

The swing continuation pattern happens in a trend direction after a short reversal / pull back . As the name suggests , these patterns occurs along the swing high and swing lows of a trend , this makes the patterns very low risk patterns with potential high rewards . The swing continuation indicator also combines Currency Meter as a filter for its execution. The idea is to go with both the price trend flow and currency trend flow. Which means the price action must be supported by the currency st
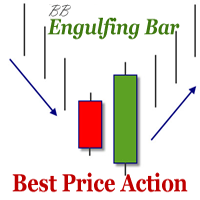
The indicator defines the Bullish and Bearish Engulfing Bar. The pattern has greater reliability when the open price of the engulfing candle is well above the close of the first candle, and when the close of the engulfing candle is well below the open of the first candle. For an engulfing bar to be valid it must fully engulf at least one previous bar or candle - includes all the body and the wick. The engulfing bar can engulf more than one bar as long as it completely engulfs the previous bar.
FREE

The Chart High Low Indicator is an indicator for META TRADER 4, with the function of analyzing and showing the weekly MAXIMUM, weekly MINIMUM, monthly MAXIMUM and monthly MINIMUM levels.
This can help a lot when creating TrendLine or even plotting your FIBONNACI line, as there is no need to access Internet sites to analyze the MAXIMUM/MINIMUM levels. In graphical analysis, it can assist in breaking HIGH/MIN levels, creating support and resistance breakOuts. There are "mark" functions on the i
FREE
This is a Multi pair and Multi time frame dashboard. The founder of the system is Mr. Oma Ally, which is a system based from Bollinger Band and Moving Average(BBMA). BBMA consists of the use of 2 indicators: Moving Averages Bollinger Bands BBMA consists of 3 types of entries: Extreme MHV Re-Entry Rejection EMA50 This Dashboard Help you to scan current Extreme, Reentry setup, Rejection EMA50 and also MHV How to read signals:
find the same color in 3 different timeframes in succession
For exam
FREE
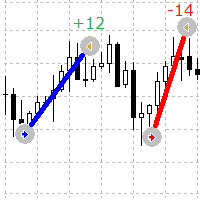
A simple yet useful indicator to visually see the entry and exit points of orders on the chart
This indicator shows current open orders and completed orders on symbol
Indicator parameters Lines Buy color - specifies color of lines for buy orders Lines Sell color - specifies color of lines for sell orders Lines Width - sets the line width, works for Solid style types Lines style - sets the style of lines Lines positive profit color - sets the color for positive profit texts Lines negative profi
FREE

Keltner Channel is a well known indicator that not in MT4's indicators default lineup (You can get this from your broker somehow). This indicator helps you to define trend and sometimes overbought/oversold prices during flat trend. Input Description: EMAperiod: Moving Average period used for indicator. Must be higher than 1. ATRperiod: Average True Range period used for indicator. Must be higher than 1. multiplier: Multiplier used for determine channel's wide. Must be higher than 0 but may not b
FREE

COLORED TREND MA / MACD CANDLES draw MA Candles above/below Moving Average in a single color draw MA as a leading Line like a Supertrend draw MA as a Channel => MA High and Low draw MACD Candles above and below 0 and Signal-Line
Your Advantage: a simple view of the trend direction a simple view over the higher trend direction a calmer chart for the eye clear rules can be defined Settings: Bars to process : 6000 is my default, this value is up to you Value Quick-Set : pre-Settings MACD 12 / 26
FREE

This is the free version of the Supply&Demand + Trendline + Trend tool. This version works only with EURCHF! You find the full version here: https://www.mql5.com/en/market/product/67274
PAAIOS stands for Price Action All In One Solution. And that is the purpose of the Indicator. It should give you a tool to improve your trading decisively because you get the crucial information at a glance. The indicator simplifies the search for strong signals. It shows trend lines, demand and s
FREE
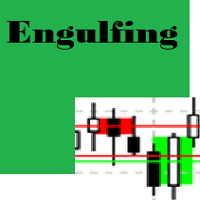
Engulfing Candle Detector
Detectable pattern Double Candlestick Patterns Bullish Engulfing
The first candle is black candle. The second candle opens with a gap below the real body of the black candle but rallies upwards to close above the real body of the black candle. In other words, the second candle's real body completely engulfs the first candle's real body Bearish Engulfing
The first candle is white candle. The second candle opens with a gap above the real body of the white candle but
FREE

Head and Shoulders Pattern Indicator - Your Key to Recognizing Trend Reversals Unlock the power of pattern recognition with the "Head and Shoulders Pattern Indicator." This cutting-edge tool, designed for MetaTrader, is your trusted ally in identifying one of the most powerful chart patterns in technical analysis. Whether you're a novice or an experienced trader, this indicator simplifies the process of spotting the Head and Shoulders pattern, allowing you to make informed trading decisions. Key
FREE

The Price Action Finder Multi indicator is an indicator of entry points that searches for and displays Price Action system patterns on dozens of trading instruments and on all standard time frames: (m1, m5, m15, m30, H1, H4, D1, Wk, Mn). The indicator places the found patterns in a table at the bottom of the screen. By clicking on the pattern names in the table, you can move to the chart where this pattern is located. Manual (Be sure to read before purchasing) | Version for MT5 Advantages
1. Pa

This product is optimally used for scalping. It is a trend following system, it understands that the trend is your friend. It takes advantage of the buying/selling after the pullback in continuation of the current trend wave. It works by analyzing dynamic support and resistance, and is based on the Ichimoku Indicator variables which is know to be the most consistent & holistic indicator out there. Settings can also be adjusted to suite the market conditions. -> can be adjusted for longer term
WONNFX iN M5 - Arrow indicator for Forex and Binary Options. Reliable signal algorithm. Indicator not repaint. Indicator working hours: 21:55-23:00. GMT+2. Average winrate = 60-70%.
Recommendations: Timeframe: M5. Expiration: 2-3 candles (1 candle = 5 minutes) Symbol: EURUSD, USDJPY, EURAUD, GBPAUD, EURJPY, AUDUSD, USDCAD, NZDUSD, AUDCAD, AUDCHF, AUDJPY, AUDNZD, CADJPY, EURCAD, EURGBP, GBPUSD, GBPCAD, NZDJPY, CADJPY, XAUUSD
FREE

This indicators automatically draws the Support and resistances levels for you once you've dropped it on a chart. It reduces the hustle of drawing and redrawing these levels every time you analysis prices on a chart. With it, all you have to do is dropped it on a chart, adjust the settings to your liking and let the indicator do the rest. But wait, it gets better; the indicator is absolutely free! Get the new and improved version here: https://youtu.be/rTxbPOBu3nY Parameters Time-frame -> T
FREE

Th3Eng PipFinite PRO Indicator This product is distinct from the Th3Eng PipFinite Original, utilizing a different logic and algorithms. The Th3Eng PipFinite Pro indicator offers analysis of trend directions using custom algorithms. It provides indications of trend direction, entry points, a stop loss point, and three take profit points. The indicator also displays pivot points, dynamic support and resistance channels, and a side-box with detailed current signal information.
How to Trade with

Cyclical indicator for trading and predicting the direction of the market. Shows the cyclical behavior of the price in the form of an oscillator.
Gives signals for opening deals when rebounding from the upper and lower boundaries of the oscillator. In the form of a histogram, it shows the smoothed strength of the trend.
Will complement any trading strategy, from scalping to intraday. The indicator does not redraw. Suitable for use on all symbols/instruments. Suitable time frames for short-term

Scalping Indicator Pro is a powerful indicator that works in trend as well as non trending market conditions. This indicator is perfect for scalp trades as well as swing trades. Scalping Indicator Pro is not just an indicator, but a trading strategy itself. It doesn't requires any additional indicators for the trading setup.
Check out the indicator in action. [Video demonstration below]
Why use Scalping Indicator Pro? Great for novice traders as well as experienced traders. Low risk entrie

MP Squeeze Momentum is a volatility and momentum indicator derivated of "TTM Squeeze" volatility indicator introduced by John Carter. It capitalizes on the tendency for price to break out strongly after consolidating in a tight range. Introduction: The volatility component of MP Squeeze Momentum measures price compression using Bollinger Bands and Keltner Channels. If the Bollinger Bands are completely enclosed within the Keltner Channels, that indicates a period of very low volatility. This st
FREE

A top and bottom indicator that can intuitively identify the trend of the band. It is the best choice for manual trading, without redrawing or drifting. How to get this indicator for free: Learn more Price increase of $20 every 3 days, price increase process: 79--> 99 --> 119...... Up to a target price of $1000. For any novice and programming trading friend, you can write the signal into the EA to play freely. Array 3 and array 4, for example, 3>4 turns green, 3<4 turns red. If you don't underst

Support and Resistance zones indicator for MT4 is a multi-timeframe panel and alert that finds support and resistance zones and pivot points for all timeframes of MetaTrader 4 and gives alert when price has interaction with them. Download demo version (works on GBPUSD, EURJPY and NZDUSD symbols) Read the full description of scanner parameters in the blog page . Many unique features in one indicator:
Integrating support and resistance zones and pivot points in one indicator with powerful filte
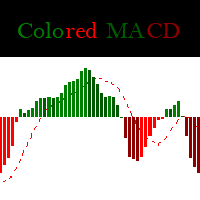
The Normale MACD have 2 Corlors ( 1 for MACD Histogram and 1 for the Signal Line )
This version of Macd have 5 Colors ( 4 for MACD Histogram and 1 for the Signal Line ) : - When the MACD get a Positive higher value - When the MACD get a Positive Lower value - When the MACD get a Negative higher value - When the MACD get a Negative Lower value
This version have the same input like the normal one : * Fast EMA Period * Slow EMA Period * Signal SMA Period * Applied Price
FREE

A combined indicator of two famous indicators: RSI , Bollinger Bands Can be used in all currency pairs Can be used in all time frames with many signals Very simple and fast to use
Description:
This indicator is made from the combination of RSI and Bollinger Bands indicators
As you can see, it shows good signals and is worth using and testing
We hope you are satisfied with this indicator
Settings: show past show candle: Displays the number of candles that the indicator calculates.
For
FREE

GAP DETECTOR
FVG in trading refers to "Fair Value Gap", . It is a concept used in technical analysis to identify areas on a price chart where there is a discrepancy or gap between supply and demand. These gaps can occur due to rapid movements in price, usually as a result of important news or economic events, and are usually filled later as the market stabilizes. The GAP DETECTOR indicator is designed to identify fair value gaps (FVG) on the price chart and filter them using volatility to det
FREE
Magic Supply Demand Indicator works on all products and timeframes. It is a new formula, and the very new features are two zone strength functions adjustable by user input! This is a great advantage in trading. When you learn how to use the proprietary features such as the zone strength with min X-factor of price travel away, you will be able to tell whether the zone is strong or not.
The supply and demand zones are used as an alert trigger. You can use popup alert with sound on MetaTr
FREE

I recommend you to read the product's blog (manual) from start to end so that it is clear from the beginning what the indicactor offers. This multi time frame and multi symbol supply and demand zone dashboard indicator sends alerts when the price has reached a supply/demand zone. It is also possible to use it to be alerted about regular double tops/bottoms instead of zones. It can be used with all time frames from M1 to MN. It is possible to use RSI, divergence (MACD, OsMA, RSI or Awesome) a

TDI Multi Timeframe Scanner: This Dashboard indicator uses the TDI (Trader's Dynamic Index) Indicator to find best trades. Extra indicators and detailed description is here: https://abiroid.com/product/tdi-scanner-dashboard
Checks for: - SharkFin Pattern Free indicator for SharkFin: https://www.mql5.com/en/market/product/42405/ - TDI Trend: Strong/Weak Trend Up/Down - TDI Signal: Strong/Medium/Weak Signal for Buy/Sell - Consolidation - Overbought/Oversold - Volatility Bands - Previous Day/Week

Dashboard uses Ichimoku Strategy to find best trades. Get extra Indicators/Template: And read more about detailed Product Description and usage here: https://www.mql5.com/en/blogs/post/747457
Please note: I won’t be able to add new settings. It already has 72 settings Some people are using it with their EAs. And iCustom function can only take Max 64 settings. So, I cannot let it grow any further.
I’ll definitely be maintaining the code and solving issues. Don’t worry Please check all

How to Create an Automated Trading Robot Have you ever wondered how powerful it would be to automate your trading strategies with just a few clicks of the mouse? Imagine having the freedom to create and test different trading strategies without the need to dive into complicated code. With Rule Plotter, this vision becomes a reality. Here we will explore how you can create your own custom trading robot using Rule Plotter, a trade-system creation tool that simplifies the entire process. What is Ru
FREE

MT5 Version Available Here: https://www.mql5.com/en/market/product/50048
Telegram Channel & Group : https://t.me/bluedigitsfx
V.I.P Group Access: Send Payment Proof to our Inbox
Recommended Broker: https://eb4.app/BDFXOsprey *All In One System Indicator, Breakthrough solution for any Newbie or Expert Trader! The BlueDigitsFx Easy 123 System makes it easy to identify important areas of market structure. It alerts you to changes in market structure which typically occur when a reve
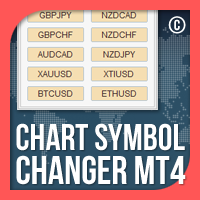
Chart Symbol Changer for MT4 is an indicator/utility that offers you the option to change the current chart symbol that is attached onto with a click of a symbol button on its panel. Chart Symbol Changer for MT4 gives you the option to configure the 32 symbol buttons to your personal preference, by adding the pairs you want to keep any eye on and trade the most. This way you will never miss an opportunity, because you can have a faster view of the market on your chart with just a few clicks.
FREE
This indicator was developed to facilitate the analysis of BBMA Oma Ally strategy In the previous version, it's almost similar scanner indicator was built the indicator identifies the basic pattern of BBMA Oma Ally (reentry, MHV, rejection EMA50 and extreme) To get information on the chart, please download the BBMA Labels indicator via this link In BBMA Oma Ally advanced strategy, to validate reentry on a major timeframe, a "full setup" is required on a lower timeframe
The full setup structu
FREE

Introduction
The Price Action, styled as the "Smart Money Concept" or "SMC," was introduced by Mr. David J. Crouch in 2000 and is one of the most modern technical styles in the financial world. In financial markets, Smart Money refers to capital controlled by major market players (central banks, funds, etc.), and these traders can accurately predict market trends and achieve the highest profits.
In the "Smart Money" style, various types of "order blocks" can be traded. This indicator

The channel indicator is trending and does not repaint. It creates an ATR price channel with the opposite volatility border. The indicator has proven itself well in the strategy of trading on impulse levels and fake breakout. The entry point should be looked for on the correction to the indicator line, and the take profit should be set on the opposite border.
Blog-Link - Retest and Fake Breakout with UPD1 .
Input parameters.
Bars Count - history to display. ATR - average true range peri
FREE

Are you tired of drawing trendlines every time you're analyzing charts? Or perhaps you would like more consistency in your technical analysis. Then this is for you. This indicator will draw trend lines automatically when dropped on a chart. How it works Works similar to standard deviation channel found on mt4 and mt5. It has 2 parameters: 1. Starting Bar 2. Number of bars for calculation The starting bar is the bar which drawing of the trend lines will begin, while the number of bars for c
FREE

The VWAP Level indicator is a technical analysis tool that calculates the weighted average price for the traded volumes of a specific asset. The VWAP provides traders and investors with the average price of an asset over a specific time frame.
It is commonly used by investors to compare data on "passive" trading operations, such as pension funds and mutual funds, but also by traders who want to check if an asset has been bought or sold at a good market price.
To calculate the VWAP level we
FREE

QualifiedEngulfing Is Free Version Of ProEngulfing Indicator ProEngulfing Is Paid Version Of This Indicator Download It Here . What is Different Between free and paid version of ProEngulfing ? Free version has limitation of One Signal Per Day Join Koala Trading Solution Channel in mql5 community to find out the latest news about all koala products, join link is below : https://www.mql5.com/en/channels/koalatradingsolution Introducing QualifiedEngulfing – Your Professional Engulf Pattern In
FREE

The indicator displays volume profiles based on the nesting principle. Profiles periods are pre-set so that each subsequent profile has a length twice as long as the length of the previous profile. In addition to profiles, the indicator displays volume clusters sorted by color, depending on the volume they contain.
Indicator operation features The indicator works on typical timeframes from M5 to MN, but for calculations uses historical data from smaller timeframes: M1 - for timeframes from M5
FREE

This indicator is the converted Metatrader 4 version of the TradingView indicator "ATR Based Trendlines - JD" by Duyck. This indicator works by automatically and continuously drawing trendlines not based exclusively on price, but also based on the volatility perceived by the ATR. So, the angle of the trendlines is determined by (a percentage of) the ATR. The angle of the trendlines follows the change in price, dictated by the ATR at the moment where the pivot point is detected. The ATR percentag
FREE

MQLTA Support Resistance Lines is an indicator that calculates the historical levels of Support and Resistance and display them as Lines on chart. It will also Alert you if the price is in a Safe or Dangerous zone to trade and show you the distance to the next level. The indicator is ideal to be used in other Expert Advisor through the iCustom function. This indicator can be tested LIVE on AUDNZD with the following DEMO https://www.mql5.com/en/market/product/26572
How does it work? The indicat
FREE

Overview
The Volume SuperTrend AI is an advanced technical indicator used to predict trends in price movements by utilizing a combination of traditional SuperTrend calculation and AI techniques, particularly the k-nearest neighbors (KNN) algorithm.
The Volume SuperTrend AI is designed to provide traders with insights into potential market trends, using both volume-weighted moving averages (VWMA) and the k-nearest neighbors (KNN) algorithm. By combining these approaches, the indicat
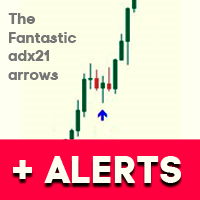
.See screenshots of the indicator. Uses information about the current trend. It is based on the classic ADX indicator. Gives a signal to enter a trade using a non-standard strategy.
Settings: Name Description Period of ADX The period of the classic ADX indicator Distance between +D & -D lines Distance between + D and -D lines . Determines the strength of the trend. Freshness of the signal (bars) Checking the freshness of a buy or sell signal.
Selects the very first signal in the span.
The nu
FREE
Do you know why the MetaTrader Market is the best place to sell trading strategies and technical indicators? No need for advertising or software protection, no payment troubles. Everything is provided in the MetaTrader Market.
You are missing trading opportunities:
- Free trading apps
- Over 8,000 signals for copying
- Economic news for exploring financial markets
Registration
Log in
If you do not have an account, please register
Allow the use of cookies to log in to the MQL5.com website.
Please enable the necessary setting in your browser, otherwise you will not be able to log in.