CatFx50 5 Minute Testing
My times will always be in Eastern Standard Time. I will post pictures as much as possible. My settings are the same as Nina recommends. I have changed nothing but the time frame which I make the trades on. When you post please follow the convention I have outlined here.
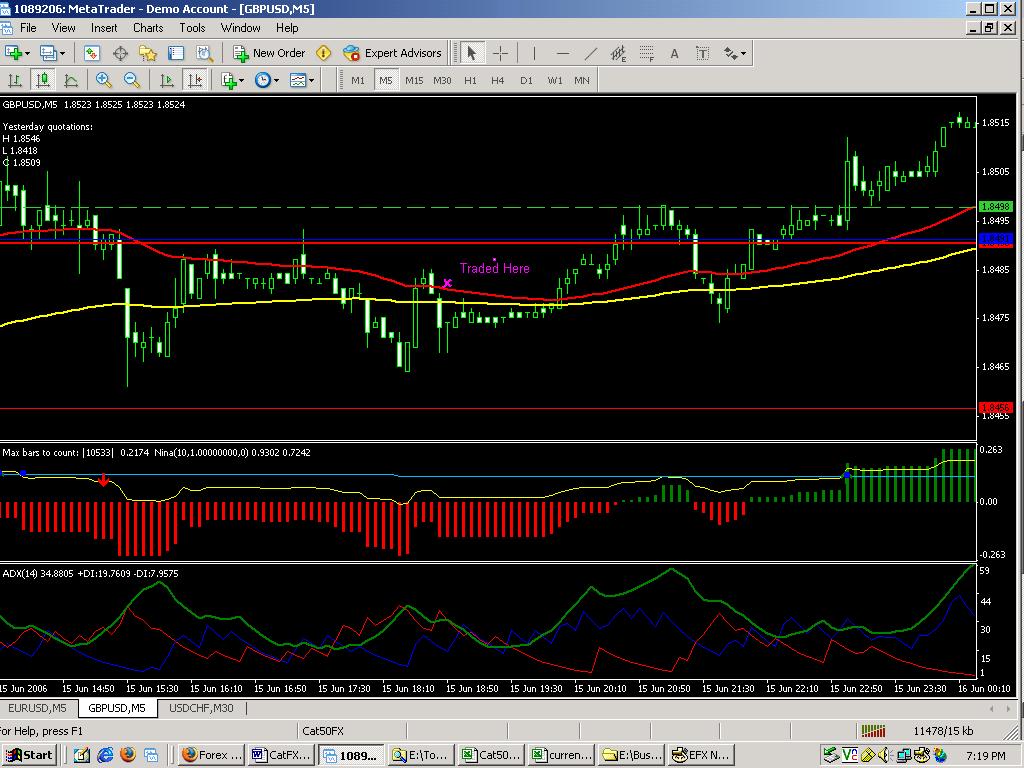
1st Trade:
Position: Short
Value: 1.8479
Time In: 6/15/06 14:43
Time Out: 6/15/06 15:08
Profit: 2 pips
Level: 1
Comments: I could have made over 10 but it went against me quickly. I think that going for 10 pips is good with 5 minute charts. definately a scalping strategy.
JesseBoy, great sub thread, I am a newbie try to learn the system, Thnx, Any change in your setting different than Nina?
Hi Jesseboy,
Your idea sounds very appealing and I will contribute as much as possible. I think it's very interesting to see if CatFX50 will work in other time frames.
BTW, for an EMA to be equivalent to the EMA 50 used in the 30 minute version - to accurately consider the same historical price data - it should be multiplied by 6.
That means the EMA 50 of the 30 minute time frame becomes an EMA 300 in the 5 minute time frame, to reflect the same historical price data.
moneyline
no moneyline, i think we should only consider ema 50 on 5 minutes not ema 300 on 30 min ,by the way you should not multilpy 50*6 ,you should devide 50/6 i think if you want to plot ema 5min on 30 min chart
should be profitable but with scalping metods :if trade dont go our way quick close for small lose not biger than 10 pips.for profit consider trend bands exit for 1 lot and other lot trailing stop or some pivot point
sorry for last post i did not see you want to plot ema 50 from 30 min in 5 min chart
sorry for last post i did not see you want to plot ema 50 from 30 min in 5 min chart
Hi Deepdrunk, thanks for your input. Yeah, if we don't work with the same price data of CatFX50 (as in the 30 minute version) then this 5 minute version will not be reflecting the same method.
Leaving the EMA at 50, it would then become an EMA 8.33 in the 5 minute version. The EMA50 used in the 30 minute version looks at the price data 25 hours into the past to make its calculations. If left at 50, the EMA for the 5 minute version will only be looking into the past about 4 hours and 20 minutes (5 minutes x 50).
I think this is a very fundamental distinction. The use of the EMA 50 by Nina came very well documented from much observation, maybe years. Leaving the 5 minute version at 50 means it will not be operating on the same price data.
moneyline
Comments: I could have made over 10 but it went against me quickly. I think that going for 10 pips is good with 5 minute charts. definately a scalping strategy.
Hi,
I don't think CatFX50 was ever designed to be a scalper's tool. It works best in a trending or gently ranging market. Matter of fact, CatFX50 isn't good in a scalper's market and will perform poorly.
Most scalpers can handle a flat and very tightly ranging market, those are conditions most unsuitable for CatFX50.
moneyline
edit. this is true. I had forgotten this concept on the 30 to 5 min charts
Hi Jesseboy,
Your idea sounds very appealing and I will contribute as much as possible. I think it's very interesting to see if CatFX50 will work in other time frames.
BTW, for an EMA to be equivalent to the EMA 50 used in the 30 minute version - to accurately consider the same historical price data - it should be multiplied by 6.
That means the EMA 50 of the 30 minute time frame becomes an EMA 300 in the 5 minute time frame, to reflect the same historical price data. moneylineIf price is in a strong consolidation market (tight range and very choppy) and you start to have many false signals, then the common mistake people make is trying to zoom in on price.
You need to do the contrary. You need to zoom out on the price. Meaning, go to higher time frames 60min, 4h or day charts.
I hear you thinking that automatically the effect of this will be hardly no trades or maybe no trading at all...
Indeed. In this market one needs to prevent of taking to many losses. In normall conditionsthe lower time frames have already the tendency to have to much noise. So thats why you go to 30min. To have not so much noise.
In this strong consolidation market the noise on the lower time frames is even bigger then normall. With a lott of small losses as result wich ad up to a big loss at the end of the day.
So don't try to earn money in this market, try to escape to many losses. That on itself is already a skill.
regards...iGoR
A litlle trick that could help you with your problem:
the average daily range over the last 5 days on eur/usd 90, on usd/chf 98 and on gbp/usd 128.
the average daily range over the last 20 days on eur/usd 115, usd/chf 128 and on gbp/usd 173. So that makes that the average daily range on the short term, is nearly 1/3 less.
Stand on the sideline till you see that the average daily range over the last 3 days is bigger then the average daily range over the last 20 days.
You wan't die of not trading for a few days. You will think that you will not make any money, but you deffently will not lose any money (wich is more lickely in narrow ranges).
It takes also discipline NOT to trade.
regards...iGoR
- Free trading apps
- Over 8,000 signals for copying
- Economic news for exploring financial markets
You agree to website policy and terms of use
I wanted to dedicate an area to 5 minute testing of Nina's CatFX system. Please post your results here. The key will be to include shorter stops and more of a watchful eye of the market. good luck
jesseboy