About the MT5 code profiler
Backtest running at:
2021.07.10 08:00: 37.101 Core 01 EURUSD, H1: 230861 ticks, 998 bars generated. The test passed in 0: 03: 09.367 (including pre-processing of ticks 0: 00: 00.515).
I added code to measure the execution time of SymbolInfoTick () using GetMicrosecondCount ().
       ulong start= GetMicrosecondCount ();

       //--- Get tick information
       if (! SymbolInfoTick (symbol,tick))
         return ( false );

      BENCH += GetMicrosecondCount ()-start;
Result:
2021.07.10 08:00: 37.101 Core 01 2021.05.30 23:59:59 Total = 1209572 Executed = 836973 in 661874 microseconds
Thus, SymbolInfoTick () took a total of 661 milliseconds on the historical data in 3 minutes and 9 seconds. However, the profiler shows that it uses 74.71% of the measurements. How accurate or useful this is, I don't understand.
Another example of strange data.

According to the global statistics, SymbolInfoTick () was in the call stack 209 times. But inside the code, it says 210. Good precision.
According to the global statistics, SymbolInfoTick is sampled 209 times (which is 0.83% of all samples). OK. Now the code data says it reaches it 1 time (which is now 1.49%, so if you look at the other total, what is it?). Once calculated, 1 equalling 1.49% means that the total quantity (100%) is 67. Thus, 1.49% refers to OnTimer (), which is the main function in this case. But how can there be 1 there and 209 in the global statistics?
Even if it's not an error, how can it be quickly useful (which a profiler should be, in my opinion)?
Another one
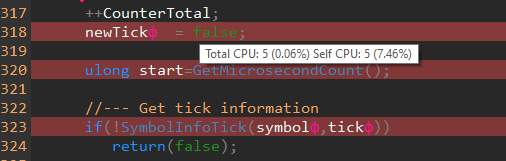
This is a line of code over SymbolInfoTick (), as shown earlier. So, an assignment like newTick = false was "selected" 5 times! Another 5 times after calling SymbolInfoTick () ( 1 - 1.49%)? Jokes aside ?
Ask yourself what it is and what the difference is:
- Sampling-based profiling (as we have now, similar to Visual Studio C++ and others)
- Code tooling-based profiling (as we used to do)
Ask yourself what it is and what the difference is:
- Sampling-based profiling (as we have now, similar to Visual Studio C++ and others)
- Profiling based on code instrumentation (as we had before)
The difference is obvious.
The problem is using it in practice with inconsistent data and errors.
Another example of strange data.
According to the global statistics, SymbolInfoTick () was in the call stack 209 times. But inside the code, it says 210. Good precision.
According to the global statistics, SymbolInfoTick is sampled 209 times (which is 0.83% of all samples). OK. Now the code data says it reaches it 1 time (which is now 1.49%, so if you look at the other total, what is it?). Once calculated, 1 equalling 1.49% means that the total quantity (100%) is 67. Thus, 1.49% refers to OnTimer (), which is the main function in this case. But how can there be 1 there and 209 in the global statistics?
Even if it's not an error, how can it be quickly useful (which a profiler should be, in my opinion)?
The screenshot shows the stats for the calling string, not the SymbolInfoTick function.
In total, the given string was measured 210 times, once there was a "stop" exactly on the string, before the call of SymbolInfoTick or just after, and 209 times as the return string from SymbolInfoTick
Another one
This is a line of code over SymbolInfoTick (), as shown earlier. So, an assignment like newTick = false was "selected" 5 times! Another 5 times after calling SymbolInfoTick () ( 1 - 1.49%)? Jokes aside ?
I don't quite understand what's written.
To read this screenshot: the string was "stopped" 5 times, of the total load this is 0.06%, for the code of the function to which the string belongs this is 7.46%
The "Self CPU" counter displays the effect of the string code on the speed of the function in which the string is located.
Importantly, the time of the function called in the string is not counted by this counter, maybe this is wrong, let's think.
The "Total CPU" counter shows the effect of the string code on the entire program, and this counter takes into account the functions called in the string.
I don't quite understand what it says.
The way you should read this screenshot is this: the line is "stopped" 5 times, of the total load it is 0.06%, for the code of the function the line belongs to it is 7.46%
Yes, I know. (Sorry for my previous tone, I got a bit angry).
The problem is :
newTickф = false ; // Total CPU : 5 (0.06%) Self CPU : 5 (7.46%)
so far
if (! SymbolInfoTick (symbolф,tickф)) // Total CPU : 210 (2.57%) Self CPU : 1 (1.49%)
General CPU is fine.
But as for Self CPU, how is it possible that "newTick = false" equals 5 and a function call like SymbolInfoTick () equals only 1? It doesn't make sense to me.
- Free trading apps
- Over 8,000 signals for copying
- Economic news for exploring financial markets
You agree to website policy and terms of use
I have started to use a new profiler. In this section we could centralise information on how to use it properly.
To start with I have some questions about strange things about the data returned by the profiler.
The profiling report that is used in an EA running on historical data:
2021.07.08 15:43:06.269 MQL5 profiler 139098 total measurements, 0/0 errors, 320 mb of stack memory analyzed (92848/1073741824)
2021.07.08 15:43:06.269 MQL5 profiler 982065 total function frames found (279627 mql5 code, 122460 built-in,571051 other, 8927 system)
Results (Functions by call):
Q1. The report says 139098 measurements, but OnTick () Total CPU is 150026, how is this possible? (but CopyHistoryData 80087 as 57.58% correctly means 100% = 139098).
Q2. The report says 571,051 other "functions". What are these functions if they are not mql, embedded or system functions?
Q3. CopyHistoryData shows 80087 Total CPU, with 3 reported function calls (CopyHigh, CopyLow, CopyTime) having different total CPU, ok. However, the native CPU for these functions is the same and equal to the total CPU (call stack). This seems to be incorrect as at 80087 (stacks) for CopyHistoryData the sum for 3 functions is 62,161 (44286 + 9448 + 8427), how can it be that with 62,161 calls it reveals 80,087 pauses in these 3 functions? Impossible, the only explanation is that this number is global for CopyHistoryData and therefore useless. Am I missing something?