GIGFX Technical Analysis Report For Majors (Updated Daily)
EURUSD
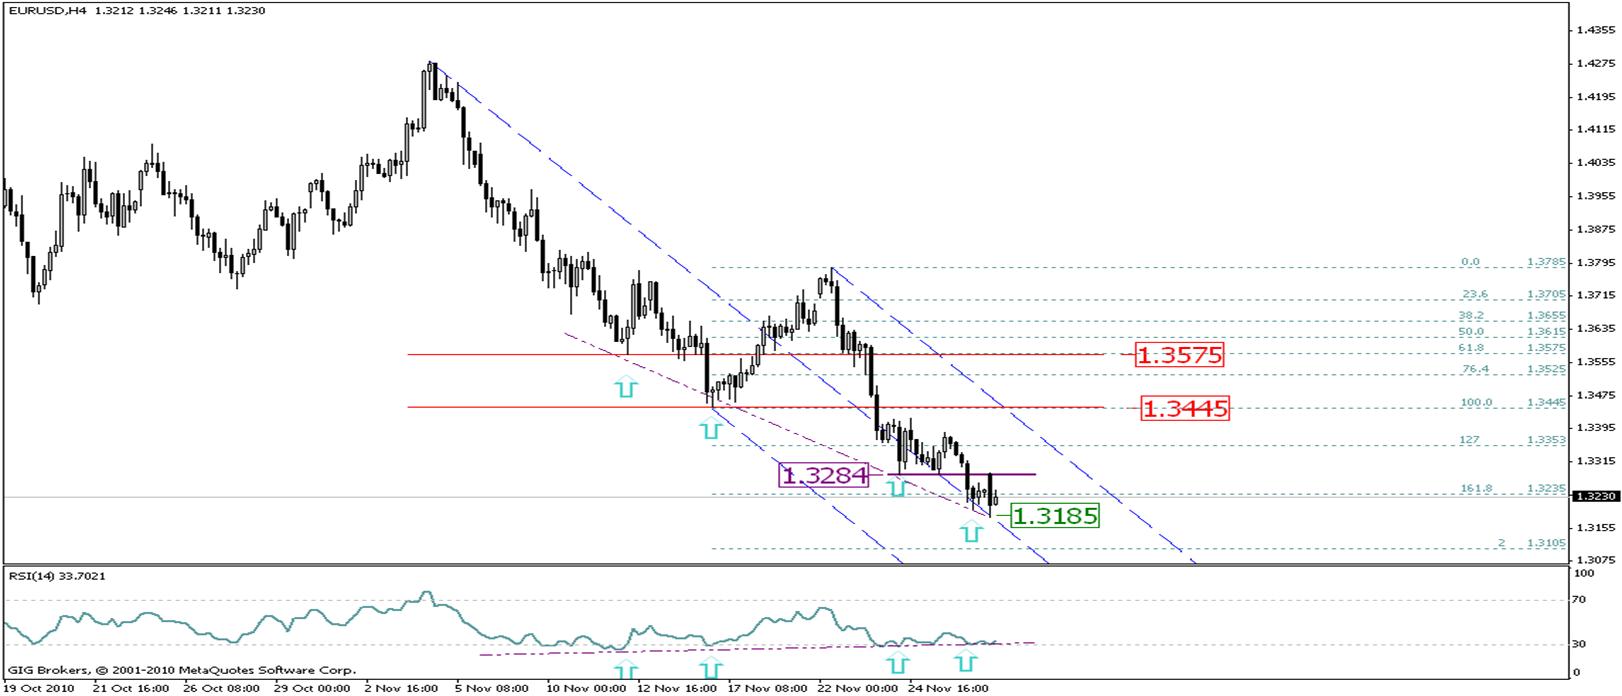
European debt crisis still controls the trades of the pair during the last medium period, whereas, the European currency achieved a lower price against the U.S dollar with each statement that includes the failure of the negotiations about resolving the European debt crisis. Through the last week report it was mentioned that, the pair will continue falling once breaking the level 1.3284 and this what is confirmed already and the pair continued falling to reach the support level 1.3235 which represents 161.8% continuous level for the bullish wave (from 1.3445 to 1.3785), with the beginning of this week trades, the pair formed a bullish gap with approaching resolving the Irish financial problems, but the pair returned back and covered the whole gap and achieved a lower price at the level 1.3185. with noticing the price movement and the movement of the RSI index, it will be clear that, the positive divergence that reflects the direction is still continuous till now, so, during the upcoming trades with the new European good news it is expected that, the pair will use the formed bottom at the level 1.3185 to rise again in order to retest the resistance level 1.3284 which with its breaking, the pair will continue rising to reach the resistance level 1.3445 which expected to be coincides with the Pitchfork top line.
The stability of these expectations needs the stability of the support level 1.3185.
Res. 1.3340 1.3432 1.3502
Pivot 1.3270
Sup. 1.3178 1.3108 1.3016
[ATTACH]7333[/ATTACH]
GBPUSD
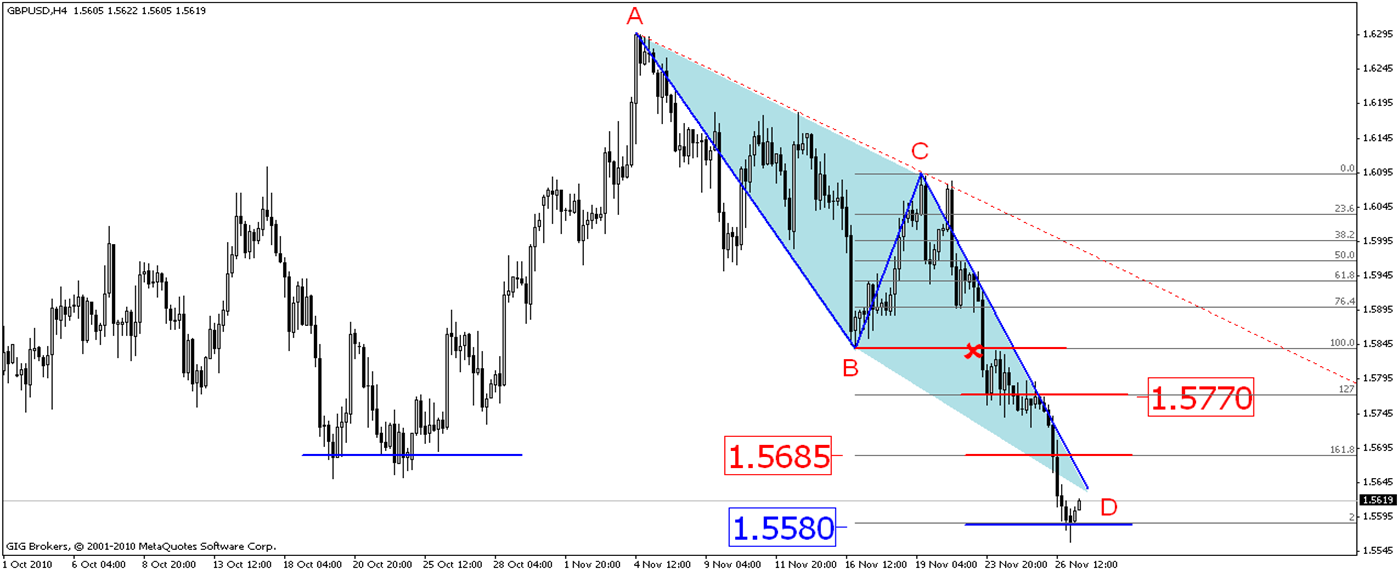
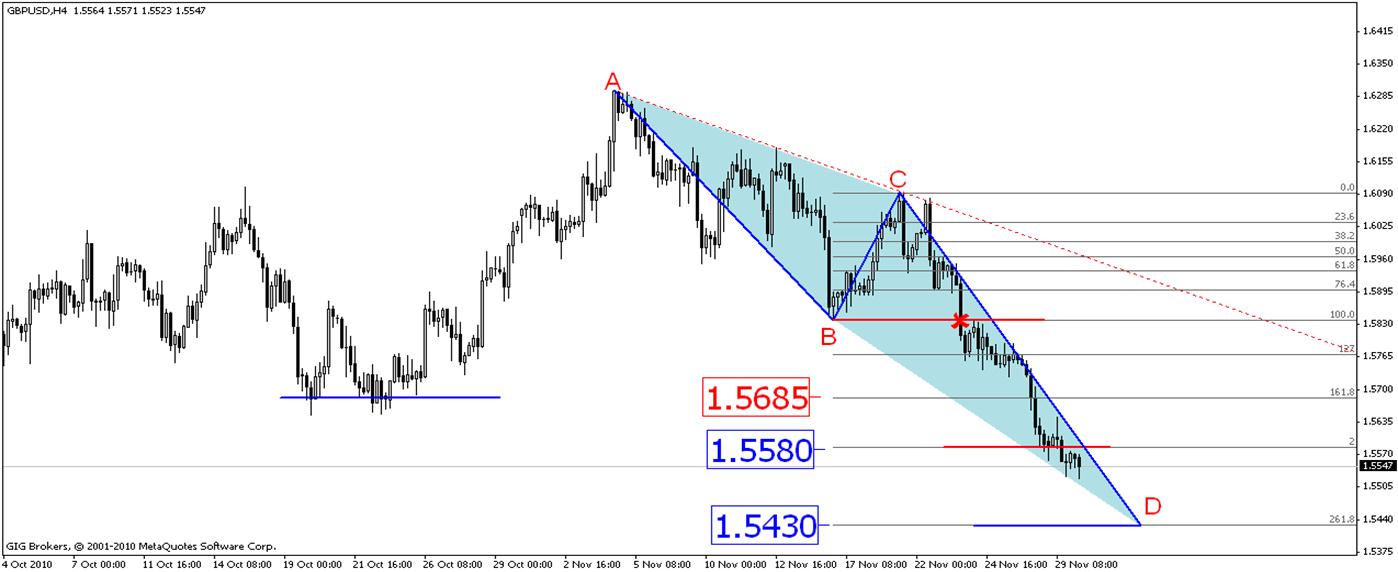
As it was expected, the pair continued falling during the whole trades of the end of the last week to reach the support level 1.5580 to test it which represents 200% continuous level, this level is still stable against the pair testing till now, it is expected that, the bearish direction will continue for the short period, but it will be a corrective reflection for this bearish movement during the intraday trades of today targeting the resistance level 1.5685, if the pair was able to break this level up, then, it will target the resistance level 1.5770.
So that, any bearish operations are not recommended until breaking the support level 1.5580 in order to target the support level 1.5430.
RES. 1.5714 1.5839 1.5908
Pivot 1.5645
Sup. 1.5520 1.5451 1.5326
[ATTACH]7334[/ATTACH]
USDCHF
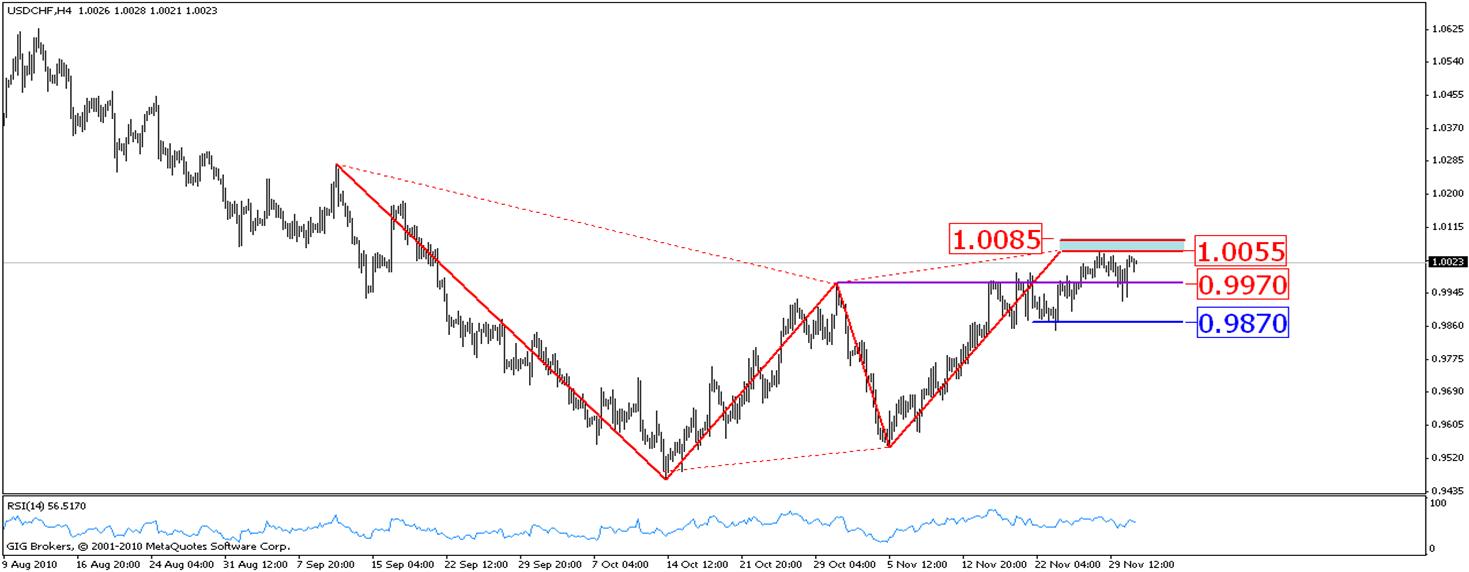
As expected for the pair during last week trades, it was able to target the price for the last wave of the formed harmonic pattern, at the end of the last week trades the pair has retested the resistance level 1.0055 this level is still stabled till this moment which is reflected down expecting for it to continue falling to have a correction move for the bullish wave targeting to retest the support level 0.9970 during the intra day trades.
RES. 1.0059 1.0091 1.0128
Pivot 1.0022
Sup. 0.9990 0.9954 0.9921
[ATTACH]7337[/ATTACH]
USDCAD
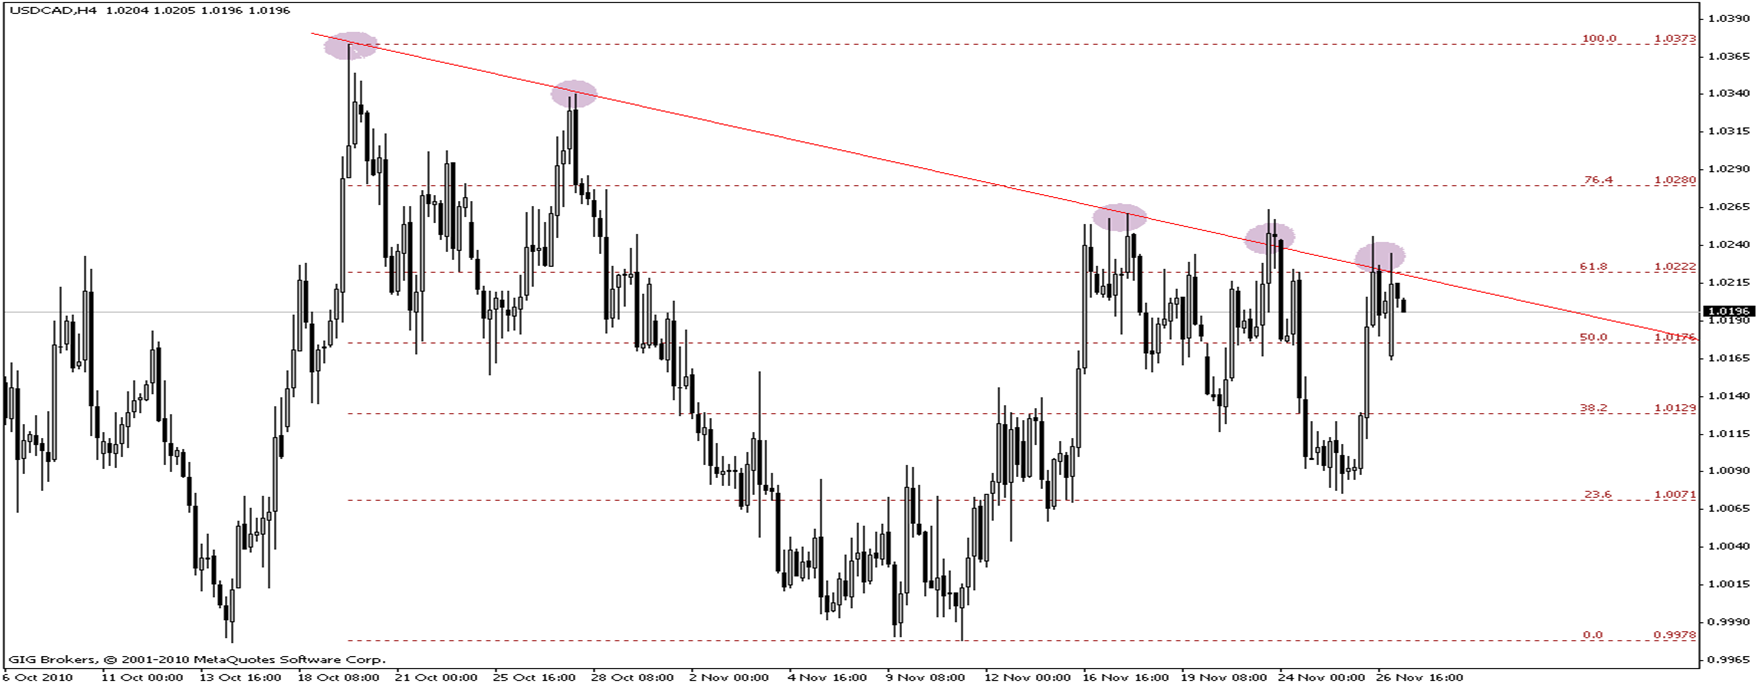
The pair is still unable to break the bearish trend line for the long period till this moment, so the pair is most likely in the bearish direction, in case of continuing the trades under the bearish trend line, it's expected during the next trades that the support level 1.0176 will be retested which with breaking it down the pair will continue falling till the next support level at 1.0129.
This expectation depends on the stability of the resistance level 1.0245.
Res. 1.0271 1.0339 1.0432
Pivot 1.0178
Sup. 1.0110 1.0017 0.9949
[ATTACH]7336[/ATTACH]
AUDUSD
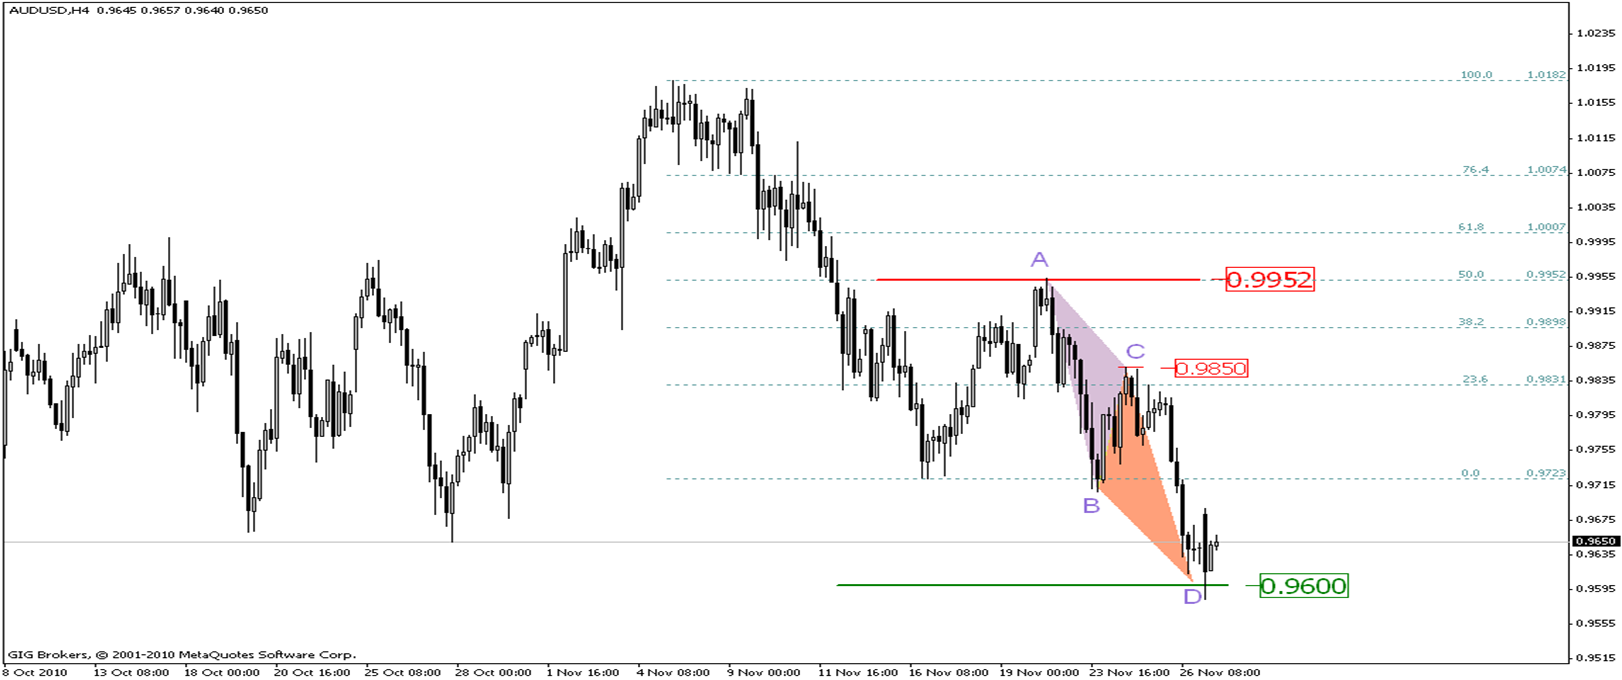
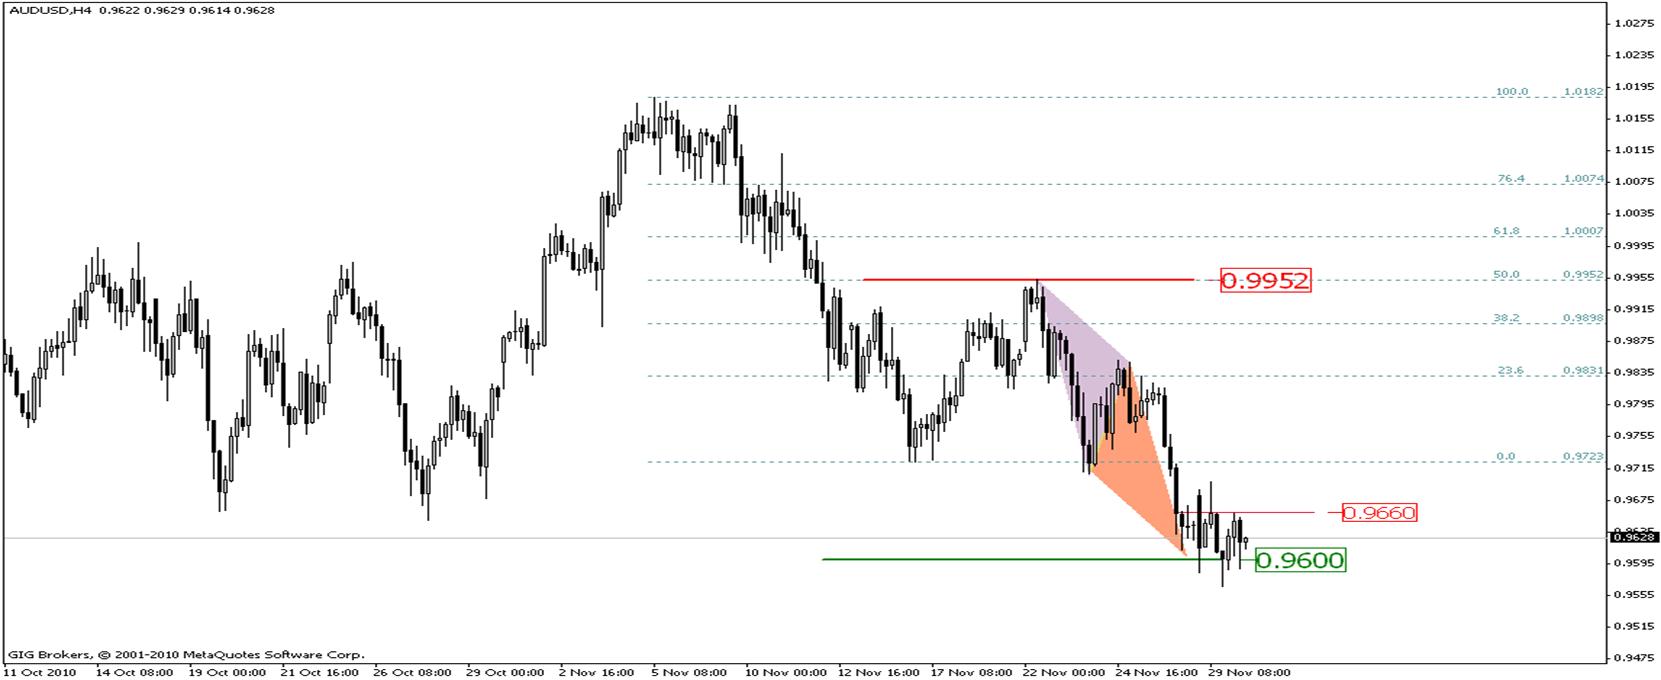
As expected in last week report, the harmonic pattern AB=CD is completed by reaching the level 0.9600 which represents the ( D ) point and this pattern is a positive pattern which means that the next trades will be shown as a reflective up. The pair is to retest the nearest resistance levels, one from it is the resistance level 0.9723 which with breaking it up means rising again to the resistance level 0.9850 but this bullish expectation depends on the stability of the ( D ) point level at the level 0.9600 because of breaking this level down means that the pair will continue forming the bearish direction for the medium period.
Res. 0.9768 0.9894 0.9971
Pivot 0.9690
Sup. 0.9565 0.9487 0.9362
[ATTACH]7335[/ATTACH]
Clients of GIGFX who has a real account can be able to see FULL Version for all 16 Currencies in member area section.
EURUSD
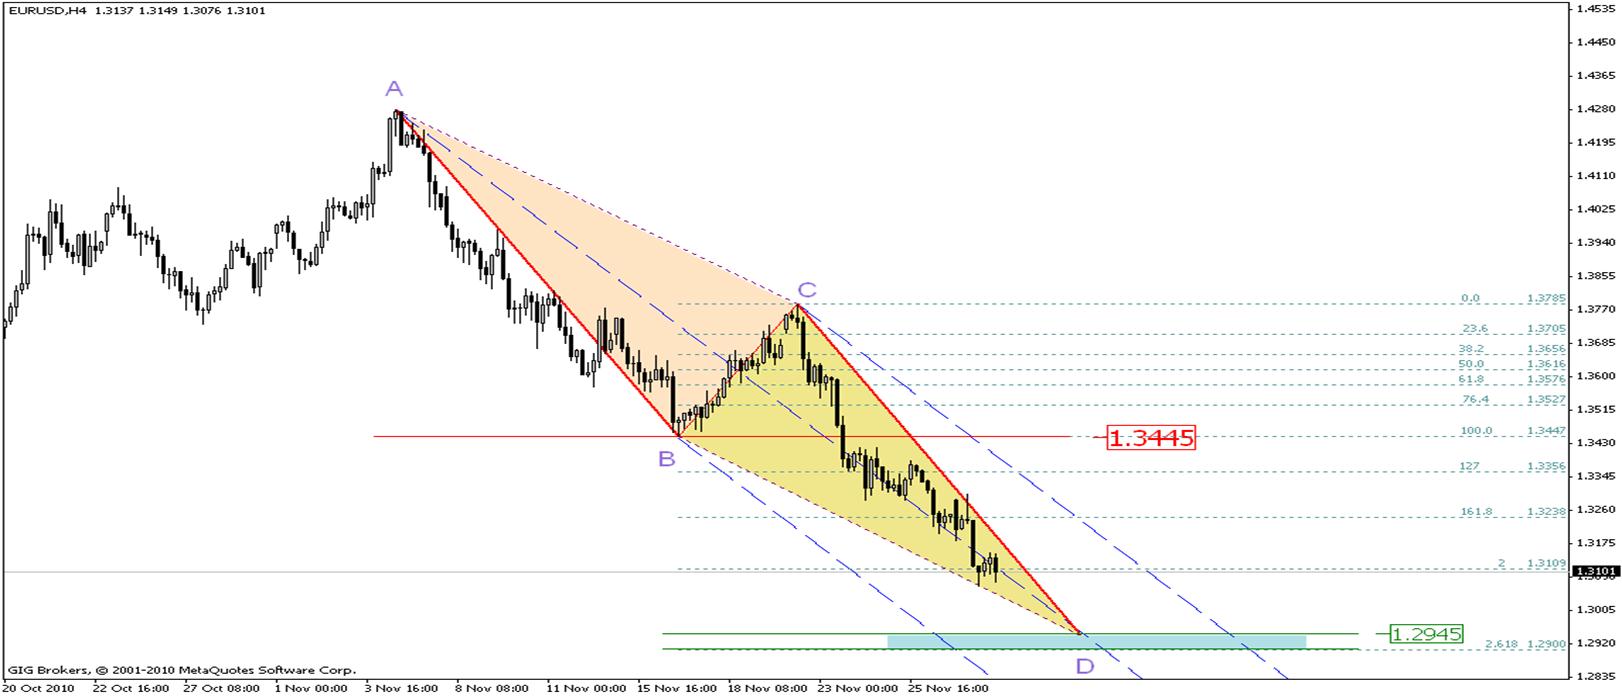
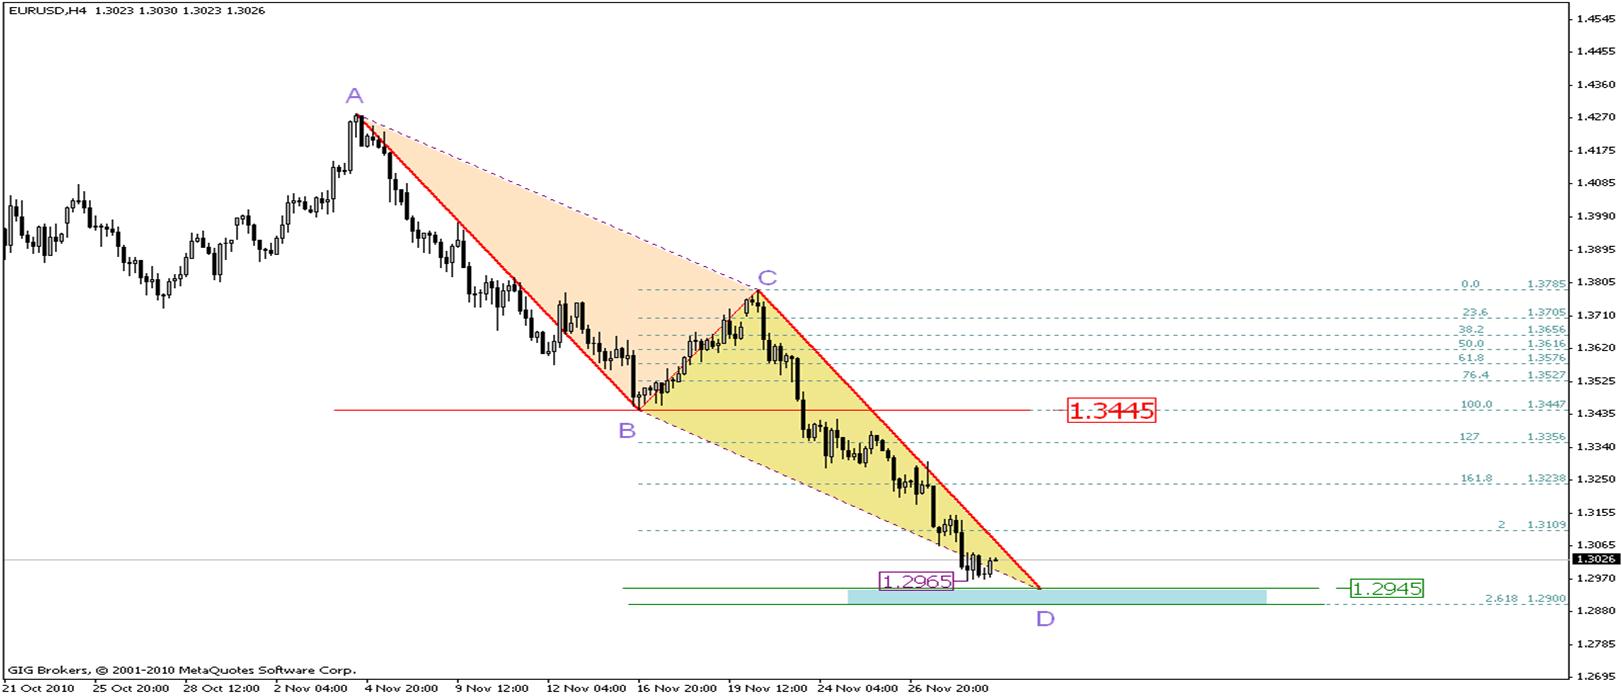
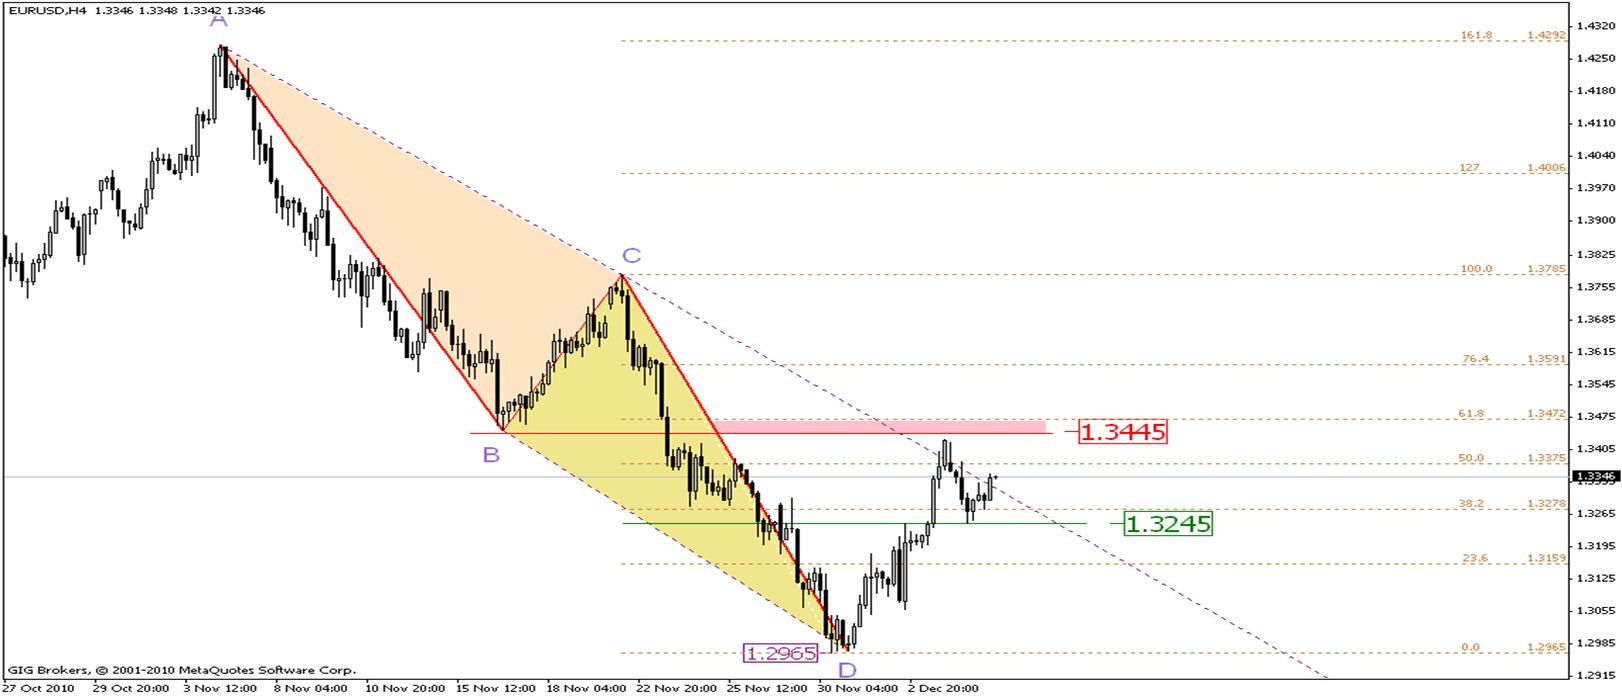
The European currency continued falling against the U.S dollar, whereas, euro registered the lowest price through the last 9 weeks at the level 1.3065 during yesterday trades against the American dollar, the European news came with failure to the Irish debt rescue plan pushing the pair with more falling, breaking the support level 1.3185 to continue forming the bearish directions for the short and medium periods. as it is noticed through this chart, the pair now is forming the bearish (CD) rip for a harmonic pattern (AB=CD), whereas, the (BC) rip is at 38.2% correction level for the (AB) rip so, it is expected that, the (CD) rip will be completed at 261.8%continuous level for the ( BC) rip. So it is expected with breaking the level 1.3065, the pair will continue falling to reach the (D) point area which completes the pattern and is located between the support level 1.2945 and the level 1.2900 which represents 261.8%.
The stability of these expectations depends on the stability of the resistance level 1.3280.
Res. 1.3133 1.3201 1.3117
Pivot 1.3217
Sup. 1.3148 1.3108 1.3016
[ATTACH]7344[/ATTACH]
GBPUSD
The level 1.5580 couldn’t hold against the pair breaking yesterday, the pair was able to break it down forming a harmonic pattern AB=CD, in this case, the CD wave is probably an extended wave, so more falling is expected during today’s trades targeting the support level 1.5430 but under the condition of continuing the trades under the resistance level 1.558
RES. 1.5636 1.5701 1.5756
Pivot 1.5581
Sup. 1.5520 1.5461 1.5396
[ATTACH]7345[/ATTACH]
USDCHF
As it was expected yesterday, the pair succeeded to reach the support level 0.9970 to test it, which is still stable against the price till now, if the pair was able to break this level, it will immediately target the support level 0.9870 to test it, but if the level 0.9970 held, the pair may rise targeting the resistance level 1.0055 to move during today's intraday trades in sideways movement.
RES. 1.0035 1.0069 1.0092
Pivot 1.0012
Sup. 0.9978 0.9954 0.9921
[ATTACH]7348[/ATTACH]
USDCAD
The pair is still unable to break the bearish trend line for the long period till this moment, where yesterday trades were confined between the bearish trend line and the support level 1.0176, so that; one of these levels must be broken to determine the next trades direction, if the bearish trend line has been breached with breaking the resistance level 1.0245 the pair will continue rising to the level 1.0340 and in case of breaking the support level 1.0176, it's expected that the pair will decline till the level 1.0129 which with breaking it; means falling till the support level 1.0071.
Res. 1.0238 1.0295 1.0332
Pivot 1.0201
Sup. 1.0144 1.0107 1.0050
[ATTACH]7347[/ATTACH]
AUDUSD
The last intraday trades for the pair were confined between the resistance level 0.9660 and the support level 0.9600, and this small range reflects forming the momentum which the pair will use to form the next trades direction which is expected to be bullish after targeting the bearish price for the positive harmonic pattern by reaching the support level 0.9600, therefore it's expected with breaking the resistance level 0.9660 that the pair will continue rising till the level 0.9723 which with breaking it up the pair will target up the level 0.9831.
This expectation depends on the stability of the support level 0.9600.
Res. 0.9696 0.9762 0.9827
Pivot 0.9631
Sup. 0.9565 0.9500 0.9434
[ATTACH]7346[/ATTACH]
Clients of GIGFX who has a real account can be able to see FULL Version for all 16 Currencies in member area section.
EURUSD
The European currency continued falling against the U.S dollar, whereas, during yesterday trades, euro registered the lowest price against the U.S dollar in the past 11 weeks at the level 1.2965 When reaching this level, the pair formed a bottom that the pair used it to rise during the last trades, it is noticed that, the level 1.2965 is around the target of the harmonic pattern which is expected to be completed at the (D) point which represents the area between the level 1.2954 and the level 1.2900 that represents 261.8% continuous level for the (BC) rip. Will the pair satisfy this falling by reaching the level 1.2965? Or, will form a lower bottom at the (D) point? This is what will be answered through the upcoming trades. If the support level 1.2965 continued holding, it is expected that, the pair will continue rising during the upcoming trades in order to retest the nearest resistance levels, one of which is the level 1.3110 and the level 1.3180.
Res. 1.3100 1.3215 1.3280
Pivot 1.3034
Sup. 1.2918 1.2853 1.2737
[ATTACH]7358[/ATTACH]
GBPUSD
As it was expected yesterday, the pair fell but it was unable to reach the support level 1.5430 as it was expected through this bearish movement, now, the pair reflected up after registering the lowest price at the level 1.5483 and with this reflection, the pair reached the resistance level 1.5580 to test it, if this level held against the pair testing, the pair will continue falling targeting the support level 1.5430.
But in the case of good closing above the resistance level 1.5580 that means the pair will target the resistance level 1.5685 during the upcoming intraday trades, to close today's trades bullishly.
RES. 1.5606 1.5658 1.5721
Pivot 1.5546
Sup. 1.5497 1.5434 1.5386
[ATTACH]7359[/ATTACH]
USDCHF
Yesterday, the pair tried to break the support level 0.99702 where it could skip this level but failed to close below it, this is what pushed the pair up again testing the resistance level 1.0055 which still holds till now, and the movement of the pair during the short period trades is a sideways one between the resistance level 1.0055 and the support level 0.9970 to form a confusion area between those levels, breaking each of them supports the breaking direction.
RES. 1.0075 1.0118 1.0192
Pivot 1.0001
Sup. 0.9959 0.9884 0.9842
[ATTACH]7362[/ATTACH]
USDCAD
After several attempts, the pair was able to break the bearish trend line for the long period, and it also was able to break the resistance level 1.0245 marking the beginning of forming a new bullish direction for the short period, where the pair continued rising till the level 1.0280 which represents 76.4% correction level for the bearish direction ( from 1.0373 to 0.9987 ), the pair formed a top at this level to fall from it during the last intraday trades to retest the nearest resistance levels and forming a bullish bottom that will use it to rise trying to break the level 1.0280 which with breaking it up expected to rise till the level 1.0340, it's expected that the forming of the bullish bottom is between the level 1.0245 and the level 1.0220.
This expectation depends on the stability of the support level 1.0220.
Res. 1.0308 1.0353 1.0421
Pivot 1.0239
Sup. 1.0194 1.0127 1.0060
[ATTACH]7361[/ATTACH]
AUDUSD
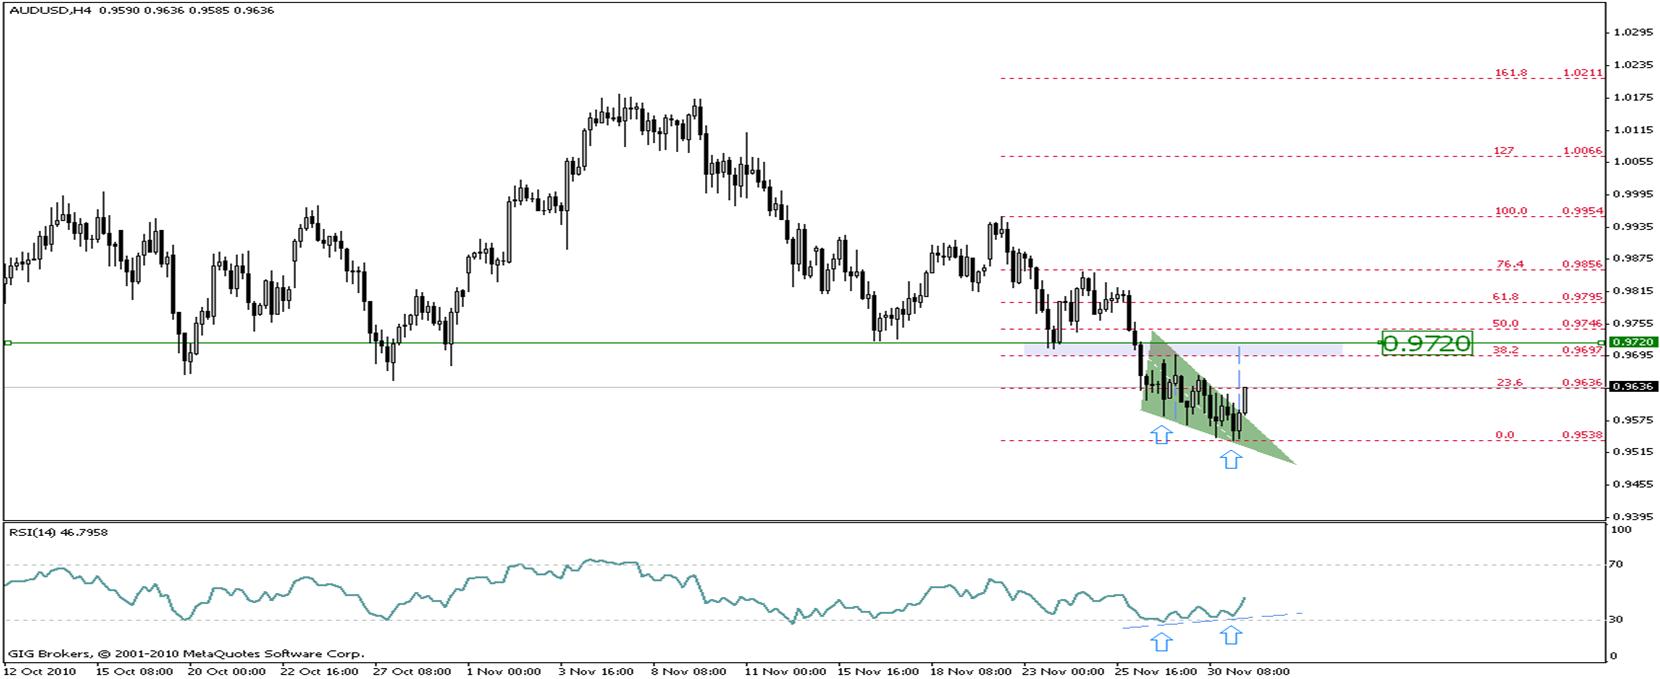
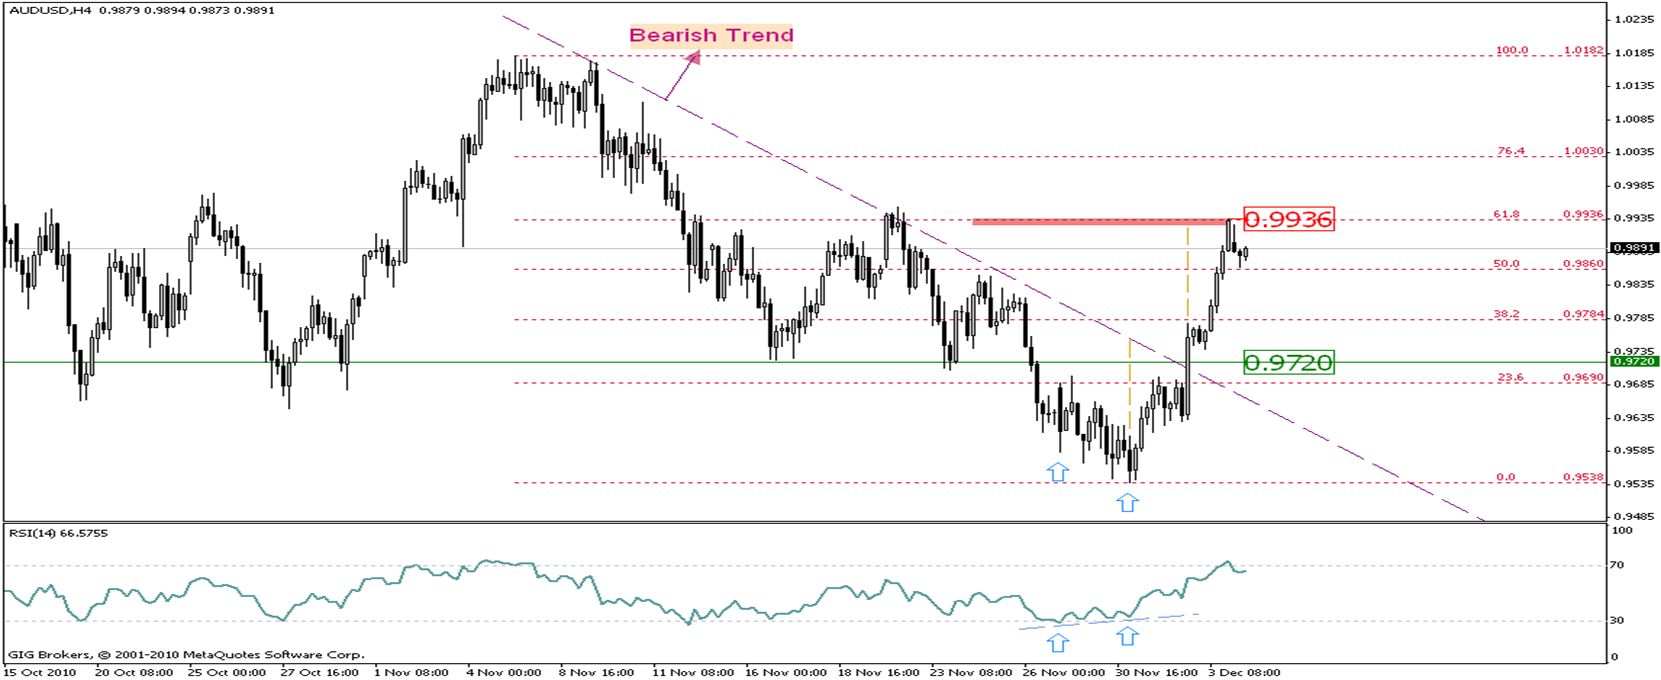
During the last trades for the short period, some positive reflective signals appeared which caused a reflection for the bearish direction that dominants the pair. one of these signals for the reflective pattern ( bearish wedge ) and also the appearance of a positive divergence which will reflect the next direction from the RSI index, the pair is trying to break the upper limit for the bearish wedge to begin forming a corrective bullish direction for the short period, if breaking the upper limit is confirmed, the pair will continue rising till the target price for this pattern, and it's expected that it will be at the confined resistance area between the level 0.9697 which represents 38.2% correction level for the bearish direction ( from 0.9954 to 0.9538 ) and the resistance level 0.9720.
This expectation depends on the stability of the support level 0.9538.
Res. 0.9646 0.9711 0.9763
Pivot 0.9595
Sup. 0.9533 0.9481 0.9418
[ATTACH]7360[/ATTACH]
Clients of GIGFX who has a real account can be able to see FULL Version for all 16 Currencies in member area section.
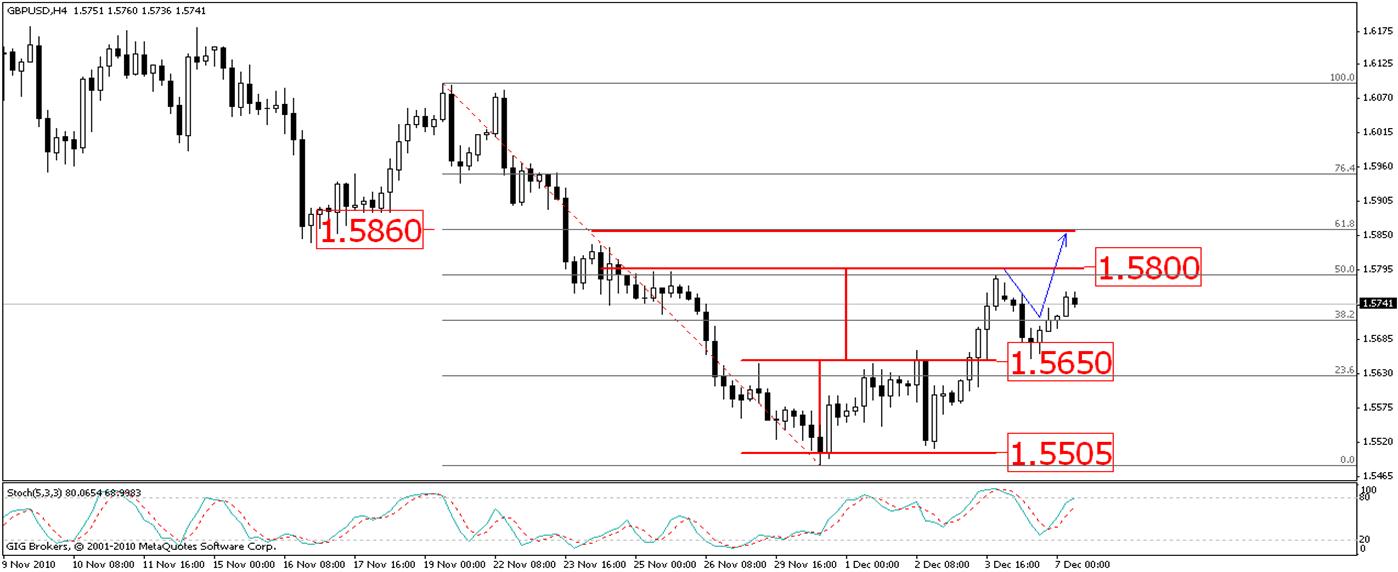
EURUSD Yesterday trades saw the rise of the European currency against the American dollar for two consecutive days; this rising reflects the investors' optimism toward the most risky and high-yielding currency, this rising made the pair able to break the level 1.3159 which represents 23.6% correction level for the bearish direction (from 1.3785 to 1.2965) to continue rising targeting the level 1.3278 which represents 38.2% correction level for the same bearish direction, and it is expected to reach this level during the upcoming trades with the reference to that, the pair will continue rising in order to test the trend line which connect the (A) point with the (B) point for the positive harmonic pattern AB=CD which is expected to coincide with the resistance level 1.3375 which represents 50% correction level for the same mentioned bearish direction. The stability of these expectations requires the stability of the support level 1.3060. Res. 1.3282 1.3356 1.3472 Pivot 1.3172 Sup. 1.3097 1.2986 1.2911 GBPUSD Yesterday, the pair failed to break the resistance level 1.5650 from which the pair reflected down to reach the support level 1.5505 in order to test it, to form a sideway channel pattern between those levels, and with the expectations of more rising for the pair during today's trades but under the condition of breaking the resistance level 1.5650 with a good close above it, if the pair succeeded in this, it will target testing the resistance level 1.5800. This expectation depends on the stability of the support level 1.5505. RES. 1.5672 1.5748 1.5829 Pivot 1.5592 Sup. 1.5517 1.5436 1.5362 USDCHF Through the last two days, the pair traded in a sideways direction with a little rising up, forming a reflective pattern for the direction which is a bullish wedge that refers to the weakness of the buying strength. It is expected that, the pair will fall down but under the condition of breaking the support level 0.9970 in order to target the support levels 0.9890 then 0.9765. And what confirms these expectations is forming the harmonic pattern AB=CD which with its completing by the complete forming of the CD wave, it is supposed to reflect down. And it is noticed that the target of the CD wave was the resistance level 1.0055 which held against the pair testing during the last two days. This confirms the expectation of the corrective down reflection of the pair for the medium period and the bearish direction during this day's trades. Yesterday analysis is still remaining till now RES. 1.0064 1.0105 1.0144 Pivot 0.9957 Sup. 0.9859 0.9794 0.9694 USDCAD The pair continued the bearish move during yesterday trades where it was able to broke the support level 1.0129 to reach the next support level 1.0071 which was mentioned before in yesterday report. the pair didn't stop it's movement by reaching this level but it continued falling down until it achieved the lowest price at the level 1.0025, it's expected that the level 1.0025 came to coincide with the pitchfork medium line which is graphed on the bullish wave ( from 0.9978 to 1.0280 ) to give the probability of forming a bearish bottom, if this bottom is completed by the stability of the level 1.0028 it's expected that the pair will retest the nearest resistance level which are the levels 1.0071 and 1.0129 which is expected in case of completion this scenario, a bearish top will be formed at these levels which will push down the pair again to retest the level 1.0025 which in case of breaking it at any time means falling till the support level 0.9978. This expectation depends on the stability of the resistance level 1.0129. Res. 1.0133 1.0242 1.0296 Pivot 1.0079 Sup. 0.9970 0.9916 0.9807 AUDUSD As noticed in the chart, the pair was able to break the bearish trend line for the medium period and also was able to break the resistance level 0.9720 to rise and reach the level 0.9784 which represents 38.2 correction level for the bearish direction ( from 1.0182 to 0.9538 ) the pair is trading now at the level 0.9784 expecting breaking it up, the pair will continue rising targeting to break the bearish trend line at the level 0.9936 which represents 61.8% correction level for the same bearish direction. To reach this price target; the resistance level 0.9860 must be broken. This expectation depends on the stability of the support level 0.9690 Res. 0.9822 0.9877 0.9976 Pivot 0.9723 Sup. 0.9668 0.9569 0.9514 Clients of GIGFX who has a real account can be able to see FULL Version for all 16 Currencies in member area section.
EURUSD
The negative American data released at the end of the last week supported the rising of the European currency, as it was expected for this rising, the pair rose till reached the level 1.3375 which represents 50% correction level for the bearish direction (from 1.3785 to 1.2965) at which the price coincided with the bearish trend line which matches the (A) point with the © for the positive harmonic pattern AB=CD, the pair wasnt satisfied with reaching this level, but registered the highest price through the end of the last week trades at the level 1.2425 around the resistance level 1.3445, which represents the (B) point, if the buying strength still controls the trades of the pair, breaking the level 1.3445 is expected, whereas, the pair then will target to reach the level 1.2591, and these expectations are the most likely to happen during the upcoming trades.
The stability of these expectations requires the stability of the support level 0.3245.
Res. 1.3504 1.3582 1.3738
Pivot 1.3348
Sup. 1.3270 1.3114 1.3036
[ATTACH]7398[/ATTACH]
GBPUSD
During the end of the last week trades, the pair succeeded to break the resistance level 1.5650 as it was expected, reaching around the target at the level 1.5800 which was mentioned before, where recorded the highest price at the level 1.5787 and closed around this level, this is what supports the expectations of more rising during the intraday trades of today but under the condition of breaking the level 1.5800 up, in order to target then the resistance level 1.5860 which represents 61.8% correction level for the last bearish wave for the medium period then, it will target the resistance level 1.5945 which represents 76.4% of the same previous levels.
The stability of these expectations requires the stability of the support level 1.5650.
RES. 1.5852 1.5923 1.6058
Pivot 1.5716
Sup. 1.5645 1.5509 1.5436
[ATTACH]7399[/ATTACH]
USDCHF
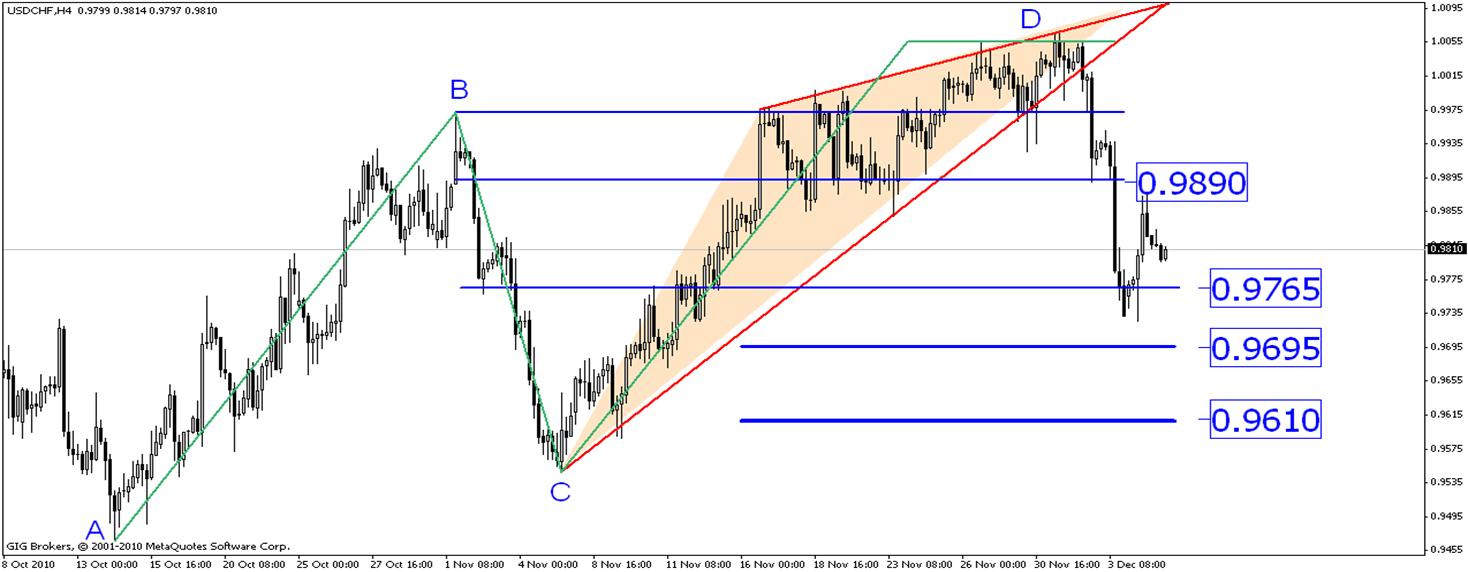
As it was expected previously, the pair declined at the end of the last week trades till reached the mentioned target at the support level 0.9765, and it is the target of the bullish wedge which was formed on the movement of the pair for the medium period trades, whereas, the declining of the pair was strong, so, it is expected that, the pair will continue declining for the intraday levels of today targeting the support level 0.9610 but under the condition of breaking the support level 0.9695 which represents 61.8% correction level for the bullish wave (AD) for the medium period.
The stability of these expectations requires the stability of the resistance level 0.9890
RES. 0.9877 1.0024 1.0095
Pivot 0.9804
Sup. 0.9658 0.9585 0.9439
[ATTACH]7397[/ATTACH]
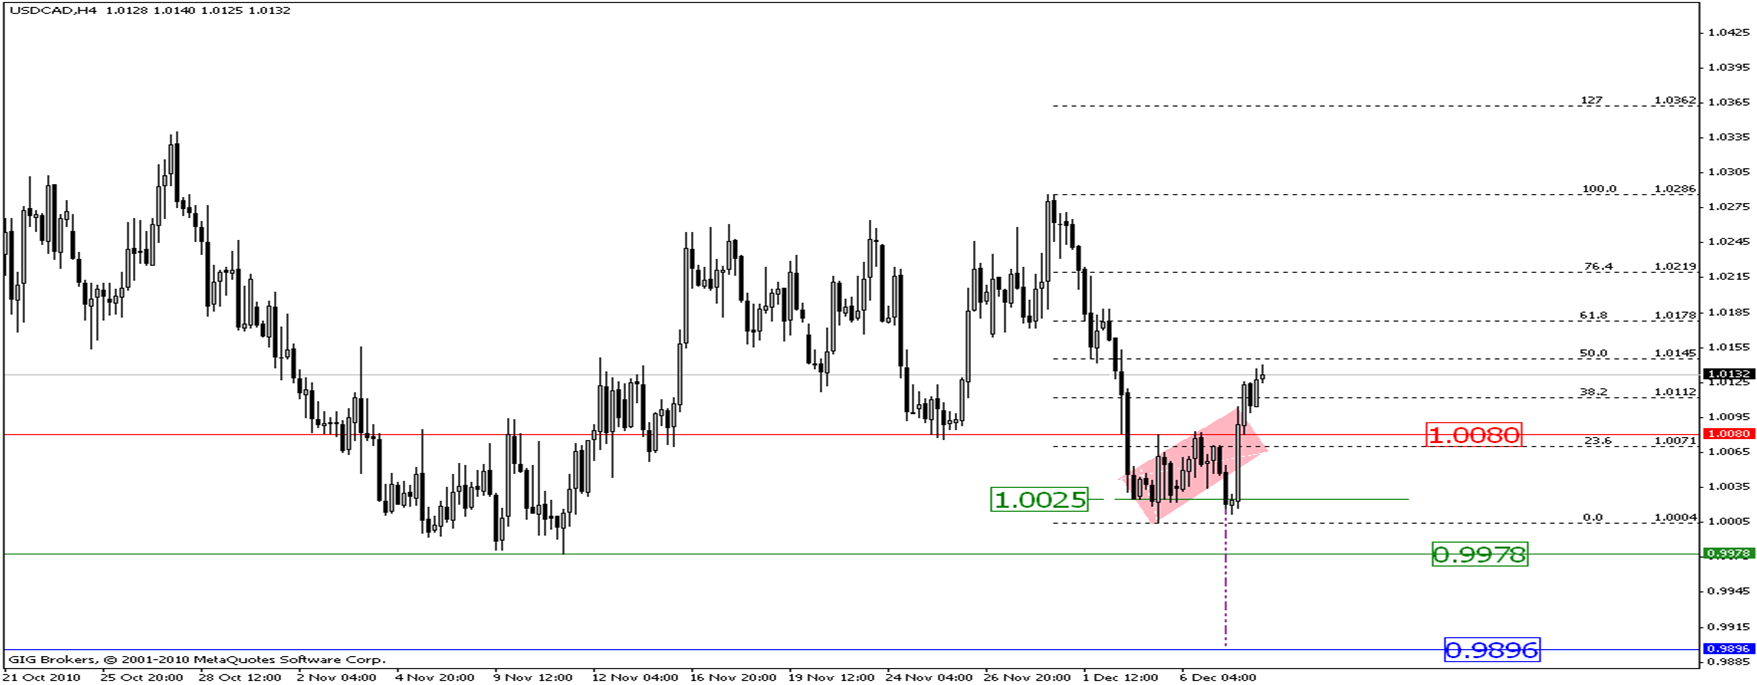
USDCAD
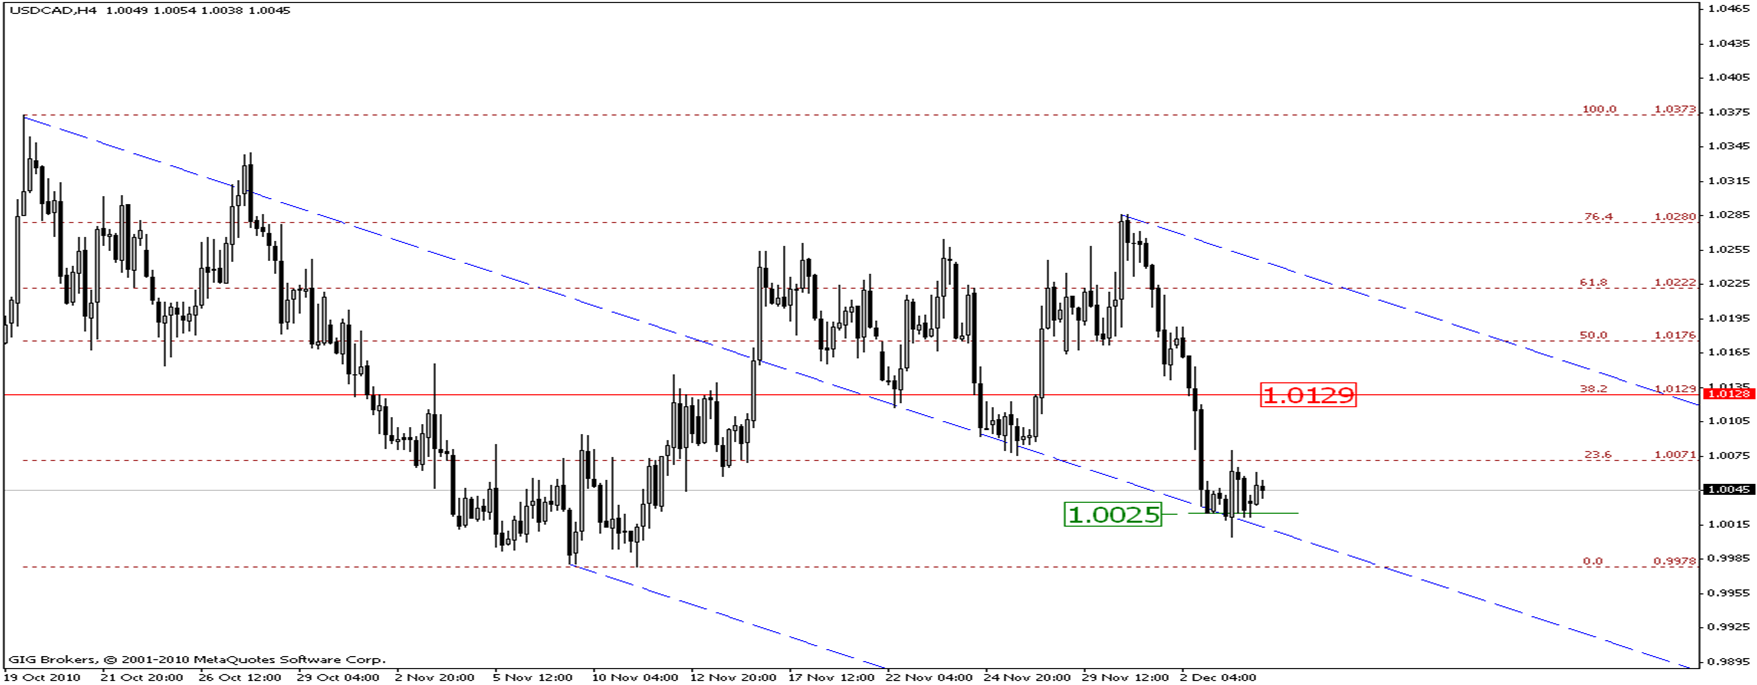
The pair is still trading till now above the support area which is a result of coinciding the level 1.0025 with the pitchfork midline that formed on the bullish wave ( from 0.9978 to 1.0280 ) if the stability of this area is continued; it's expected that the pair will rise until the level 1.0129 but in case of breaking the resistance level 1.0071 and this bullish move is intended to search on forming a bearish top will force the pair to return again for falling to reach the target price for the short period at the support level 0.9978 which expected reaching it in case of breaking the support level 1.0025 and also breaking the pitchfork midline.
Res. 1.0070 1.0113 1.0146
Pivot 1.0037
Sup. 0.9994 0.9961 0.9918
[ATTACH]7396[/ATTACH]
AUDUSD
As expected in the last week report that the pair has completed rising till the level 0.9936 which represents 61.8% correction level for the bearish direction ( from 1.0182 to 0.9538 ) and this level represents the target price from breaking the mentioned bearish trend line, it's expected for the next trades a further rise provided of breaking the level 0.9936 then reaching the level 1.0030 which represents 76.4% correction level for the same mentioned bearish direction.
This expectation depends on the stability of the support level 0.9785.
Res. 0.9999 1.0066 1.0196
Pivot 0.9869
Sup. 0.9802 0.9672 0.9605
[ATTACH]7395[/ATTACH]
Clients of GIGFX who has a real account can be able to see FULL Version for all 16 Currencies in member area section.
EURUSD
The European currency fell against the US dollar during yesterday trades, this falling was a try to form a bullish bottom that is considered a part of a corrective bullish movement and the pair is forming it through the last short period and the continuation of this forming is expected during the upcoming trades. The formed bullish bottom is at the level 1.3245 which its importance had mentioned through yesterday report. The pair used the formed bottom through the last intraday trades to rise whereas, it is expected that, the pair will rise till reaching the resistance area between the level 1.3445 which represents the (B) point for the harmonic pattern and the level 1.3372 which represents 50% correction level for the bearish direction (from 1.3785 to 1.2965). Breaking up this area is important to continue the corrective bullish direction then the pair will rise targeting the level 1.3591.
The stability of these expectations requires the stability of the support level 1.3245.
Res. 1.3404 1.3500 1.3578
Pivot 1.3324
Sup. 1.3230 1.3149 1.3053
[ATTACH]7412[/ATTACH]
GBPUSD
Yesterday, the pair did not succeed to break the resistance level 1.5800 which still stable till now, the pair reflected retesting the support level 1.5650, and with the stability of this level against the pair testing, returns the expectations of more rising for the pair but a bullish positions are not recommended until breaking the resistance level 1.5800 to target then the level 1.5860 which represents 61.8% correction level for the last bearish wave for the medium period then the resistance level 1.5950.
The stability of these expectations requires the stability of the support level 1.5650.
RES. 1.5772 1.5834 1.5894
Pivot 1.5714
Sup. 1.5645 1.5594 1.5534
[ATTACH]7413[/ATTACH]
USDCHF
As it was expected previously, the pair declined at the end of the last week trades till reached the mentioned target at the support level 0.9765, and it is the target of the bullish wedge which was formed on the movement of the pair for the medium period trades, whereas, the declining of the pair was strong, so, it is expected that, the pair will continue declining for the intraday levels of today targeting the support level 0.9610 but under the condition of breaking the support level 0.9695 which represents 61.8% correction level for the bullish wave (AD) for the medium period.
The stability of these expectations requires the stability of the resistance level 0.9890.
Yesterday analysis is still remaining till now.
RES. 0.9885 0.9954 1.0034
Pivot 0.9805
Sup. 0.9736 0.9656 0.9587
[ATTACH]7411[/ATTACH]
USDCAD
As noticed in the chart, the pair has formed a continuous harmonic pattern which is the bearish flag, this pattern came to support the bearish dominant direction on the pair for the short period, it's expected that with breaking the lower limit for the pattern and with breaking the support level 1.00025 that the pair will continue falling till the support level 0.9978 which breaking it down is important to the pair to use on achieving the target price for the pattern at the level 0.9896 which represents 127% continuous level for the bullish direction ( from 0.9978 to 1.0286 ) at the same time.
This expectation depends on the stability of the resistance level 1.0080.
Res. 1.0086 1.0115 1.0147
Pivot 1.0054
Sup. 1.0025 0.9993 0.9964
[ATTACH]7410[/ATTACH]
AUDUSD
The pair’s last intraday trades was confined between the resistance level 0.9936 and the support level 0.9860 and this narrow trading range came to reflect collecting the momentum price which the pair will use to continuing rising and continuing forming the bullish correction direction for the short period, where from the expected with breaking the resistance level 0.9936 that the pair will continue rising till the level 1.0030 which represents 76.4% correction level for the bearish direction ( from 1.0182 to 0.9538 )
This expectation depends on the stability of the support level 0.9860.
Res. 0.9932 0.9967 1.0006
Pivot 0.9891
Sup. 0.9856 0.9815 0.9780
[ATTACH]7409[/ATTACH]
Clients of GIGFX who has a real account can be able to see FULL Version for all 16 Currencies in member area section.
EURUSD
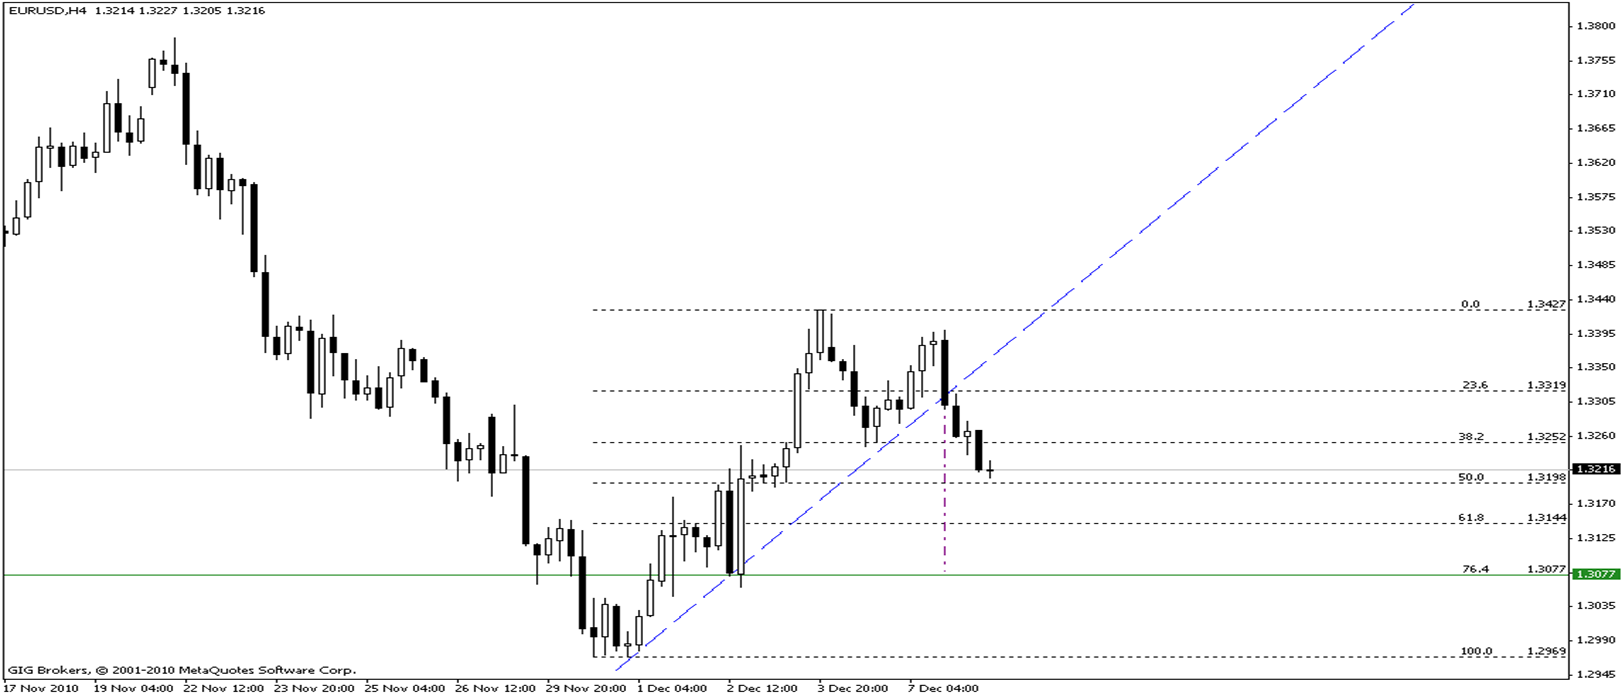
Euro declines for the second consecutive day against the U.S dollar; this declining was due to the support of the Irish bad news. On the contrast, the U.S dollar rose after releasing the statements by U.S. President Barack Obama, who reported the approval of the U.S. administration to extend tax cuts for two years. It is noticed through the chart that, the pair broke the bullish trend line that was formed for the short period, also the support level 1.3245 has been broken, so, the pair declined during the last intraday trades. Now, the pair is in its way to test the level 1.3198 which represents 50% correction level for the bullish direction (from 1.2965 to 1.3427). breaking this level is important to continue declining till reaching the level 1.3077 which represents the target for breaking the bullish trend line for the short period, the stability of the level 1.3198 could give the probability of forming a positive harmonic pattern which means rising again for the pair in order to re-test the resistance levels 1.3245 and 1.3319.
Res. 1.3354 1.3448 1.3496
Pivot 1.3306
Sup. 1.3212 1.3164 1.3070
[ATTACH]7429[/ATTACH]
GBPUSD
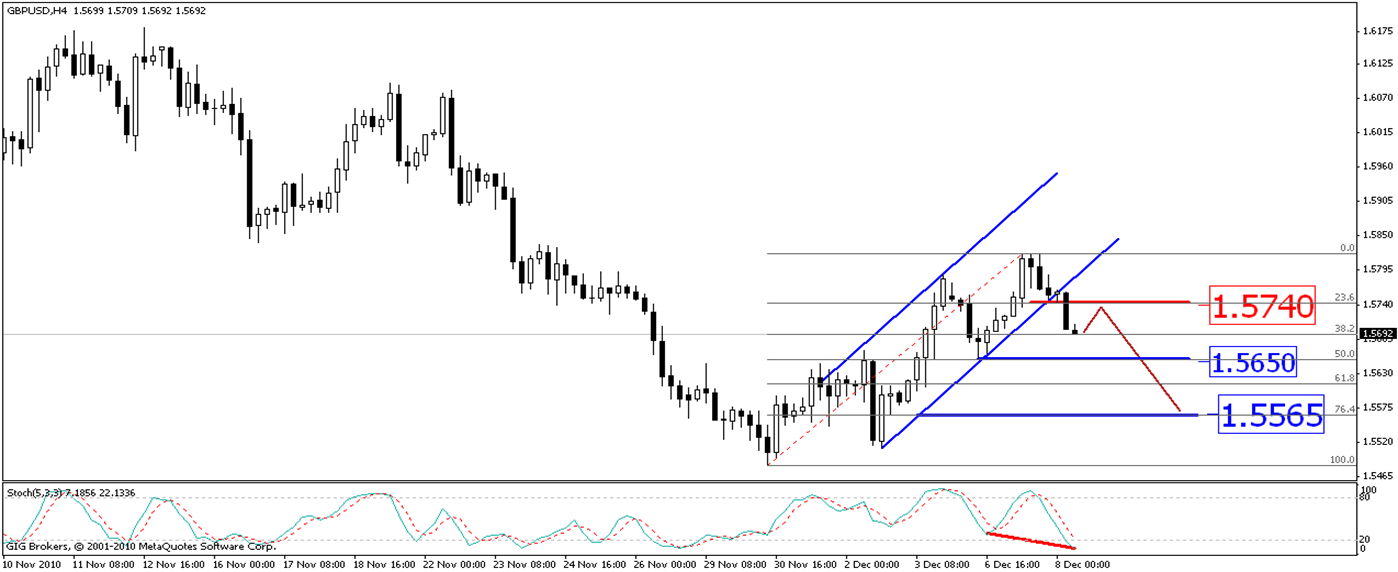
Yesterday, the pair did not succeed to break the resistance level 1.5800, where tried to test it yesterday and succeeded to close above it where recorded the highest price at 1.5821 and failed to be stable then reflected back downwards till now breaking the bullish trend line for the short period and the intraday trades and the support level 1.5740 which represents 23.6% correction level for the last bullish wave for the short period, it is expected that the pair will continue falling during the intraday trades of today targeting the support level 1.5565 which represents 76.4% correction level.
The stability of this expectation depends on the stability of the resistance level 1.5740.
RES. 1.5817 1.5878 1.5934
Pivot 1.5760
Sup. 1.5699 1.5642 1.5581
[ATTACH]7428[/ATTACH]
USDCHF
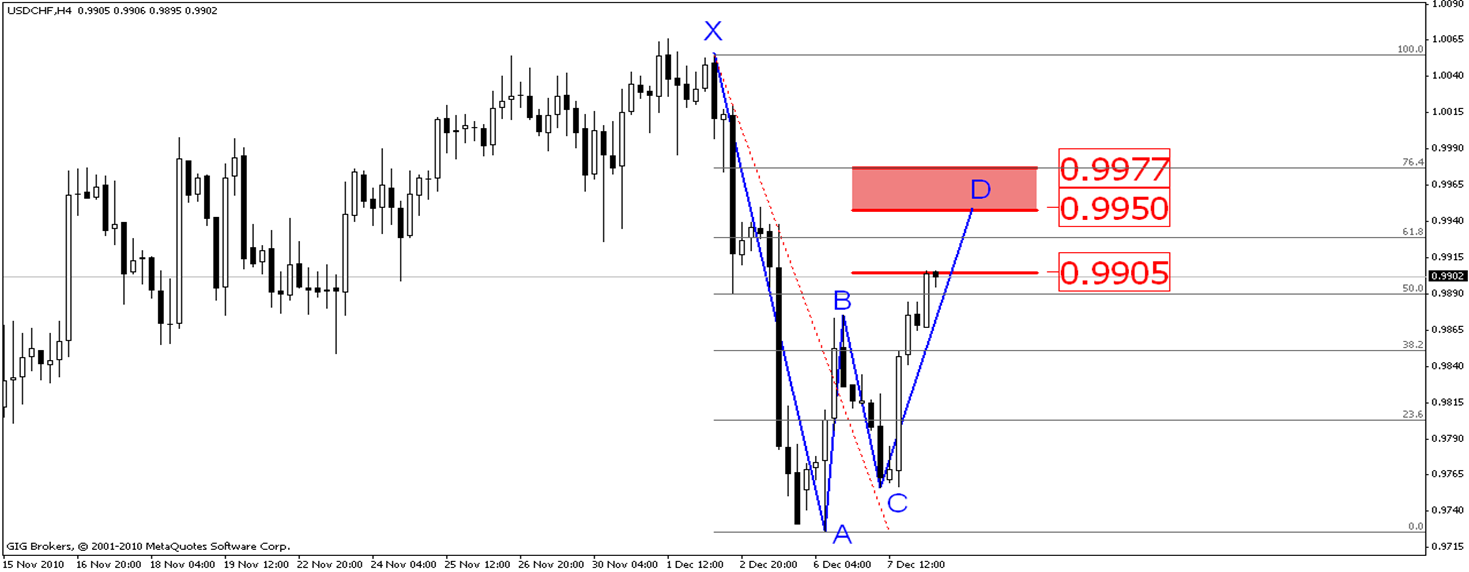
Yesterday, the pair rose breaking the resistance level 0.9855 forming a harmonic pattern Gartley in the early forming stage and the end of the pattern is supposed to be with the end of the CD wave which is supposed to be between the resistance level 0.9950 and the level 0.9977, so, it is expected that, the pair will rise for the intraday levels targeting this area and that a down corrective reflection will occur just hitting this area but under the condition of the appearance of a negative signals for the pair, this vision will be confirmed by breaking the resistance level 0.9905 that the pair is testing now.
The stability of these expectations depends on the stability of the support level 0.9850.
RES. 0.9920 0.9960 1.0048
Pivot 0.9838
Sup. 0.9792 0.9710 0.9664
[ATTACH]7427[/ATTACH]
USDCAD
Although the pair has broke the bottom line for the bearish flag pattern, the pair didn't achieve a good close under the support level 1.0025 which was previously mentioned the importance of this level to continue falling, therefore it's found for the pair to rise again using the formed bottom at this level to break up the resistance level 1.0080, the pair is on it's way to target the resistance level 1.0145 which represents 50% correction level for the bearish direction ( from 1.0286 to 1.0004 ) breaking this level is important for the pair to continue the expected rising till the level 1.0219
The failing to break the level 1.0145 means falling again to retest the level 1.0080 which represents an important level for the pair; for the short period.
Res. 1.0162 1.0201 1.0276
Pivot 1.0087
Sup. 1.0048 0.9973 0.9934
[ATTACH]7426[/ATTACH]
AUDUSD
The U.S dollar returned again to rise facing the AUD dollar, where the pair didn't trade a lot yesterday above the resistance level 0.9936 but the pair was pushed down till the support level 0.9860 which was not able to hold for long against this falling, and the pair was able to break this level down to continue falling. the pair is trading at the support level 0.9784 which represents 38.2% correction level for the bearish direction ( from 1.0182 to 0.9690 ) and the previously broken up, breaking this level down again means targeting the pair to the next support level at 0.9690.
This expectation depends on the stability of the resistance level 0.9860.
Res. 0.9919 1.0012 1.0060
Pivot 0.9871
Sup. 0.9778 0.9730 0.9637
[ATTACH]7425[/ATTACH]
Clients of GIGFX who has a real account can be able to see FULL Version for all 16 Currencies in member area section.
EURUSD
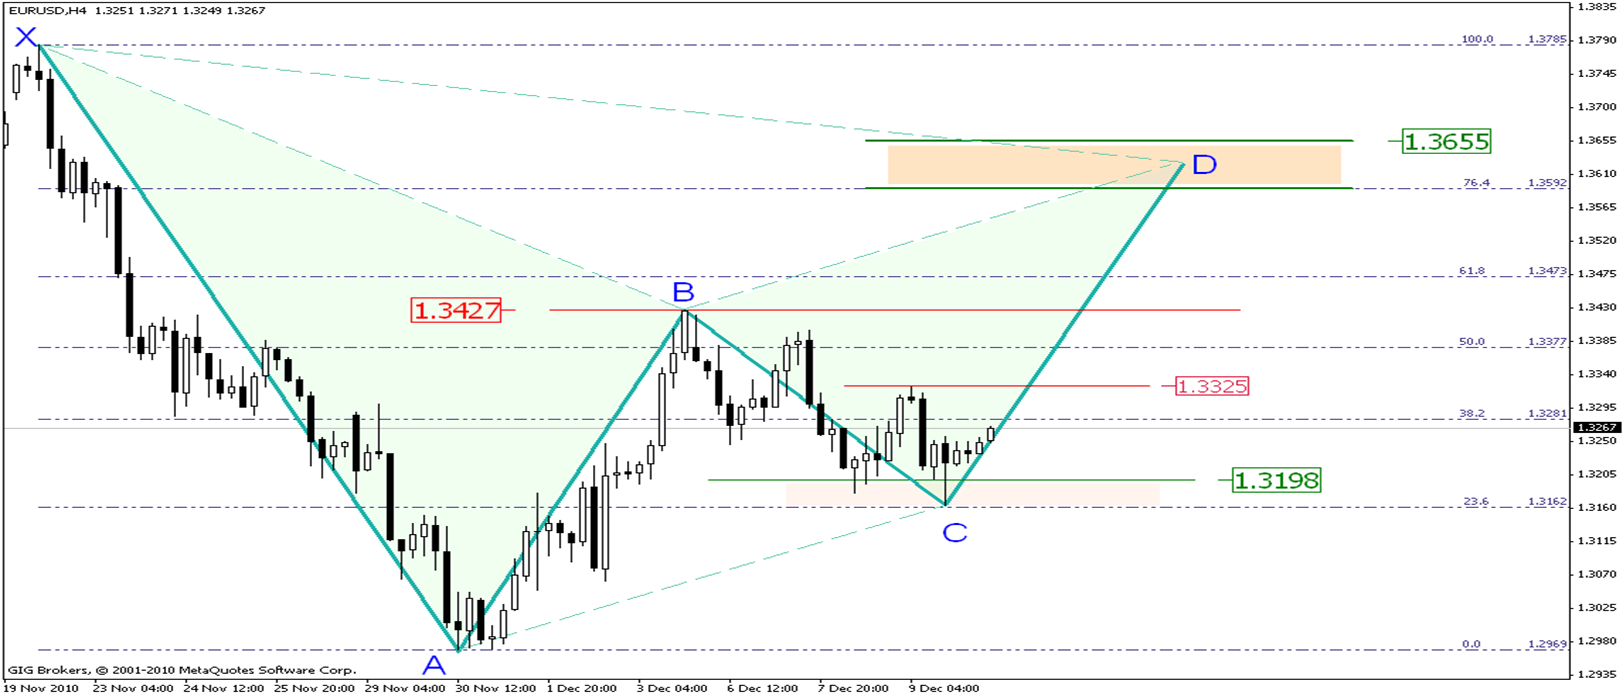
As it was expected through yesterday report, the probability of forming a positive harmonic pattern (AB=CD) has been achieved, this pattern was completed at the level 1.3198 which represents 50% Fibonacci retracement level for the bullish direction (from 1.2969 to 1.3427), the pair formed a bottom at this level and used it to push rising till now. it is expected that, the pair will continue rising till reach the bearish trend line which matches the (A) point with the (B) point, at which the price is expected to coincide with the resistance level 1.3377 which represents 50% Fibonacci retracement level for the bearish direction (from 1.3785 to 1.2969). If the pair was able to break this area, it will continue rising till reach the resistance level 1.3427 which represents the (B) point for a Gartley negative harmonic pattern that is still in the forming stage and that will be confirmed with breaking this resistance. The rib (BC) represents 50% Fibonacci retracement level for the rib (AB). so, it is expected that, this pattern will be confirmed with reaching the (D) point which is located between the level 1.3592 which represents 76.4% Fibonacci retracement level for the rib (XA), and the level 1.3655 which represents 200% Fibonacci continuous level for the rib (BC).
The stability of these expectations requires the stability of the (C) point which represents the support level 1.3198.
Res. 1.3301 1.3340 1.3401
Pivot 1.3240
Sup. 1.3201 1.3140 1.3101
[ATTACH]7449[/ATTACH]
GBPUSD
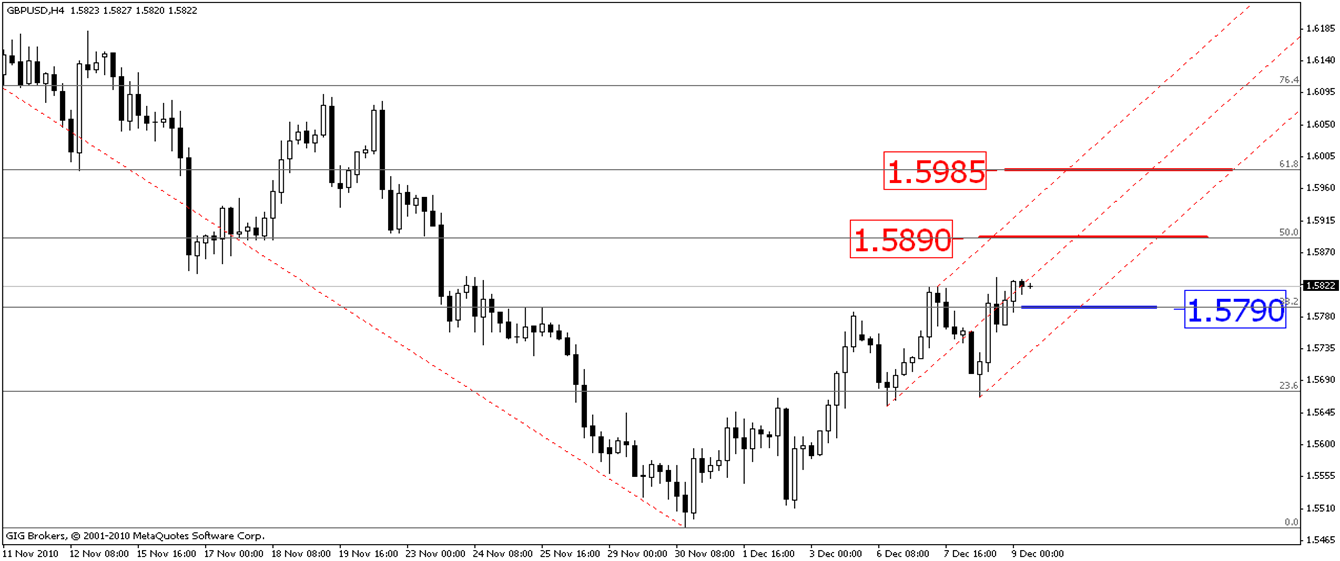
Yesterday, the pair succeeded to reflect its direction and rose for the short period after hitting the resistance level 1.5675 which represents 23.6% Fibonacci retracement level for the last bearish medium-term wave, and reflected up to close above the resistance level 1.5790 which represents 38.2% Fibonacci retracement level and more rising is expected for the pair during the upcoming trades targeting the resistance level 1.5985 which represents 61.8% Fibonacci retracement level but first it should break the first resistance level 1.5890.
The stability of these expectations requires the stability of the support level 1.5790.
RES. 1.5869 1.5934 1.6037
Pivot 1.5768
Sup. 1.5701 1.5600 1.5533
[ATTACH]7450[/ATTACH]
USDCHF
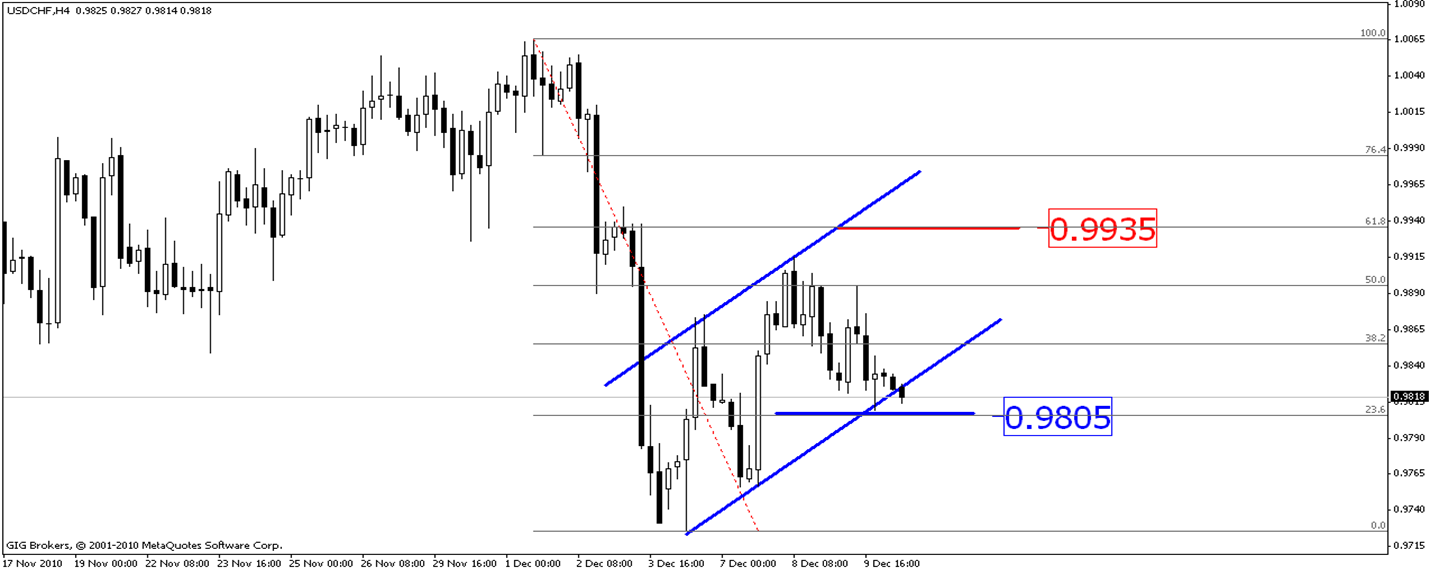
The pair failed yesterday to gain more rising where it could not break up the resistance level 0.9895 but reflected back downwards trying to test the support level 0.9805 so, yesterday's expectations have been changed for the short term and intraday levels.
The pair is moving inside bullish channel till now for the short-term and intraday levels, so any bearish positions are not recommended until breaking the support level 0.9805 which represents 23.6% Fibonacci retracement level for the last short-term bearish wave
And also coincides with the bottom boarder of this channel in which the pair is moving.
These expectations require the stability of the resistance level 0.9895.
Yesterday analysis is still remaining till now.
RES. 0.9901 0.9941 0.9967
Pivot 0.9875
Sup. 0.9836 0.9809 0.9769
[ATTACH]7448[/ATTACH]
USDCAD
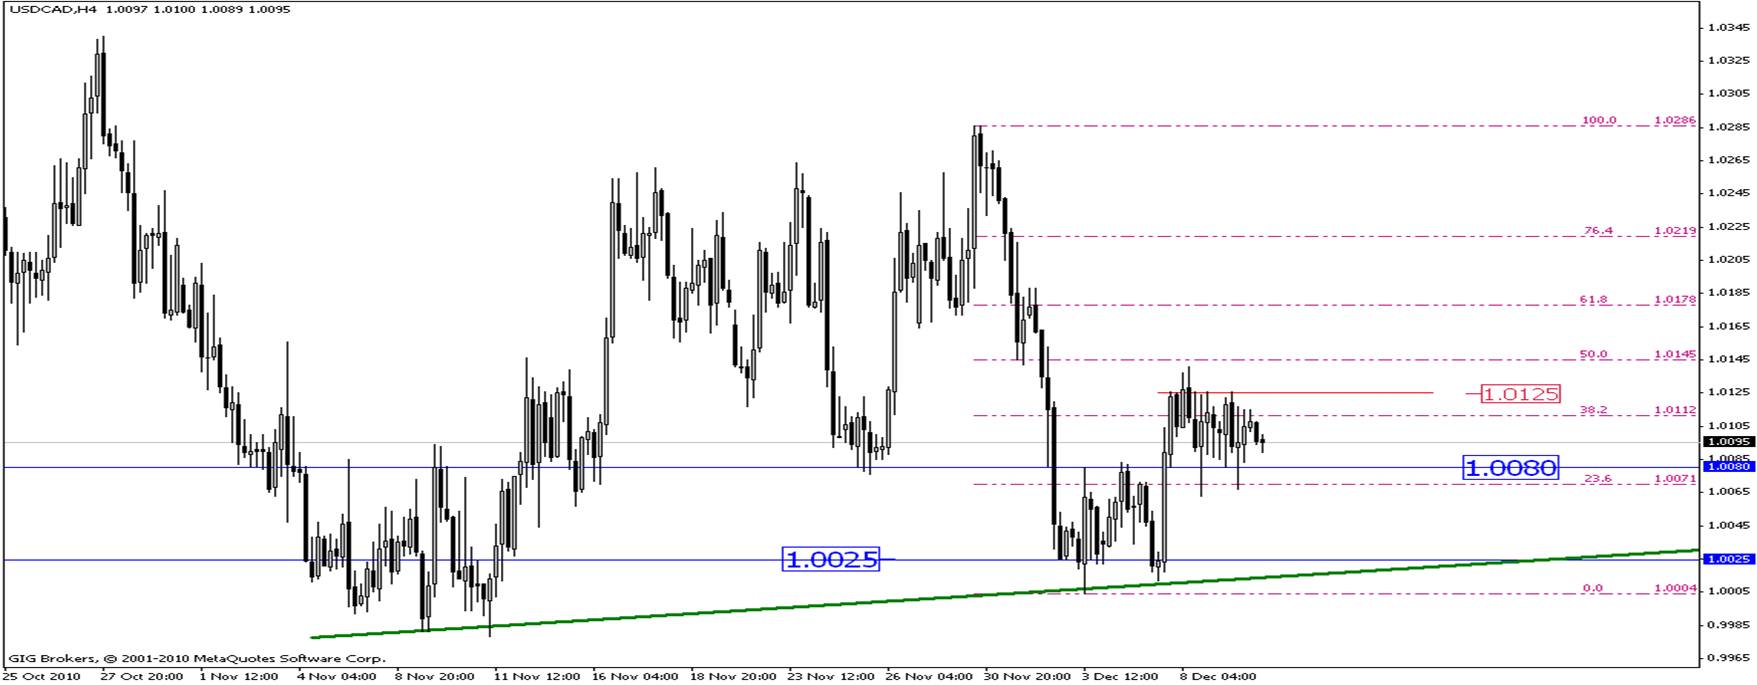
During yesterday trades the pair formed a top near the 1.0145 level which represents 50% Fibonacci retracement level for the bearish direction ( from 1.0286 to 1.0004 ) that pushed it down retesting the support level 1.0080 and forming a new bottom at this level, to continue at then the trades to be volatile and confused. with breaking several different levels it will determine the next trades directions, if the pair breaks the support level 1.0080 the pair will continue falling targeting the support level 1.0025 which may coincide at it the price with the bullish trend line for the medium period but in case of breaking the resistance level 1.0145 the pair will continue rising targeting the level 1.0219 which represents 76.4% Fibonacci retracement level for the latest mentioned bearish direction.
Res. 1.0148 1.0185 1.0227
Pivot 1.0105
Sup. 1.0070 1.0027 0.9992
[ATTACH]7447[/ATTACH]
AUDUSD
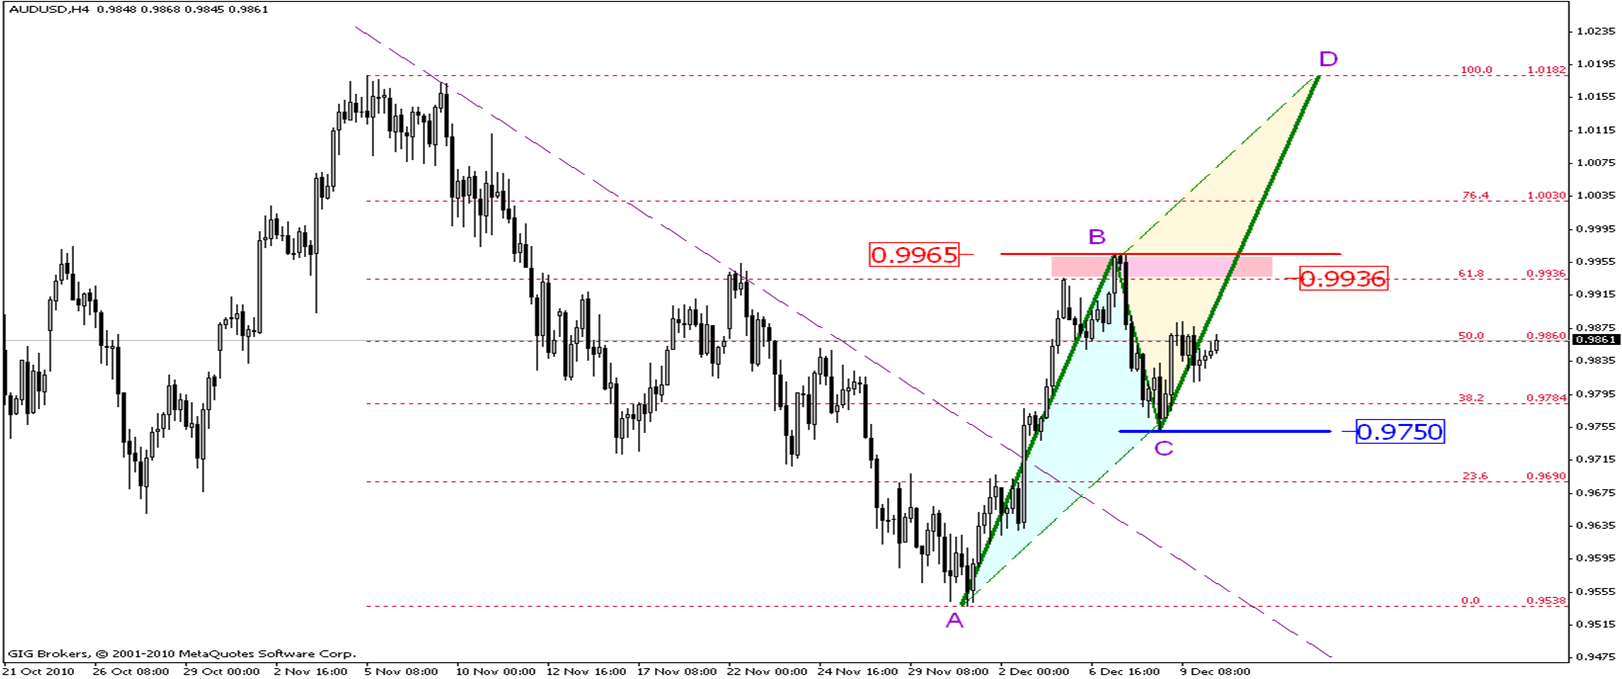
The pair formed a bottom at the support level 0.9750 which represents 50% Fibonacci retracement for the rib ( AB ) for the harmonic pattern AB=CD which is still in the forming process and will be confirmed with breaking the confined area which is between the level 0.9936 which represents 61.8% Fibonacci retracement level for the bearish direction ( from 10182 to 0.9538 ) and the level 0.9965 which represents the ( B ) point. it's expected in the next trades that the bullish action will be continued till the mentioned area, after breaking the level of the ( B ) point; the pair will continue rising till the level 1.0182 which represents the complement ( D ) point for the harmonic pattern. To reach this level; the resistance level 1.0030 must be broken.
This expectation depends on the stability of the support level 0.9750.
Res. 0.9849 0.9902 0.9951
Pivot 0.9800
Sup. 0.9747 0.9698 0.9645
[ATTACH]7446[/ATTACH]
Clients of GIGFX who has a real account can be able to see FULL Version for all 16 Currencies in member area section.
EURUSD
Euro declines for the second consecutive day against the U.S dollar; this declining was due to the support of the Irish bad news. On the contrast, the U.S dollar rose after releasing the statements by U.S. President Barack Obama, who reported the approval of the U.S. administration to extend tax cuts for two years. It is noticed through the chart that, the pair broke the bullish trend line that was formed for the short period, also the support level 1.3245 has been broken, so, the pair declined during the last intraday trades. Now, the pair is in its way to test the level 1.3198 which represents 50% correction level for the bullish direction (from 1.2965 to 1.3427). breaking this level is important to continue declining till reaching the level 1.3077 which represents the target for breaking the bullish trend line for the short period, the stability of the level 1.3198 could give the probability of forming a positive harmonic pattern which means rising again for the pair in order to re-test the resistance levels 1.3245 and 1.3319.
Res. 1.3354 1.3448 1.3496
Pivot 1.3306
Sup. 1.3212 1.3164 1.3070
[ATTACH]7457[/ATTACH]
GBPUSD
Yesterday, the pair did not succeed to break the resistance level 1.5800, where tried to test it yesterday and succeeded to close above it where recorded the highest price at 1.5821 and failed to be stable then reflected back downwards till now breaking the bullish trend line for the short period and the intraday trades and the support level 1.5740 which represents 23.6% correction level for the last bullish wave for the short period, it is expected that the pair will continue falling during the intraday trades of today targeting the support level 1.5565 which represents 76.4% correction level.
The stability of this expectation depends on the stability of the resistance level 1.5740.
RES. 1.5817 1.5878 1.5934
Pivot 1.5760
Sup. 1.5699 1.5642 1.5581
[ATTACH]7459[/ATTACH]
USDCHF
Yesterday, the pair rose breaking the resistance level 0.9855 forming a harmonic pattern Gartley in the early forming stage and the end of the pattern is supposed to be with the end of the CD wave which is supposed to be between the resistance level 0.9950 and the level 0.9977, so, it is expected that, the pair will rise for the intraday levels targeting this area and that a down corrective reflection will occur just hitting this area but under the condition of the appearance of a negative signals for the pair, this vision will be confirmed by breaking the resistance level 0.9905 that the pair is testing now.
The stability of these expectations depends on the stability of the support level 0.9850.
RES. 0.9920 0.9960 1.0048
Pivot 0.9838
Sup. 0.9792 0.9710 0.9664
[ATTACH]7458[/ATTACH]
USDCAD
Although the pair has broke the bottom line for the bearish flag pattern, the pair didn't achieve a good close under the support level 1.0025 which was previously mentioned the importance of this level to continue falling, therefore it's found for the pair to rise again using the formed bottom at this level to break up the resistance level 1.0080, the pair is on it's way to target the resistance level 1.0145 which represents 50% correction level for the bearish direction ( from 1.0286 to 1.0004 ) breaking this level is important for the pair to continue the expected rising till the level 1.0219
The failing to break the level 1.0145 means falling again to retest the level 1.0080 which represents an important level for the pair; for the short period.
Res. 1.0162 1.0201 1.0276
Pivot 1.0087
Sup. 1.0048 0.9973 0.9934
[ATTACH]7456[/ATTACH]
AUDUSD
The U.S dollar returned again to rise facing the AUD dollar, where the pair didn't trade a lot yesterday above the resistance level 0.9936 but the pair was pushed down till the support level 0.9860 which was not able to hold for long against this falling, and the pair was able to break this level down to continue falling. the pair is trading at the support level 0.9784 which represents 38.2% correction level for the bearish direction ( from 1.0182 to 0.9690 ) and the previously broken up, breaking this level down again means targeting the pair to the next support level at 0.9690.
This expectation depends on the stability of the resistance level 0.9860.
Res. 0.9919 1.0012 1.0060
Pivot 0.9871
Sup. 0.9778 0.9730 0.9637
[ATTACH]7455[/ATTACH]
Clients of GIGFX who has a real account can be able to see FULL Version for all 16 Currencies in member area section.
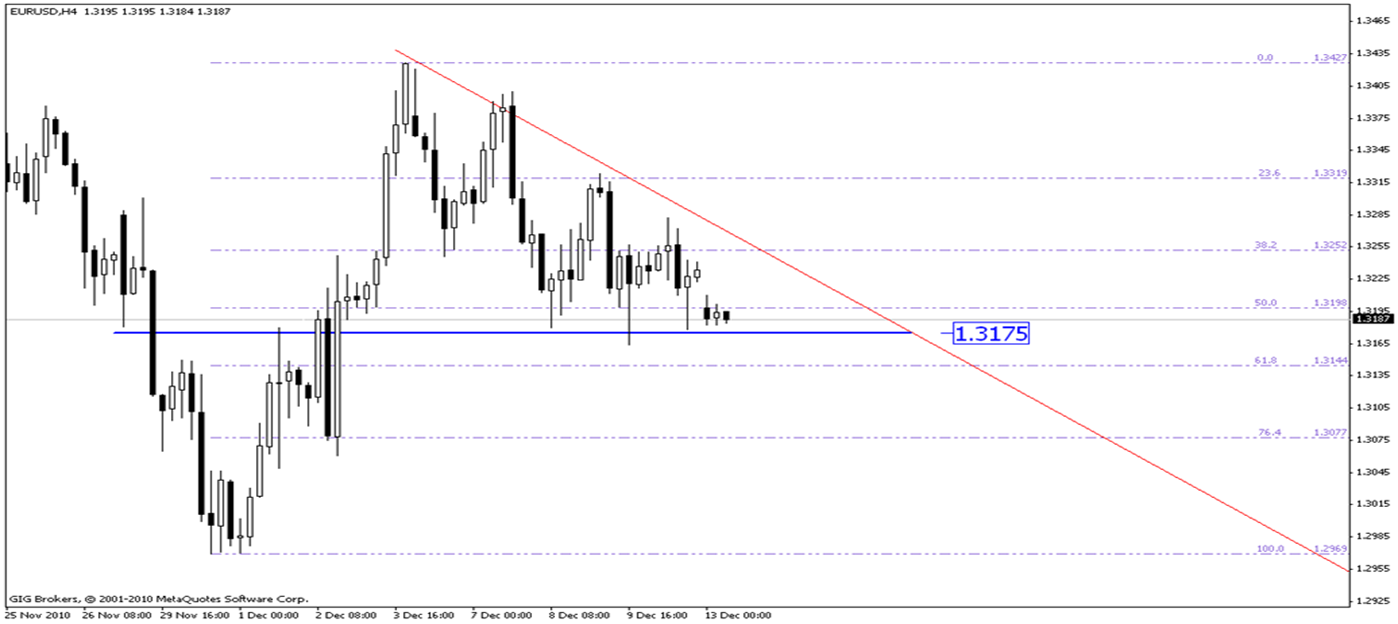
EURUSD
Euro continued declining against the U.S dollar at the end of the last week trades, whereas, the pair is still unable to break the short-term bearish trend line meanwhile, still unable to break 1.3175 support to confine the last trades in the area between the bearish trend line and 1.3175 support level. Breaking one of these levels is important to determine the upcoming trading direction for the pair, in the case of breaking the bearish trend line, the pair will continue rising till reaching the level 1.2427 but in the case of breaking 1.3175 support with good close below it, then the pair will continue declining targeting 1.3077 support level then to level 1.2969.
Res. 1.3284 1.3333 1.3388
Pivot 1.3232
Sup. 1.3181 1.3127 1.3076
[ATTACH]7484[/ATTACH]
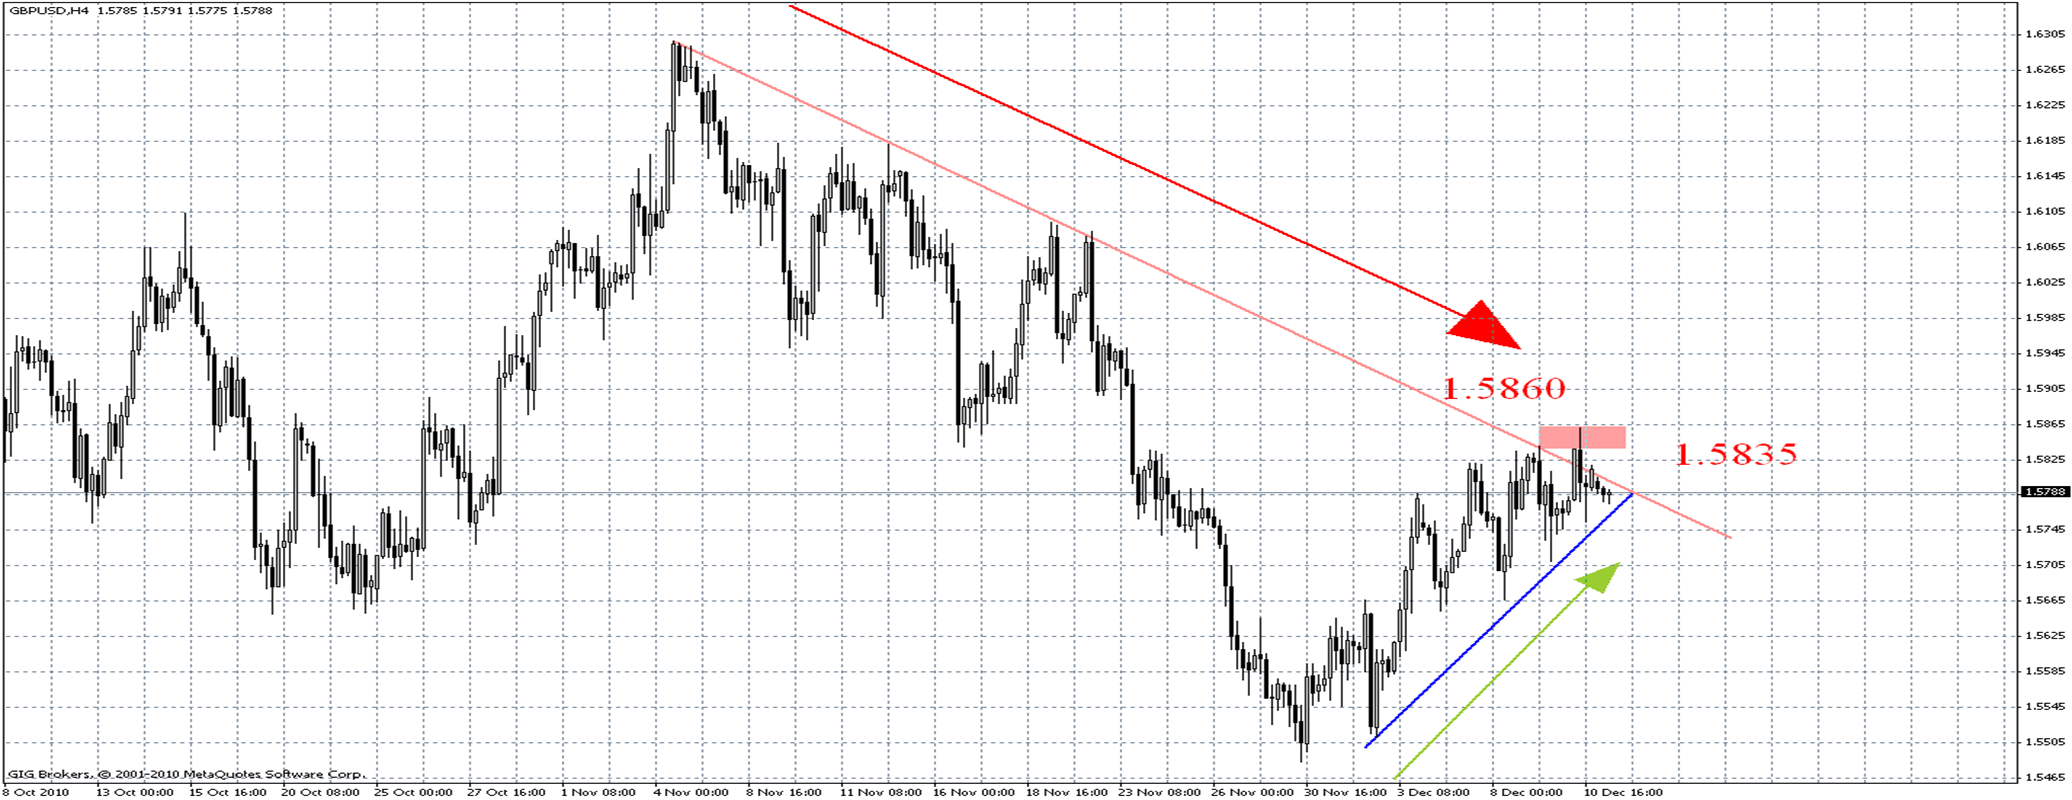
GBPUSD
The pair remains on the short-term and intraday levels in a bullish movement till now, to face previously 1.5862 level facing the bearish trend line for the medium and the long periods, generally the pair is now at a confusing area, where the bullish trend line for the short periods supports the short bullish move, also the resistances that are represented by the bearish trend line for the medium and long periods with the resistance area between 1.5835 and 1.5860 prevents the pair rising. So in case the pair was able to pass the mentioned resistances it will continue rising to reach the 1.5900 area, but in case the pair broke down the support trend line it may fall to retest the nearest support levels such as, 1.5750 and 1.5705.
RES. 1.5867 1.5923 1.5979
Pivot 1.5807
Sup. 1.5753 1.5693 1.5639
[ATTACH]7485[/ATTACH]
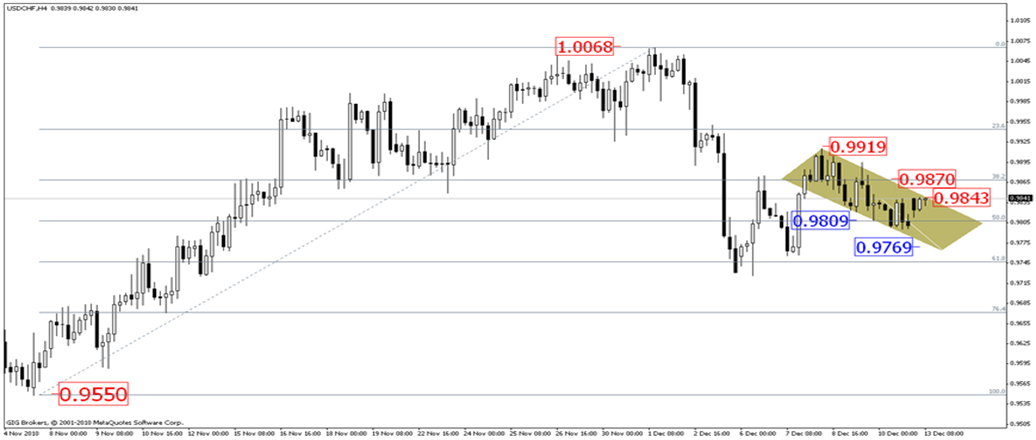
USDCHF
It is clear that, the pair is still continuing the declining movement that has been formed through moving inside a bearish channel at the end of the last week trades.
During the intraday trades of today it is expected that the pair will continue declining inside the bearish channel, the pair is below 0.9843 resistance level which represents the top boarder of the channel. So, it is expected that, the pair may reach 0.9769 support level which represents the bottom boarder of the channel, but under the condition of breaking 0.9809 support level with stability below, this level represents 50% Fibonacci correction level for the last bullish wave.
The stability of these expectations depends on the stability of the pair below 0.9843 resistance level.
RES. 0.9829 0.9858 0.9875
Pivot 0.9812
Sup. 0.9783 0.9766 0.9737
[ATTACH]7483[/ATTACH]
USDCAD
In this chart; it's noticed that the pair has formed a symmetrical triangle pattern, which reflects the volatility and confusion situation that dominated the trades of the pair during the last trades for the short period, the last intraday trades was confined in the triangle head area which gives a confirmation for a near break to one of the triangle's boarders, then the trades will be continued in the same breaking direction. If the pair breaks the top boarder; it will continue rising targeting the level 1.0178 which represents the targeted price for the pattern in this bearish move and which also represents 61.8% Fibonacci retracement correction level for the bearish direction (from 1.0286 to 1.0004) but in case of breaking the bottom boarder; the pair will continue falling targeting the level 1.0004 which represents the target price for the pattern in this bearish move.
Res. 1.0113 1.0130 1.0145
Pivot 1.0100
Sup. 1.0081 1.0066 1.0044
[ATTACH]7482[/ATTACH]
AUDUSD
The pair formed a bottom at the support level 0.9750 which represents 50% Fibonacci retracement for the rib (AB) for the harmonic pattern AB=CD which is still in the forming process and will be confirmed with breaking the confined area which is between the level 0.9936 which represents 61.8% Fibonacci retracement level for the bearish direction (from 10182 to 0.9538) and the level 0.9965 which represents the ( B ) point. it's expected in the next trades that the bullish action will be continued till the mentioned area, after breaking the level of the ( B ) point; the pair will continue rising till the level 1.0182 which represents the complement ( D ) point for the harmonic pattern. To reach this level; the resistance level 1.0030 must be broken.
This expectation depends on the stability of the support level 0.9750.
The previous analyze remains till this moment
Res. 0.9888 0.9929 0.9959
Pivot 0.9858
Sup. 0.9821 0.9789 0.9725
[ATTACH]7481[/ATTACH]
Clients of GIGFX who has a real account can be able to see FULL Version for all 16 Currencies in member area section.
- Free trading apps
- Over 8,000 signals for copying
- Economic news for exploring financial markets
You agree to website policy and terms of use
EURUSD
Yesterday trades were in a narrow range between the support level 1.3284 and the level 1.3385, these narrow range reflects the forming of the momentum that the pair will use it to determine the next trades direction, if the pair responded to the positive signals of reflecting the bearish direction for the short and medium period, one of which is the positive divergence that reflects the direction, the level 1.3284 will be stable against any bearish for the pair then rising to reach the level 1.3385 which with its breaking, the pair will continue rising to reach the 1.3445 which also with its breaking up, the pair is expected to reach the level 1.3575, but if the pair succeeded to break the support level 1.3284, it will fall to reach the support level 1.3235 which represents 161.8% continuous level for the bullish wave (from 1.3445 to 1.3785) at which, price may coincide with the medium Pitchfork line, if the pair succeeded to break this area, it will continue falling to reach the support level 1.3105.
Res. 1.3408 1.3444 1.3502
Pivot 1.3344
Sup. 1.3302 1.3244 1.3203
[ATTACH]7312[/ATTACH]
GBPUSD
Yesterday, the pair continued the bearish direction for the short period inside a bearish channel and also forming a harmonic pattern AB=CD which supposed to be completed by reaching the D point which located between the support level 1.5680 and the level 1.5635, so that, during the next trades it is expected that, the pair will rise in order to target this area.
The stability of these expectations depends on the stability of the resistance level 1.5805.
RES. 1.5793 1.5827 1.5861
Pivot 1.5759
Sup. 1.5725 1.5691 1.5657
[ATTACH]7313[/ATTACH]
USDCHF
The direction of the pair is bullish for the short period, and it is noticed that, a negative Gartley harmonic pattern has been formed and refers to the possibility of reflecting the pair down as a corrective direction for the bullish direction for the short period but after the complete forming of the pattern which is supposed to be completed by reaching the probably reflection area for the D point (the end of the pattern) and which is located between the resistance level 1.0055 and the level 1.0085, so, the price must be observed when reaching this area because the appearance of any positive signals means the beginning of a downward correction movement to target the support level 0.9825.
So that, it is expected that, the pair will rise up targeting the resistance level 1.0055 but after breaking the resistance level 0.9970 which the pair tried to break it and failed during yesterday trades, and what supports these expectations is the negative divergence with the stochastic index under the chart.
The stability of these expectations depends on the stability of the support level 0.9870.
Yesterday analysis is still remaining till now
RES. 1.0036 1.0066 1.0112
Pivot 0.9990
Sup. 0.9960 0.9914 0.9884
[ATTACH]7316[/ATTACH]
USDCAD
During yesterday trades, the pair formed a bottom around the support level 1.0071, whereas, the pair failed to continue the expected falling reaching the level 1.0000, during the current trades, the pair is trying to retest the level 1.0129 which represents the base of the pattern (double bottoms) that has been broken down previously. If the pair succeeded to break this level up, it will rise again to reach the level 1.0176 which with its breaking up, the pair will continue rising to reach the bearish trend line for the long period. It is expected that, testing the trend line may coincides with the resistance level 1.0222, if the pair failed to break the resistance level 1.0129, it will fall to achieve the target of the pattern at the level 1.0000.
Res. 1.0118 1.0144 1.0165
Pivot 1.0097
Sup. 1.0071 1.0050 1.0024
[ATTACH]7315[/ATTACH]
AUDUSD
The pair failed to break the resistance level 0.9580 during yesterday trades, to fall from this level to retest the nearest support levels, the pair broke the bullish trend line for the short periods and is trying to confirm the breaking of the support level 0.9723 during the current trades, this level represents the (B) point for the (AB=CD) harmonic pattern which the pair is tending to form, and the © point represented by the resistance level 0.9850.
Generally, it is expected that the pair will continue falling in order to form the rib (CD) that suppose to be around the level 0.9600 representing the expected (D) point.
This bearish scenario requires the stability of the resistance level 0.9850.
Res. 0.9851 0.9894 0.9939
Pivot 0.9806
Sup. 0.9763 0.9718 0.9675
[ATTACH]7314[/ATTACH]
Clients of GIGFX who has a real account can be able to see FULL Version for all 16 Currencies in member area section.