How to draw custom Monte Carlo indicator into the future
Hi, GN
Here's how I would approach it (never done it):
- calculate your 'future values' (for x length of periods you need) into a separate buffer.
- plot that buffer as you would normally from x to 0 (last current index)
- apply the SetIndexShift (obviously on init()) on that Buffer only; shifted for x length.
...and have a blast nuke-ing the charts :) (pun absolutely intended).
- is there a way to shift the price graph to the left of the chart, and draw my indicator on empty space to the right?Press the chart shift button (looks like an L with the left red arrow) adjust size with upside down gray triangle at the top of the chart.
Something like https://www.mql5.com/en/forum/102908/page24#325362 https://www.mql5.com/en/forum/102908 or https://forum.mql4.com/6130/page13#135613
Thanks a lot guys!
I guess i was using SetIndexShift() correctly, just as cameofx suggested, but i had no idea how to shift the chart. Thanks for the tip, whroeder!
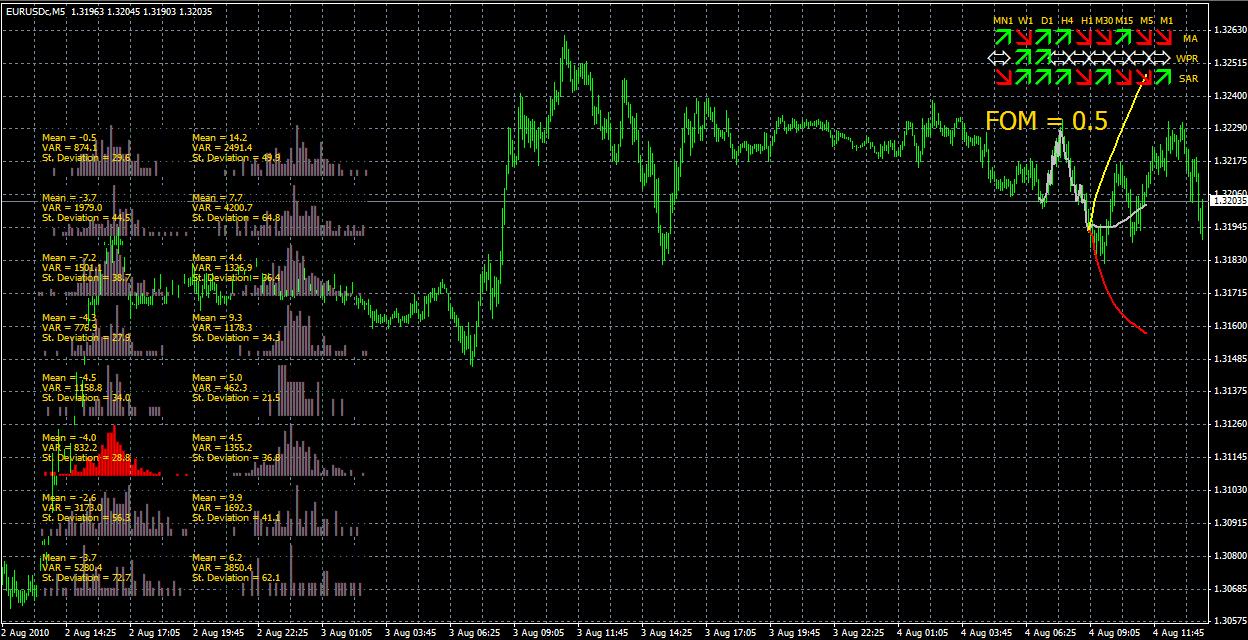
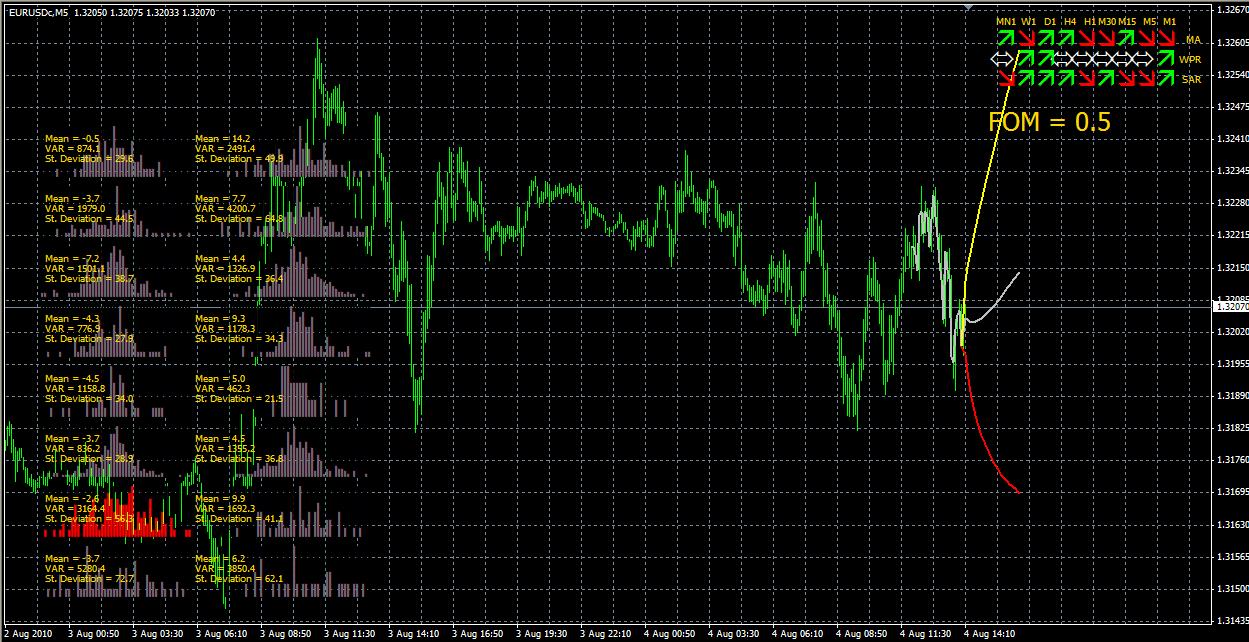
Now that i have a working backbone i can start to work on improving my horrendous statistics. Enjoy the screenshots:
Hi gatornuke
Do you mind sharing the source code, it looks very interesting indeed
Thanks
Ken
- Free trading apps
- Over 8,000 signals for copying
- Economic news for exploring financial markets
You agree to website policy and terms of use
Hello,
This is my first post. I have been reading these forums for a while in order to gain some insight on mql4 programming. My earlier programming experience was in C++ and VBA (if you want to call that a programming language). I'm glad that mql is so similar to C++, certainly makes things a bit easier for me.
I'm trying to apply some of my monte carlo programming knowledge from grad school (I'm a Nuclear Engineer) when I had to write C++ code to model transmission of photons in scattering and absorbing media. I did some reading on Monte Carlo methodology for finance and was amazed at the simplicity of the often-used geometric brownian motion model. It just seems counterintuitive to me to use same probability density function for all samples (why not just use a deterministic approach instead?), but I'm sure these guys know what they're doing. My approach will be substantially different, by sampling from different PDFs for different corresponding pricing "states", calculated on the fly from history data. This is consistent with the angular sampling methods from energy-dependent photon and neutron scattering cross-sections that I'm familiar with. At the end of this effort I'd expect to have an EA that can project future prices within a given confidence interval.
I'm a very visual programmer, so before witing my EA, I'm trying to write a custom indicator to see what the code is doing and to help me debug. I've been able to project prices through the price history for any given pair, but i'd like to draw my projection into the future as well. In other words, is there a way to shift the price graph to the left of the chart, and draw my indicator on empty space to the right? This would be like using a negative index on the indicator buffer. I read in a different post about the use of SetIndexShift(), but it doesn't seem to be doing what i want. Maybe I'll post some screenshots when i get back home from work, but in the meantime, if anyone knows what i'm trying to do, is there any way to do it?
I guess this isn't absolutely necessary, and it's not going to be used in the final EA, but it'd be nice to see nonetheless.
Thanks,
Ed