Easy ICT Price Action User Guide
The Easy ICT Price Action Indicator is a versatile and high-performance tool that provides valuable insights into price behavior, empowering you to develop effective trading strategies. It is an indispensable and practical indicator that should not be overlooked. With this indicator, you can gain a deeper understanding of price movements, enabling you to make more informed trading decisions. By analyzing price action and patterns, the Easy ICT Price Action Indicator reveals key market trends and potential trading opportunities. Whether you are a novice or experienced trader, this indicator is an invaluable asset in your trading toolkit.
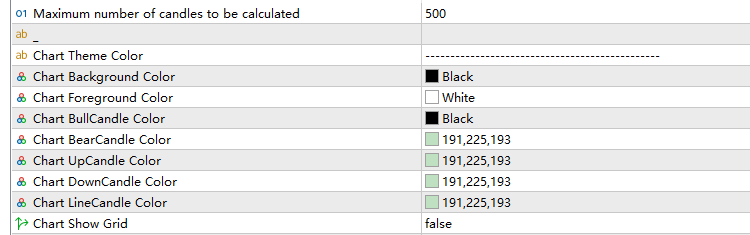
The maximum number of candles and the theme color of the chart
This set of input parameters is used to configure the theme colors of the chart. By modifying these input parameters, you can change the foreground color, background color, and colors of different types of candlesticks on the chart. This module overrides some of the chart color settings in the original properties of MT5/MT4 charts. Please note that after enabling this indicator, any color settings related to the chart can only be modified through the indicator settings. The settings in the original MT5/MT4 chart will be overridden by the indicator.
High Time Frame Market Structure
The market structure is composed of fractals, and based on the highs and lows of these fractals, we label them as
- H ------> High
- LH ------> Lower High
- HH ------> Higher High
- L ------> Low
- HL ------> Higher Low
- LL ------> Lower Low
The formation of high and low fractals in the market structure is also the formation of liquidity. High-timeframe market structure refers to a timeframe that is higher than the current timeframe. You can change the timeframe using the input parameters to display a higher timeframe market structure and liquidity. Please note that the input parameter "current" represents the default value, and the indicator already specifies a higher timeframe by default. Also, the timeframe you select must be greater than or equal to the current timeframe.


Breaker and Order Block
Breaker formation is based on the disruption of the market structure in the current timeframe. When a breaker forms, it indicates a change in the short-term market trend within the current timeframe. This presents us with an opportunity to enter the market. Once the breaker is formed, and the price retraces back to the range between the breaker and its high point, this area becomes a potential entry point.

Order blocks are typically formed by the aggregation of a large number of buy or sell orders, which may come from large institutional traders, fund managers, or other high-volume traders. The execution of these orders often leads to significant price reversals or rebounds in the market.Identifying order blocks can provide valuable reference information for traders, as these blocks often signify important turning points in the market. Traders can assess market strength and direction by observing the formation and reaction of order blocks, and make corresponding trading decisions based on this analysis.The Order Block indicator identifies the specific locations where institutional orders are placed. The indicator displays the order blocks using the symbols "+OB" for "Bullish Order Block" and "-OB" for "Bearish Order Block." However, you also have the option to customize the text according to your preference.
Fair Value Gaps
Fair Value Gab(FVG) is a range in Price Delivery where on side of the Market Liquidity is offered and typically confirmed with a Liquidity Void on the lower time frame charts in the same range of Price. Price can actually "gap" to create a literal vacuum of trading thus posting an actual Price Gap.In the indicator, you have the option to select the number of FVG extensions as well as their length. Additionally, you can choose to display the high, mid, or low points of the FVG. For instance, when the FVG is bullish, you can choose to only display the extension lines corresponding to the high points of the FVG. Conversely, when the FVG is bearish, you have the option to solely show the extension lines associated with the low points of the FVG.
Fibonacci retracement
The Fibonacci retracement feature is an enhanced version of the Fibonacci tool. It plots a series of horizontal lines on the price chart and includes stop loss and take profit levels, as well as entry signals such as StopLoss, 79%, OTE, 61.8%, 50%, Target1, Target2, and Target3. This feature automatically appears when there is a trading opportunity in the market. Once the Fibonacci retracement is displayed, all you need to do is patiently wait for the price to retrace back to the 62% to OTE Level, which is considered the optimal entry area according to the Fibonacci tool.
Session
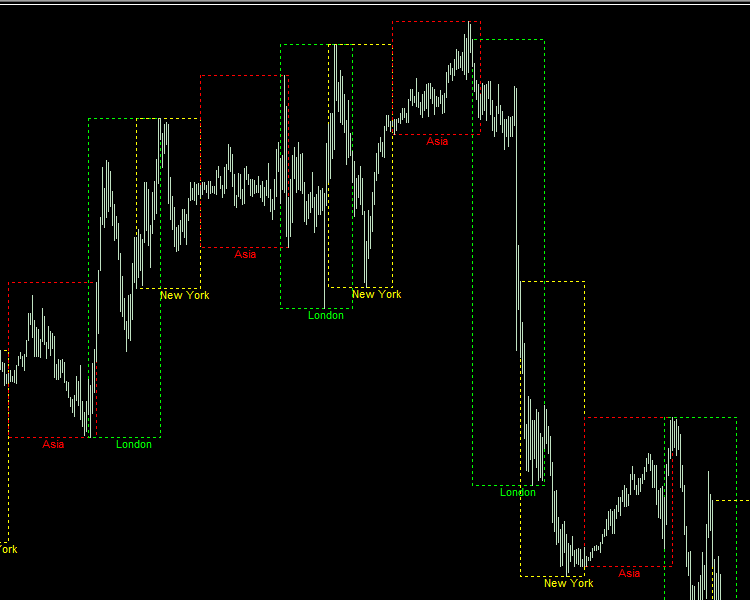
The trading session feature is crucial for traders as it directly impacts the volatility and trading opportunities of currency pairs, considering the different market activity times and trading volumes across various regions. To help traders gain a comprehensive understanding of the market dynamics and devise effective trading strategies, this indicator displays the trading hours of the Asian, London, and New York markets. As depicted in the chart below, significant price fluctuations typically occur during the London or New York trading sessions, while the Asian session tends to have relatively fewer price movements. Therefore, selecting the right trading session is essential for those seeking larger trading fluctuations, and the session indicator can provide valuable insights into the market conditions.
Silver Bullet
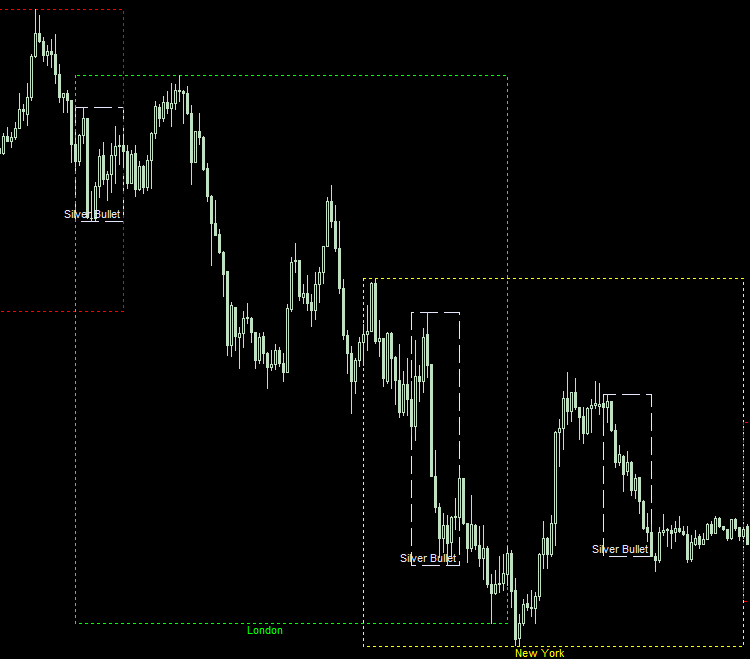
The three time zones mentioned in the ICT strategy are strategically chosen to capture significant market movements and potential trading opportunities. Let's explore the reasoning behind each zone:
- Zone 1: From 3 AM to 4 AM New York time (GMT 7:00 to 8:00)
- This time zone represents the intersection of the Asian and London trading sessions. During this period, there is an overlap in trading activities between these two major financial hubs. As a result, there is typically an increased trading volume, which can lead to significant price fluctuations and market opportunities.
- Zone 2: From 10 AM to 11 AM New York time (GMT 14:00 to 15:00)
- This time zone corresponds to the intersection of the London and New York trading sessions. Both London and New York are major players in the global forex market. The overlapping of these two sessions brings together a high concentration of market participants, resulting in increased liquidity and the potential for strong price movements.
- Zone 3: From 2 PM to 3 PM New York time (GMT 18:00 to 19:00)
- This time zone focuses on the afternoon session in New York, which plays a crucial role in determining the day's closing prices. As traders in New York prepare to wrap up their trading day, there can be a surge in trading activity and momentum as positions are squared and orders are executed before the market closes. This period presents opportunities for traders to take advantage of potential price movements before the end of the trading session.
By strategically selecting these time zones, the ICT strategy aims to tap into the periods of increased trading volume and market activity, where significant price moves are more likely to occur. It takes advantage of the intersections between different major trading sessions and aims to capture the forces that can drive the market during these specific times.
London AM and New York Lunch Liquidity
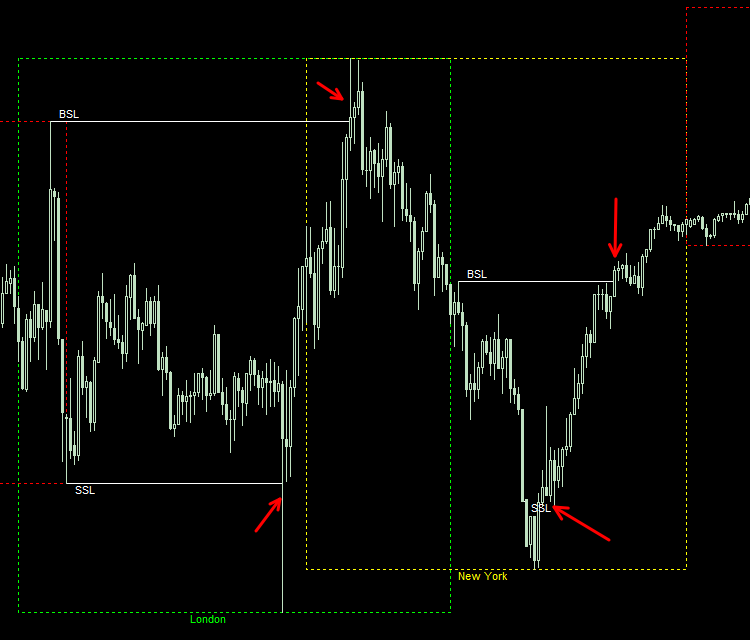
During the London AM session, it capitalizes on the liquidity build-up from both the Asian and London market openings. This particular time period tends to witness the accumulation of a substantial number of stop-loss orders around price highs and lows. Smart investors and institutions take advantage of these orders to align them with their own trading positions, strategically achieving their desired outcomes. Moreover, the New York lunchtime, characterized by sideways price movement and increased liquidity, also becomes an opportune period for smart money to exploit. If you wish to observe the liquidity during these specific sessions, you can simply set the corresponding indicator to "true" in order to visualize it.
Weekly Opening Gaps
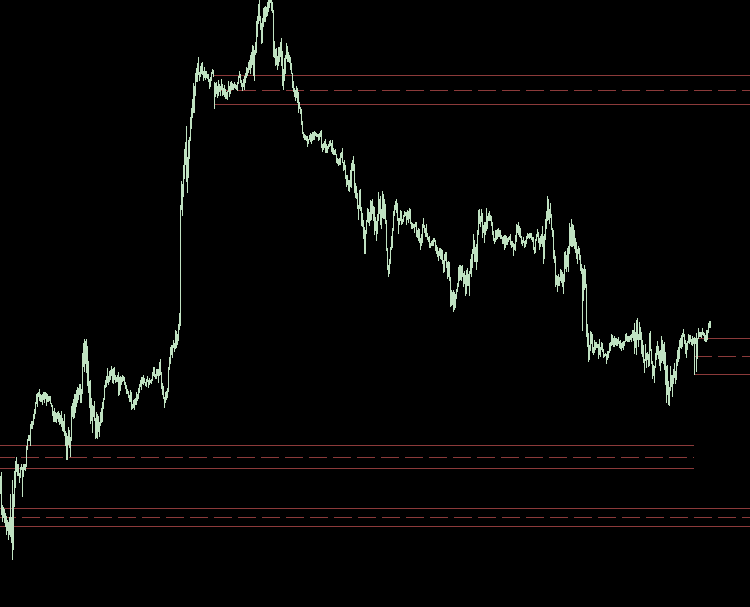
Weekly Opening Gaps play a significant role in price action as they serve as support and resistance levels. A gap occurs when the opening price of an asset on Monday is significantly different from the closing price on Friday. These gaps form due to various factors, such as news events, market sentiment, or overnight trading activity.
From a technical analysis standpoint, traders often view these gaps as areas of support or resistance. A gap-up opening suggests that there is strong buying pressure, which can act as a support level for future price movements. On the other hand, a gap-down opening indicates selling pressure, serving as a potential resistance level.
Traders pay close attention to these weekly openings gaps as they provide valuable insights into market sentiment and can influence trading decisions. They may look for price reversals near these levels or use them to set profit targets and stop-loss orders. Additionally, gaps can signify potential breakouts or breakdowns, adding to their significance.
In summary, weekly opening gaps act as support and resistance levels in price behavior, reflecting market sentiment and providing valuable trading opportunities.
Previous/Current daily/weekly/monthly high/low
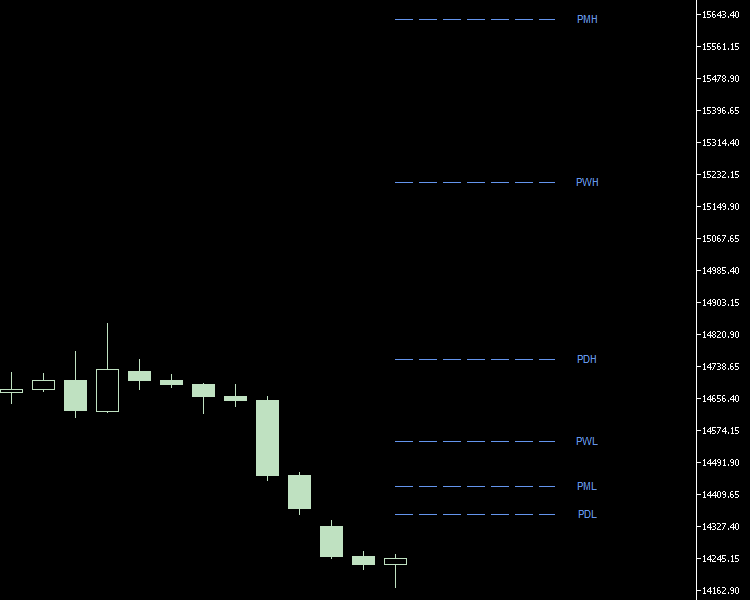
Previous daily/weekly/monthly high/low" refers to the highest and lowest price levels has reached during the previous day, week, or month.The previous daily high/low represents the highest and lowest price levels that were reached during the most recent trading day. Traders and investors often monitor these levels as they can provide insights into the current market sentiment and potential support/resistance levels.Similarly, the previous weekly high/low represents the highest and lowest price levels reached over the course of the previous week. This can be useful for identifying longer-term trends and key levels of support or resistance.Lastly, the previous monthly high/low refers to the highest and lowest price levels reached during the previous calendar month. This can provide a broader perspective on the price action and help traders and investors identify significant levels that may impact future price movements.Monitoring previous high/low levels can be part of technical analysis, which involves analyzing historical price data to make informed trading decisions.
The levels are what ICT mentions as potential draw on liquidity and motivation to make price move toward them or from those level out. Below are the short label version.
- PMH --> previous monthly high
- PML --> previous monthly low
- PWH --> previous weekly high
- PWL --> previous weekly low
- PDH --> previous day high
- PDL --> previous day low
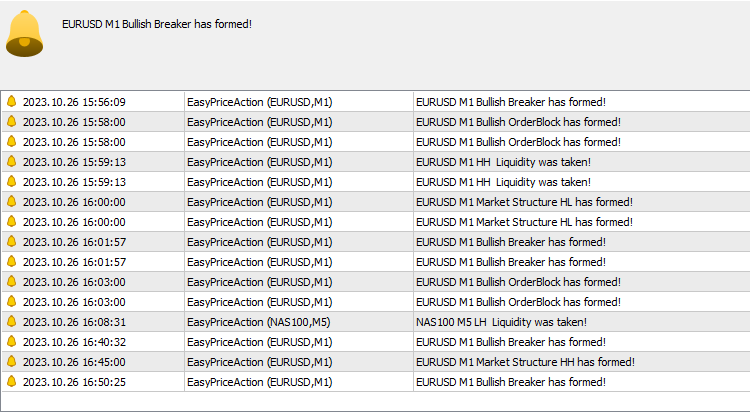
Alert
Alert Setting:
You can customize your alert settings in the terminal to stay informed about important messages. By going to "Tools==>Options==>Notifications," you can enable notifications for terminal messages and receive alerts through the app. Additionally, you have the option to set up email alerts by enabling the email setting in "Tools==>Options==>Email." These features ensure that you receive timely notifications and stay updated with the latest information.