
III. Strategy Main Body
- Order Flow Strategy:
- Order Flow Strategy Basics
- Multi-timeframe structure
- Timeframe Breaker Chapter
- How to effectively read candlestick charts?
- Return to the origin
Order Flow Strategy Basics

Trend traders are keen on trading breakouts, assuming that the trend will continue and believing that they can buy at a high price and sell at an even higher price. Because it is easy for them to bear the floating losses after entering the market, they also set up MAE and MFE to evaluate whether the maximum fluctuation range is favorable or unfavorable.
The concept of trend trading itself is not a problem, but trends do not last forever, so trading breakouts can easily become a Ponzi game of passing the buck.
The order flow strategy I want to share only uses breakouts to assist in estimating the direction. The core hypothesis is exactly the opposite of the trend-following strategy, or closer to the idea of buying and selling in reality: that is, only buying at wholesale prices and selling at retail prices when the price rises.
To those who do not understand the principle, the order flow strategy may seem like a high-risk strategy of buying when the price falls and selling when the price is still rising.
However, in my opinion, this strategy is quite safe, almost always resulting in buying low and selling high. It can be said that this is the infamous strategy of finding the explosive point.
The secret tricks of various experts and masters will now be shared with you for free.
All you need to do is to temporarily put aside what you have learned before and maintain an open-minded and receptive attitude to learn this strategy.
Pre-concepts of Order Flow Strategy
- Order Block - S2B/B2S
- Liquidity - Liquidity Pool (SSL/BSL), Stop Loss Hunt (SH)
- Liquidity Imbalance - Liquidity Gap, Fair Value Gap Value
- Equilibrium - Premium, Equilibrium Point, Discount Price
- Price Delivery - Range, Trend
- Momentum Conversion
1. Order Block
Definition:
An order block (OB) refers to the last bearish candlestick before a strong upward breakout of a structure or the last bullish candlestick before a significant downward breakout of a structure in any time period.
Usually, the OB is identified by the high and low points of candlesticks, regardless of whether it is a momentum candlestick with a large body or an interval candlestick with long shadows, as long as it meets the definition. [Can you think of why the candlestick shape is not important for OB?]
Compared with the concept of supply and demand, OB can be regarded as a broad concept of supply and demand zones, or supply and demand zones can be viewed as a specific type of order block. This is because supply and demand zones in supply and demand strategies refer specifically to interval candlesticks with mainly shadows such as spinning tops/crosses (with shadows greater than 50%). However, in practical application, it is found that some supply and demand zones are unrealistic - prices often reverse at large body order blocks rather than supply and demand zones.
The answer to the question in the brackets above is:
Price information is the same in any time period, but different time periods will change the appearance and quantity of the candlesticks.
It is important to fully understand and expand this sentence on your own! This is one of the underlying logics of naked candlesticks. If you only look at candlestick patterns, you may never be able to break out of confusion in your entire life.
In a previous article, I mentioned that when looking at multiple time periods, the time period is a relative interval. It is like using a magnifying glass to look at an object. In order to see more clearly, you can adjust the distance according to your own vision.
Even if you trade on a 1-hour time period, who says you can't refer to the trends of 15 minutes, 2 hours, and 4 hours?
Deciding which time period to trade is related to personal trading time, energy, capital, and risk tolerance, and has little to do with the trend of any time period.
Causes and Effects:
As for the causes, I don't know the specific truth, but the order flow theory can explain it, so for now, let's assume that it is true, because no one can understand all the market truths.
The key is how you view the market, what kind of market outlook you have, and how to trade based on your market viewpoint.
In order to go long, someone has to go short, and in order to go short, someone has to go long. Only when there is a buyer and a seller can a transaction be completed. If there is a lack of buy orders when shorting, the market price will fall to find buyers. Conversely, the market price will rise to find sellers. (Please refer to Daemon Goldsmith's "Order Flow Trading" for more information.)
Large institutions mainly trade using algorithms, and even if their large orders are split, they can still have a significant impact on the market price. They usually complete price delivery on a daily basis or match orders during the periods of the highest liquidity.
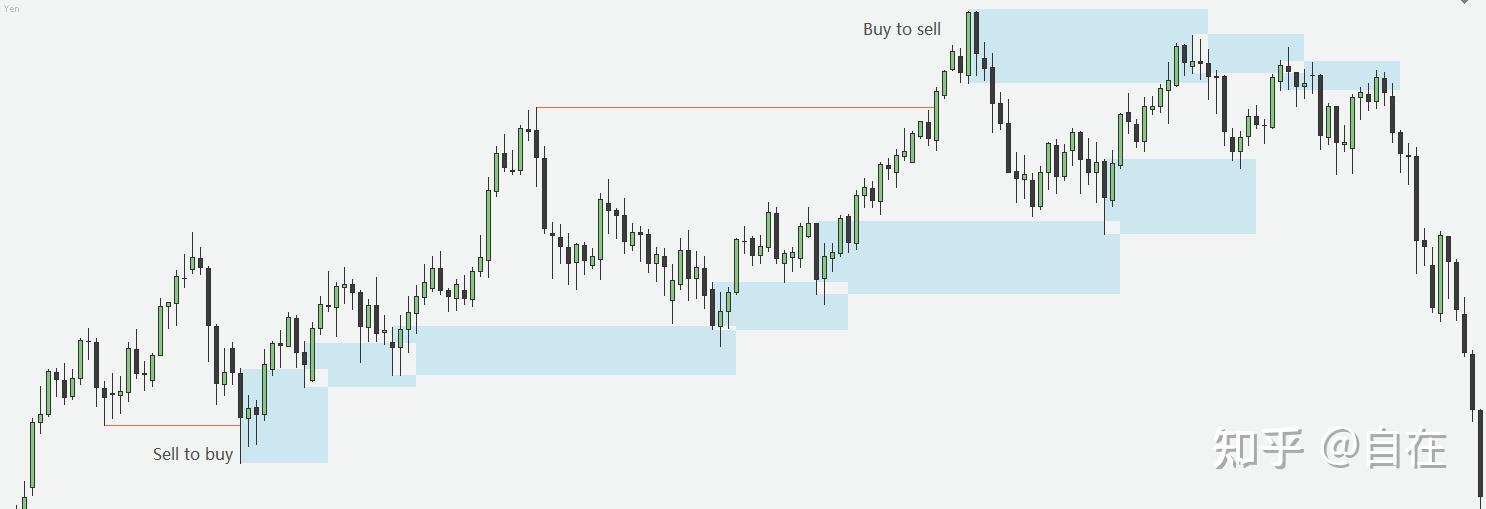
To ensure that the orders are successfully executed, and to reduce the adverse effects of orders on market prices and slippage costs, institutions will use the "sell to buy" or "buy to sell" method of trading at critical positions.
That is, first pushing down the price by selling to break through the support of the previous low, and then matching the small breakout sell orders and buy stop-loss orders (i.e., market sell orders) of retail investors with the large buy orders of institutions (the main bodies of the completed transactions are the institutions' own sell orders).
After the price rises, the institutions' sell orders are trapped as costs. If it is a retail investor, they may have to stop loss. However, with abundant assets, institutions can recover costs by selling to make a profit (traditional technical analysis refers to this behavior as testing or pullback confirmation).
If the institution's orders have not been completely filled, they will use the order flow of the recovered costs to trade near the initial cost price. These behaviors are reflected on the chart as a confirmation of a price reversal, which opens a new trend.
The institution's cost accumulation area is the order block. A large number of order costs are stacked inside, which is an area that institutions will definitely protect.
Not all order blocks will be recovered quickly, and don't be too rigid about the concept of order flow. Don't try to seek certainty. The order flow strategy is just a probability advantage.
2. Liquidity
Definition:
In speculative markets, liquidity can be simplified as outstanding orders waiting to be filled.
There are roughly three types of orders:
- Market orders
- Limit orders (also known as pullback orders)
- Stop orders (I prefer to call them breakout orders)
Price movements are mainly driven by market orders, which consume liquidity. Limit orders and stop orders can provide liquidity, but in different ways.
Limit orders are prioritized by price and can only be matched and executed when the price reaches the specified price level, without slippage (if limit orders always slip, there must be a problem with the platform).
Stop orders are prioritized by execution, providing liquidity when not yet filled, and consuming liquidity when executed as market orders.
Note that all three types of orders can choose to set a stop loss or not.
Setting a stop loss is like drawing a little blood for self-protection. Not setting a stop loss is like risking your life.
The above describes the providers and consumers of liquidity from the perspective of order types. Now let's talk about the participants:
The main providers of liquidity in the foreign exchange market are large institutions such as banks, which ensure the basic circulation and exchange of currencies. They are also the main consumers of liquidity, and obtain liquidity through various means.
Secondly, there are many speculators and retail traders, although the number of participants is large, the amount of funds they control is only a small proportion.
Usually, liquidity and price volatility are inversely proportional: when liquidity is scarce, price fluctuations are severe and often gapped; when liquidity is sufficient, price fluctuations are more stable.
Therefore, trading in a market environment with insufficient liquidity is disadvantageous for the cost of large institutions.
To obtain sufficient liquidity, there are mainly two ways:
- Trading during the high volume overlap of the European and American sessions.
- Establishing and absorbing liquidity pools.
liquidity pool:
A liquidity pool refers to an area where a large number of pending orders are stacked up, usually outside the high/low points of a large period.
At this critical location, there are stop-loss orders from participants who have entered the market, as well as stop orders from those who have not yet entered the market. Once the price breaks through this area, a large amount of liquidity can be obtained.
We don't need to check the market depth chart or open the 10-level order book. Logical analysis and observation are enough. Even liquidity distribution charts or order flow software may not do better.
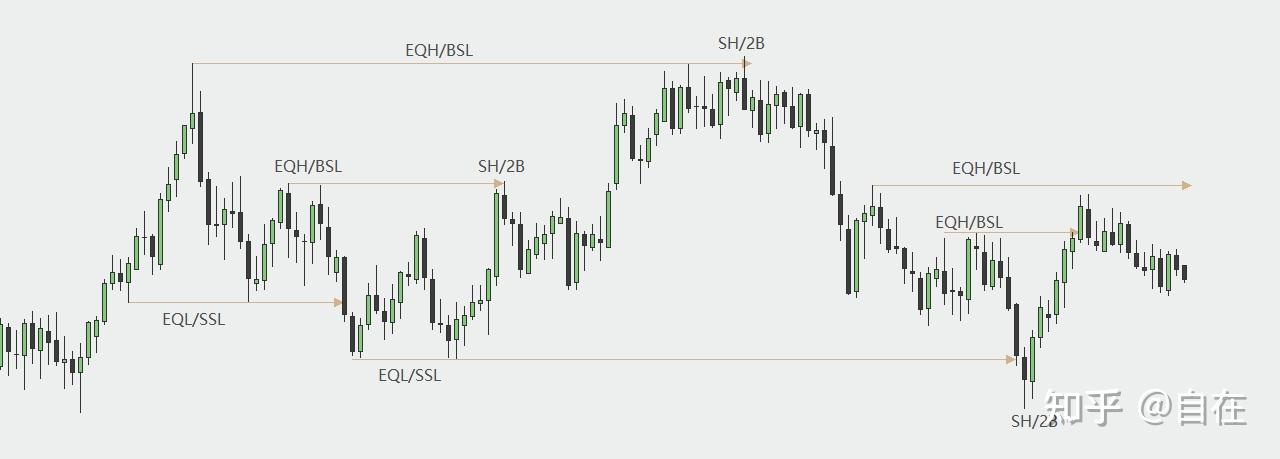
The stop-loss orders outside the high point are short stop-loss orders. If the price breaks through the high point, the short stop-loss orders will be converted into market buy orders, so it is called buy-side liquidity (BSL).
The long orders outside the low point will be converted into market sell orders after the stop loss is triggered, providing sell-side liquidity (SSL).
However, not all areas outside the high/low points belong to liquidity pools. Only the support and resistance levels commonly used in technical analysis are.
Yes, the common support and resistance levels are traps established by big players using a large amount of funds!
The more times the price touches the support and resistance levels, the weaker the support and resistance will be, and the accumulated stop-loss funds in the liquidity pool will be larger.
Then the institutions can start harvesting--or say, get the stops through the S2B/B2S method (SH: stop hunt), and use SSL/BSL to complete order matching.
Therefore, technical patterns such as double tops/bottoms, equal high points (EQH)/equal low points (EQL), are all good liquidity pools.
Function:
The significance of liquidity is like fuel for a car or food for an animal.
In order to complete price delivery, institutions need liquidity. They take high-point liquidity when prices go up, and accumulate liquidity at low points, and vice versa.
One point to note is that the liquidity provided by retail traders is far from enough for institutions. However, over time, the use of techniques by retail traders has coincidentally placed their stop losses within the liquidity pool established by institutions. By using this additional liquidity, institutions can save a lot of costs.
Buy-sell liquidity pools and stop-loss hunting.
3. Liquidity Imbalance
Definition:
In any timeframe, large candlesticks and consecutive candlesticks in the same direction belong to liquidity imbalance, which indicates that there are only buy orders or sell orders in these candlesticks. This situation is inefficient and unhealthy for the market, and algorithmic trading by institutions will inevitably guide the price (immediately or in the future) to fill these areas (completely or partially).
There are two main types of liquidity imbalances worth noting:
- Liquidity Void (LV)
- Fair Value Gap (FVG)
Liquidity Void:
Liquidity void refers to large candlesticks and price gaps, representing an extremely strong state of imbalance.
In the area of the large candlestick and gap, either buy or sell orders are seriously insufficient, so orders must match sell orders upwards or match buy orders downwards.
If you have order flow software, you can see that within the body range of the large candlestick, the volume of completed orders is thin, and many price levels have zero completed volume.
Large candlesticks in larger timeframes, when viewed on smaller timeframes, may be large bodies or consecutive candlesticks in the same direction. The difference between the two is that the former is more imbalanced.
Fair Value Gap:
Refers to the gap between the shadows of two candlesticks before and after a certain candlestick. If the shadow of the candlestick to the right of a candlestick does not test the shadow of the candlestick to the left, the gap between the shadows of the candlesticks on both sides is called a fair value gap.
Function:
Liquidity imbalance is one of the signals for large capital to enter the market. In most cases, the price will return to fill the gap and maintain balance in the market. The order flow strategy is to follow the footsteps of large capital and trade, rather than recklessly chasing or killing the market.
However, sometimes due to macro factors or market sentiment, the price may not return, which is difficult to avoid and predict by any analysis method.
4. Value Balance
Definition:
Value is a relative concept, and whether the price of a commodity is expensive or cheap depends on the reference point we use.
For example, a juicer may seem expensive if we only look at the price, but when considering its overall lifespan and experience, the cost spread over each day is actually cheap.
Trading also has a reference point, which is the price range.
It is important to note that this range does not refer to consolidation, but rather the area between two price high and low points.
For example, the high and low points of a consolidation area form a price range, and the high and low points of a wave segment also form a price range.
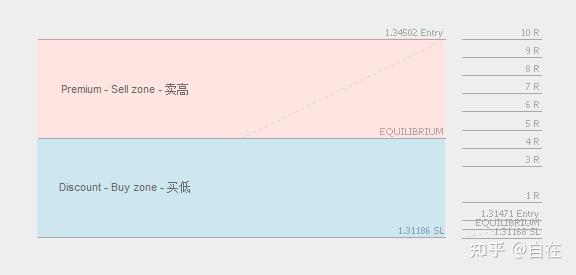
We use the average price of the price range (i.e., the midpoint of the range) as the boundary, with the area above the average price called the premium area, the area below the average price called the discount area, and the midpoint where the average price is located is the value balance point.
Function:
When everyone is selling, who is buying?
When everyone is buying, who is selling?
Why do some people buy at low points? Because it's cheap! Why do some people sell at high points? Because the premium is too high. Institutions always operate in this way to easily obtain liquidity and complete price delivery.
Using value balance, in a consolidation market, we look for selling opportunities in the premium area and buying opportunities in the discount area; in an uptrend, we only buy in the discount area; in a downtrend, we only sell in the premium area.
5. Price Delivery
Definition:
Price delivery, as the name suggests, refers to the delivery of prices or the fulfillment of prices, but this is not an accurate description of the concept. From the perspective of order flow, a more appropriate translation would be "price transmission".
Price transmission refers to the behavior of institutions to bring order flow from one area to a specific area in order to achieve their goals.
There are two main actions involved in price transmission: accumulating liquidity in a range, and then consuming liquidity to bring prices to another price range (i.e. a trend).
Range:
Range is an extremely important concept. Wyckoff's accumulation or distribution model is all about range, and the popular Chinese technical analysis theory "Chen's Center of Gravity" also revolves around range.
Why is range so important?
Range is a tool that institutions use to accumulate liquidity. As mentioned earlier when discussing the concept of liquidity, liquidity is like the fuel that powers a car engine. What drives the market? Money! Only a large amount of capital can drive the movement of the candlesticks up and down.
There are two types of ranges: consolidation ranges and pullback ranges.- Consolidation ranges: Prices move sideways in the consolidation range, and liquidity is accumulated within the range.
- Pullback ranges: Occur during a trending market and are used to recycle costs and transmit prices.
Trend:
In the concept of order blocks, it was mentioned that institutions trade through the sell to buy or buy to sell method, mainly in the consolidation zone (either type of zone).
In a trend, the behavior of institutions to retrace the price is called "Mitigation", which is also a type of S2B/B2S, meaning the price returns to the starting point of the retracement, recovering some or all of the costs.
Price delivery process:
From accumulating in the consolidation zone, to the trend starting and breaking out, then retracing to recover costs, and continuing to push the trend until entering the next consolidation zone, this is the cyclic process of price delivery.
The process of price delivery is like playing ball. Consolidation is like fighting for the ball in place, while the trend is like dribbling the ball forward. If the ball is lost, it must be retrieved sooner or later.
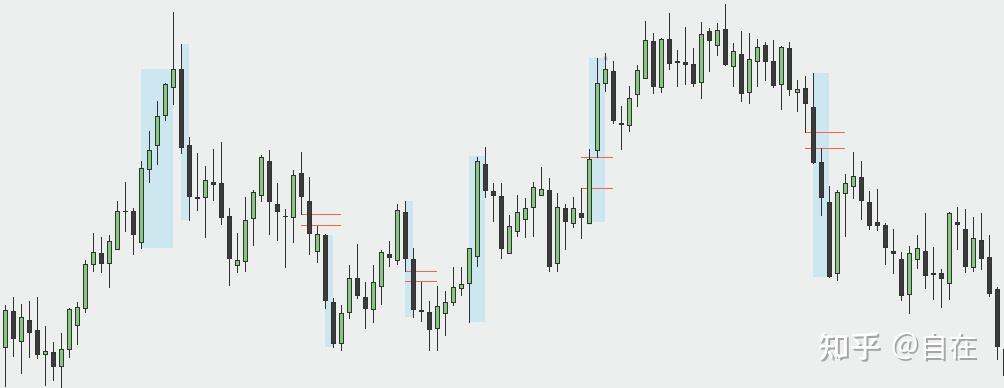
Next, we will use a volume distribution chart to explain: 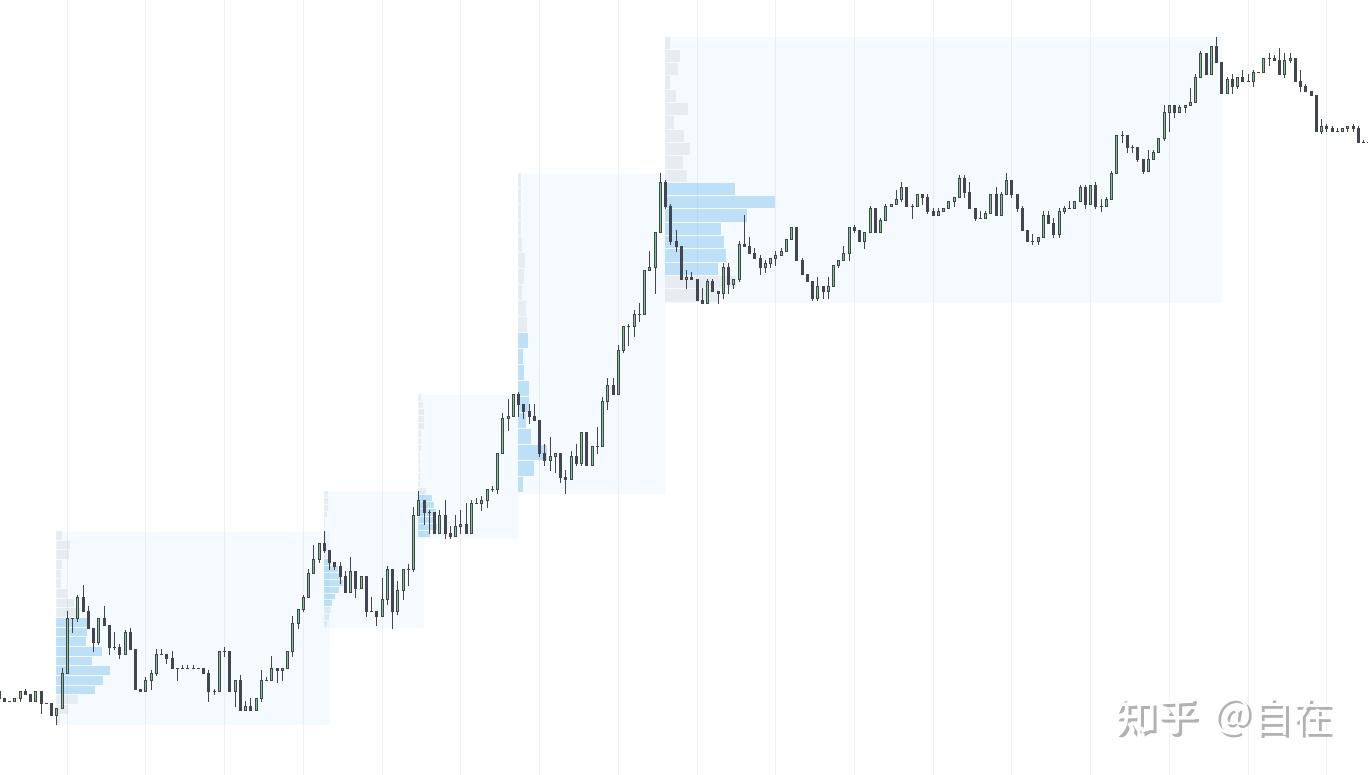
The lower left and upper right sections belong to the consolidation phase (the lower left part is not fully displayed), while the middle three blocks represent the trend (pullback - push).
The stacked color blocks on the left side of the light blue block represent the changes in trading volume in each area. The longer the color block in the high volume area, the shorter the color block in the low volume area.
It can be seen that the orders in each area are mainly concentrated in the bottom range.
The first three areas all show the behavior of price pullback (S2B), but in the fourth area, the price did not pull back. What's going on here?
This is the behavior of the ball dropping that we mentioned earlier. From the perspective of order flow, it is a liquidity imbalance, and the price may return here in the near or future future to balance liquidity and conduct cost recovery.
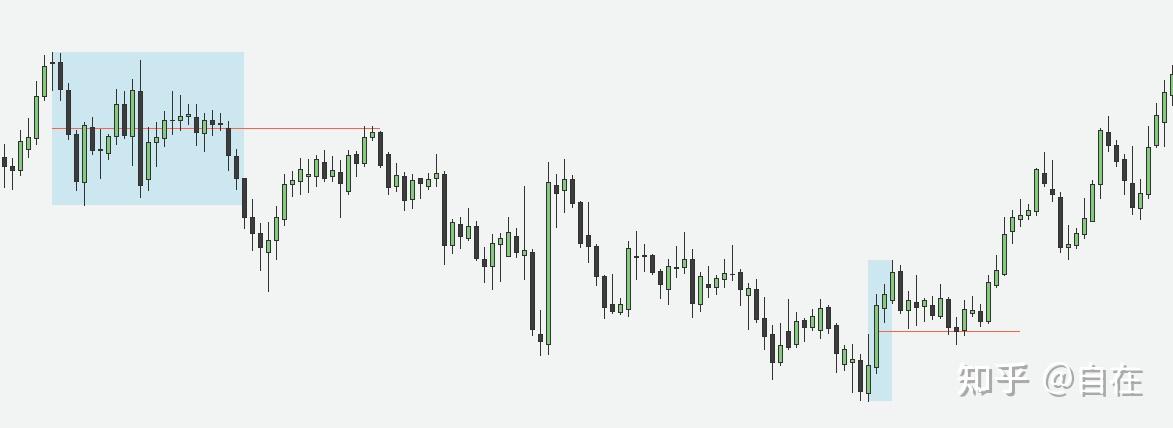
A liquidity imbalance in price delivery is our trading opportunity.
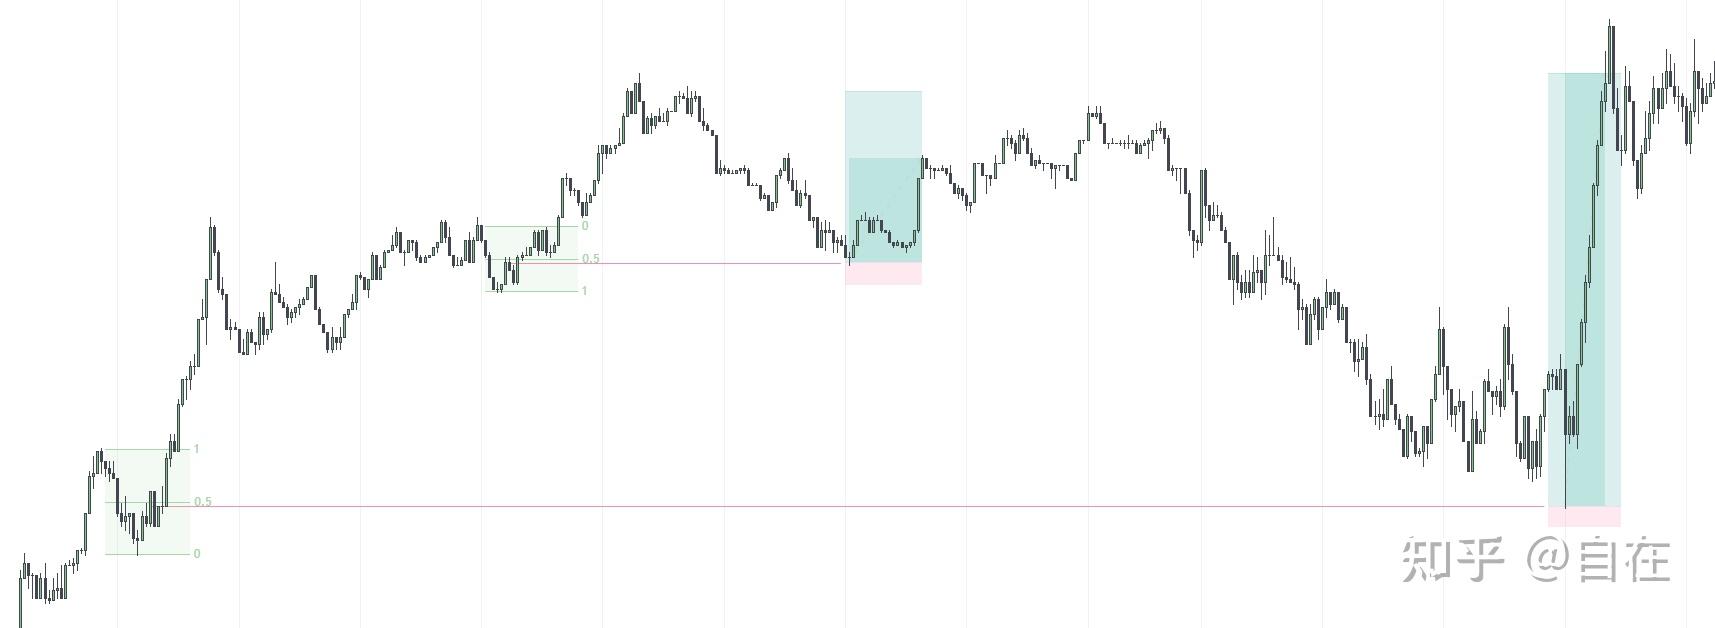
In the left imbalance area, mark the premium and discount areas of the pullback interval, identify the bearish bar that spans the two areas as the entry point at 50% of the interval (balance point), set the stop-loss point at the closing price of the bearish bar, and set the first target at the high point of the wave.
The stop loss of this trade is less than 1 point, with a profit-to-loss ratio of over 20R. If the stop loss ratio is set at 5% of the capital, it has already doubled.
This example is mainly used to explain price delivery, and it is not recommended to trade heavily without proper position management.
In addition, as I mentioned in the order block concept, all timeframes provide the same information, so it is reasonable to look at the 1-minute chart. As long as you can understand the 5-minute, 15-minute, 1-hour, and 4-hour timeframes from the 1-minute timeframe from bottom to top, you can analyze the market effectively (this has been discussed in other articles).
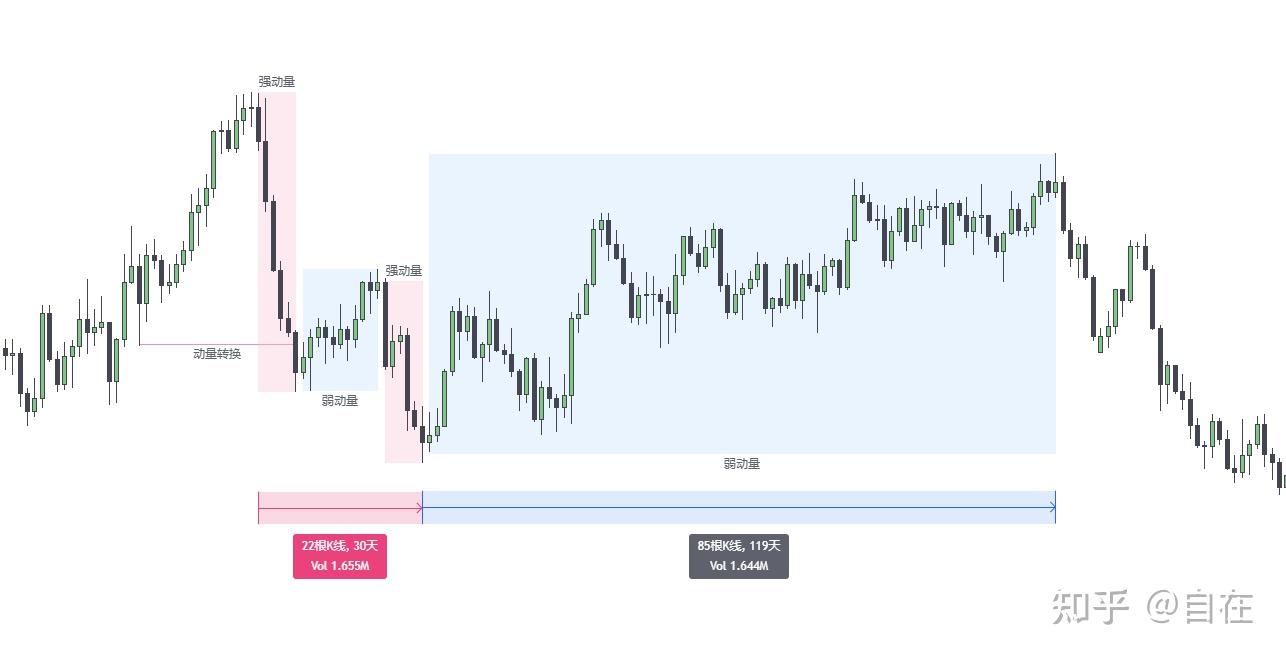
- Momentum Conversion
Momentum is originally a concept in physics, but in the trading market, momentum refers to the strength of short-term price movements.
To judge the strength of momentum, we need to observe the relationship between price in time and space:
- Strong momentum has a short time span and covers a large distance. It uses only a small number of candles for a price move.
- Weak momentum is the opposite. It covers only a short distance and takes a long time to complete.
The underlying factors are the size of new fund inflows and the urgency of institutional intentions (whether the priority is to complete transactions or to control cost).
Therefore, the speed of price movement determines the direction of momentum:
- Pushing: Strong momentum. Price moves rapidly and breaks through structures, indicating strong continuity.
- Pulling back: Weak momentum. Price moves relatively slowly in the opposite direction without breaking through structures, creating liquidity in the pushing direction.
One important keyword to note is "breaking through structures." If a trend seems to have strong momentum, such as a sudden rise with large real body candles, but ultimately fails to break through structures, the momentum is invalid.
The Wyckoff Law of Supply and Demand talks about this kind of effort without results (not exactly the same).
If institutions have a strong desire to change the price direction, they will definitely break through structures and close outside of the structure with real body candles, rather than just breaking through with shadows.
Once the price breaks through the structure, the direction of momentum has already changed. We should follow the new direction until we hit recent order blocks or liquidity pools.
Note:
Momentum conversion does not necessarily mean a trend reversal. It may only be to return to an imbalance area and complete price delivery.
Structure-based Order Flow Strategy [3]
If we say that the concepts of Order Blocks and Imbalances are derived from Wyckoff's Law of Supply and Demand, then the concepts of Price Transmission and Liquidity belong to Wyckoff's Law of Cause and Effect.
No trading strategy comes out of thin air, and all theories are developed based on the work of previous researchers. Order Flow and Supply and Demand strategies are refinements and supplements to Wyckoff's Theory (I'm not suggesting that everyone go and learn Wyckoff's Theory, the key is to choose a theory that you can understand and delve into it!).
From the perspective of profitability, it is certain that there is a distinction between trading strategies.
For example, the widely circulated Turtle Trading Strategy has not only fallen into a soup of stop-loss hunting, but even in its heyday, its success rate was extremely questionable.
There is a brainwashing fallacy circulating among retail traders, that all trading systems will fail and therefore need to be constantly optimized.
If a strategy fails, it means that it is not a true trading strategy (only temporary strategies will fail, not strategy logic, unless the starting point of the logic is wrong).
Just like there are many factor models in Behavioral Finance, they may become ineffective due to an increase in users or changes in market environment. These arbitrage strategies that target market loopholes will inevitably fail as the market is repaired.
So what is a true trading strategy?
I think it is a strategy that is closer to the essence of the market, such as Dow Theory and Wyckoff Theory, which have remained effective in the market changes of the past century. This is because no matter how the market environment changes, its inherent logic changes very little.
The process of using a certain strategy is a process of constantly resonating with the market's subconscious. However, it is important to clarify whether the operating rules of this market are derived from the real market or from a subjectively imagined market.
A good strategy can be incredibly helpful to a trader, because it will change your view and ideas about the market, and these fundamental things will never be easily invalidated.
Concept Integration
To the point, how to combine the concepts to form a trading strategy?
In fact, I think the greater role of this article is to inspire readers to observe the market based on these concepts. As for the specific operational methods, it becomes less important.
I will try to summarize it briefly:
-
Use the breakout of the structure in the larger time frame to establish a bullish or bearish expectation.
-
Mark the unrecovered order blocks and liquidity.
-
Wait for the price to return, and use the order block's high and low points as entry and stop-loss points.
-
Place take-profit near the structural points formed during the return (near recent high or low points).
1.Direction of long and short positions
Why use a larger time frame instead of the current time frame?
Of course, to achieve a better risk-reward ratio!
Using any time frame is fine if you are satisfied with a 2R or 3R single profit and loss ratio. But if you want to achieve a 30R or even a hundred R profit and loss ratio, either the time frame is large enough, or the entry time frame is small enough (in seconds/ticks).
What is a large time frame?
Anything larger than the current time frame is a large time frame, and this is a relative concept.
Does the direction of long and short positions have levels?
Of course! The larger the level, the more capital it carries. The direction changes slower on the chart and appears more stable.
The smaller the level, the less capital is needed to change direction, and the change is too fast and becomes so-called "noise."
Think carefully about the intraday noise mentioned in the Dow Theory and under what historical background it was proposed?
If there was a computer charting software at that time, it would not have been difficult to calculate, and it is ridiculous that there are still many people in China who think that intraday trading is a dead end.
Market trends have fractal characteristics, and the trends on different time scales, from years, months, weeks, days, to hours, minutes, and seconds, are self-similar.
The time frame used depends mainly on:
- Trading duration
- Capital
- Reaction ability and strategy
How to deal with different directions of different time frames?
When we enter a new market, the first thing we do is to conduct a structural analysis from top to bottom.
Starting from the monthly or weekly chart, we check the latest structural breakthroughs to judge the macro direction of the market.
As mentioned earlier, the larger the time frame, the slower the direction changes.
Therefore, on the monthly or weekly chart, we look at the overall direction of several years or more.
- Daily = monthly direction
- H4 = weekly direction
- H1-H15 = daily direction
- 5m-1m = hourly direction
The directions of different time frames cannot be completely consistent. We only need to observe two time frames: the trading time frame you choose and the larger time frame.
Mark the reaction area on the larger time frame, and then follow the trend structure (order flow) of the trading time frame.
2. Marking
What is marking?
It means making notes and setting alerts on your trading software.
What should be marked?- Recent structural breakouts or momentum shifts forming trading ranges
- Discount/premium zones of the range, buying at the discount zone for longs or selling at the premium zone for shorts
- Unrecovered order blocks, and setting alerts near the order block (turn up the volume so you can hear it if you leave your computer)
- Liquidity pools
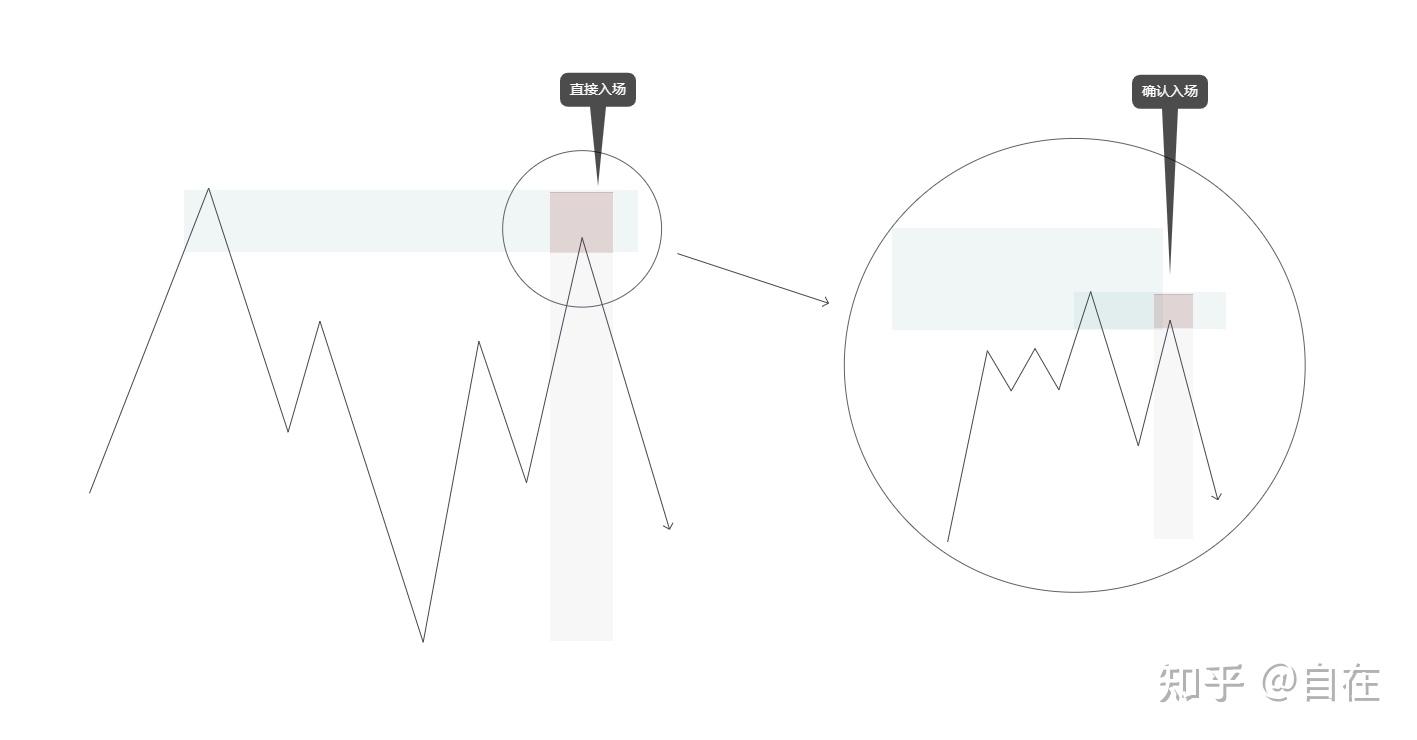
3. Entry
Direct entry:
Set a limit order at the order block marked on the HTF, using the two ends of the order block as the entry and stop loss.
The benefit of this is that it is easy and the entry probability is high.
The drawbacks are the poor risk/reward ratio, thin profits, and the risk of the price directly sweeping through the order block and then returning to the expected direction.
You can refine and optimize the order block on a smaller time frame to narrow its range.
Confirmed entry:
When the price enters the HTF order block area, switch to the LTF to observe the price movement, and wait for the momentum to complete the shift before using the LTF order block for entry.
The benefit is a higher probability and better risk/reward ratio.
The drawback is that you may miss the trading opportunity if there is a quick and strong reversal or if the price does not return to the LTF order block.
Hedge entry:
This is not about locking positions, which should always be avoided. Here, hedging is a way to reduce costs and risks, not a necessity.
When the price hits the opposite order block on the HTF, there may be a significant pullback. At this point, you have two choices: bear the floating loss or engage in hedging trading to turn the loss into profit.
4. Exit
Whenever the price returns near the structural point formed before the order block, it is the first take-profit level.
If the price cannot break through this structural point, it is best to move the stop loss to the breakeven point.
In addition, important liquidity pools are also ideal take-profit levels.
For the remaining positions, follow the stop loss.
As long as the profit-to-loss ratio is high enough, the exit can be flexible, and there may be new entry opportunities along the way (refuse to use the concept of adding positions).
Feedback and Q&A
- This strategy can be called order flow/institutional order flow, or Bayesian probability analysis of supply and demand causality. It is just a name, don't worry about it, and don't confuse it with order flow footprint software.
- If you want to trade seriously, it is best to do it on a computer. Never trade on a phone, especially on a small time frame! Because you cannot see the big picture, it is easy to make wrong decisions.
- Any strategy needs to be personally verified, don't ask me if it works, only the result of backtesting simulation can answer you.
Why do I still not know how to use it after reading the article?
Simply reading the text is not enough to understand the concepts. If you want to get started, you need to observe and verify the concepts I mentioned yourself.
If you find it difficult to understand, it may not be suitable for you, just like I cannot understand Wyckoff, price action, Ichimoku, quantitative analysis, and moving average strategies.
What I am sharing can only point out a direction among many possibilities, and there is no guarantee that it will be successful.
Many people work hard and try to be disciplined, but often fail to find a clear direction and are brainwashed by ineffective indicators and strategies, resulting in years of frustration.
This article is like a filter that opens up knowledge gaps in people's minds. Proactive people will actively seek answers, while passive people will give up if they do not understand.
I do not want to display any magical profits to stimulate people's greed and make sincere learners lose their minds. Moreover, the market does not need more profitable traders.
The basic section has been covered, and there is probably no advanced section (although an advanced content was posted, it is recommended to thoroughly understand the basic section before reading it). I hope you can supplement yourself through training and thinking.
References:
- All theoretical concepts are sourced from but not limited to ICT. ICT's theory is based on Larry Williams, Wyckoff, and ICT's founder Michael himself.
- [Disclaimer]: This article is only for technical exchange and does not include any substantive investment advice. The risk of using this strategy will be borne by the readers themselves.


