ICT Silver Bullet - The Indicator
This indicator will help you identify the key zones needed for The Silver Bullet Strategy, and not only this, starting version 2.2 you can use it on any timeframe to check the different graphical elements provided by the indicator to help you in your trading setup analysis.
The indicator will show you the following:
- Window: The three time-windows the ICT mentioned in the strategy
- Window 1: 3 AM and 4 AM New York time
- Window 2: 10 AM and 11 AM New York Time
- Window 3: 2 PM to 3 PM New York Time
- Fair Value Gap: Bullish and bearish FVG
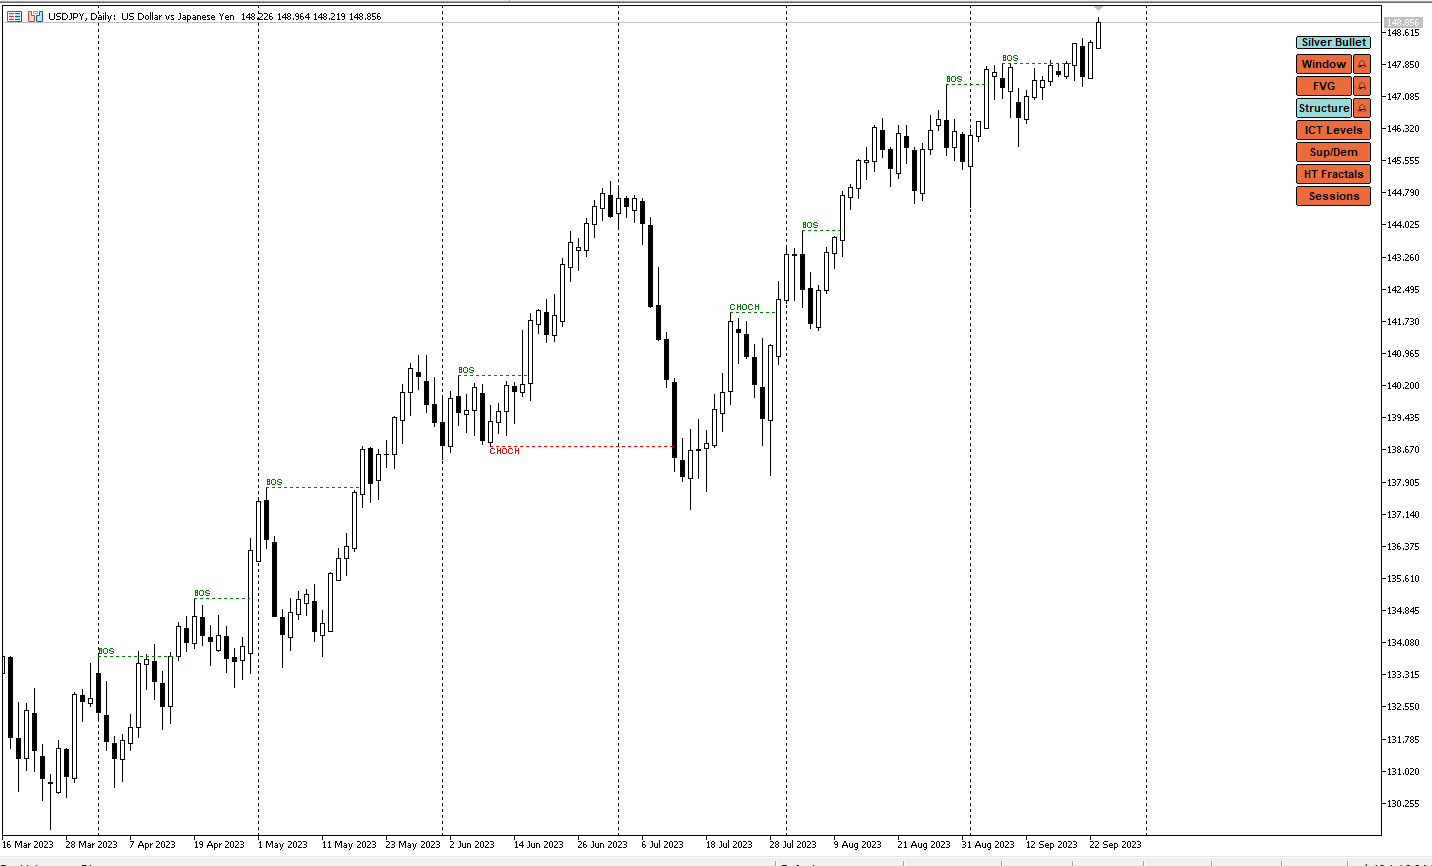
- Structure, presented by BOS (Break Of Structure) and CHOCH (Change of Characters)
- ICT Levels:
- The previous day's high and low, draw on liquidity
- The previous session's high and low, draw on liquidity
- The current week's NWOG (new week opening gap)
- The previous week's high and low, draw on liquidity
- Sup/Dem: Levels of potential buy side and sell side liquidity based on the chart timeframe
- HT Fractals: that stands for High Timeframe Fractals, basically it represents the structure of higher timeframe lows and highs.
- Market Sessions
The version 2 of the indicator will allow you also to plot all the FVG available in the the last defined number of candles beyond only the Silver Bullet Time Window. You can receive Alerts and Notifications for new FVG inside and outside the silver bullet windows.
Once Athe indicator is loaded for the first time make sure to activate the different levels needed directly from the panel. The indicator will only track any active silver bullet window, if any. The indicator will not post a buy or sell signal. It only helps you automate the levels you need to analyze and pull the trigger even to buy or sell.
Need help or have questions? I am Lio, don't hesitate to reach out! We are always available to respond, help, and improve.
Where to download the indicator
You can find the indicator under the following:
Strategy Summary As per Michael Huddleston
The strategy credit goes to Michael J. Huddleston, known as ICT, and the full strategy can be found on his youtube channel https://www.youtube.com/watch?v=tRq1hyGGtl4.
It is a time-boxed setup that frequently repeats on forex and indices. It trades on three-time windows: 3 AM to 4 AM, 10 AM to 11 AM, and 2 PM to 3 PM New York local time. To take an entry, a fair value gap needs to be identified inside the range, a market structure supporting the move down or up, and identifying at least a minimum trade framework of 10 points for indices and 15 pips for forex pairs. A much more robust framework is to combine this entry with a draw on liquidity draw identified on the current week's high and low, the previous day's high and low, and the current week's NWOG, the previous session's high and low. It is better to combine it with the Classic ICT optimal trade entry and the confluence with the 2022 ICT Mentorship Youtube Model.
I really recommend you to watch the videos on his official channel, you may find on youtube a thousand different version, but this indicator is as most as genuine to ICT original strategy.
You can also check my Youtube channel where I am posting my trades (winners and losers) using the Silver Bullet Indicator: https://www.youtube.com/@tradewithat
How to Use This Indicator
You need first to load this indicator on your charts, and update the settings as per the below explanation in the indicator inputs section. This indicator works best on 5 minutes time frame and less, as ICT Silver bullet is a scalping strategy. It updates the levels and information on each new candle. The indicator will take care of plotting the windows, levels, and FVG. If the alert and notifications are activated, the indicator will send you the alert or the notification of a possible setup. At this stage is up to you as a trader to study the current market conditions and to take the trade. This indicator will not give you a buy or sell signal.
Take your time to test the indicator on the strategy tester.
The Indicator General Settings
- Indicator Comment:
This comment will be included in the alert sent by the indicator
- Magic Number:
This magic number should be unique for each chart, it will allow the indicator to track which graphics are active and which are not for a specific chart. Using one magic number can mess up your configuration.
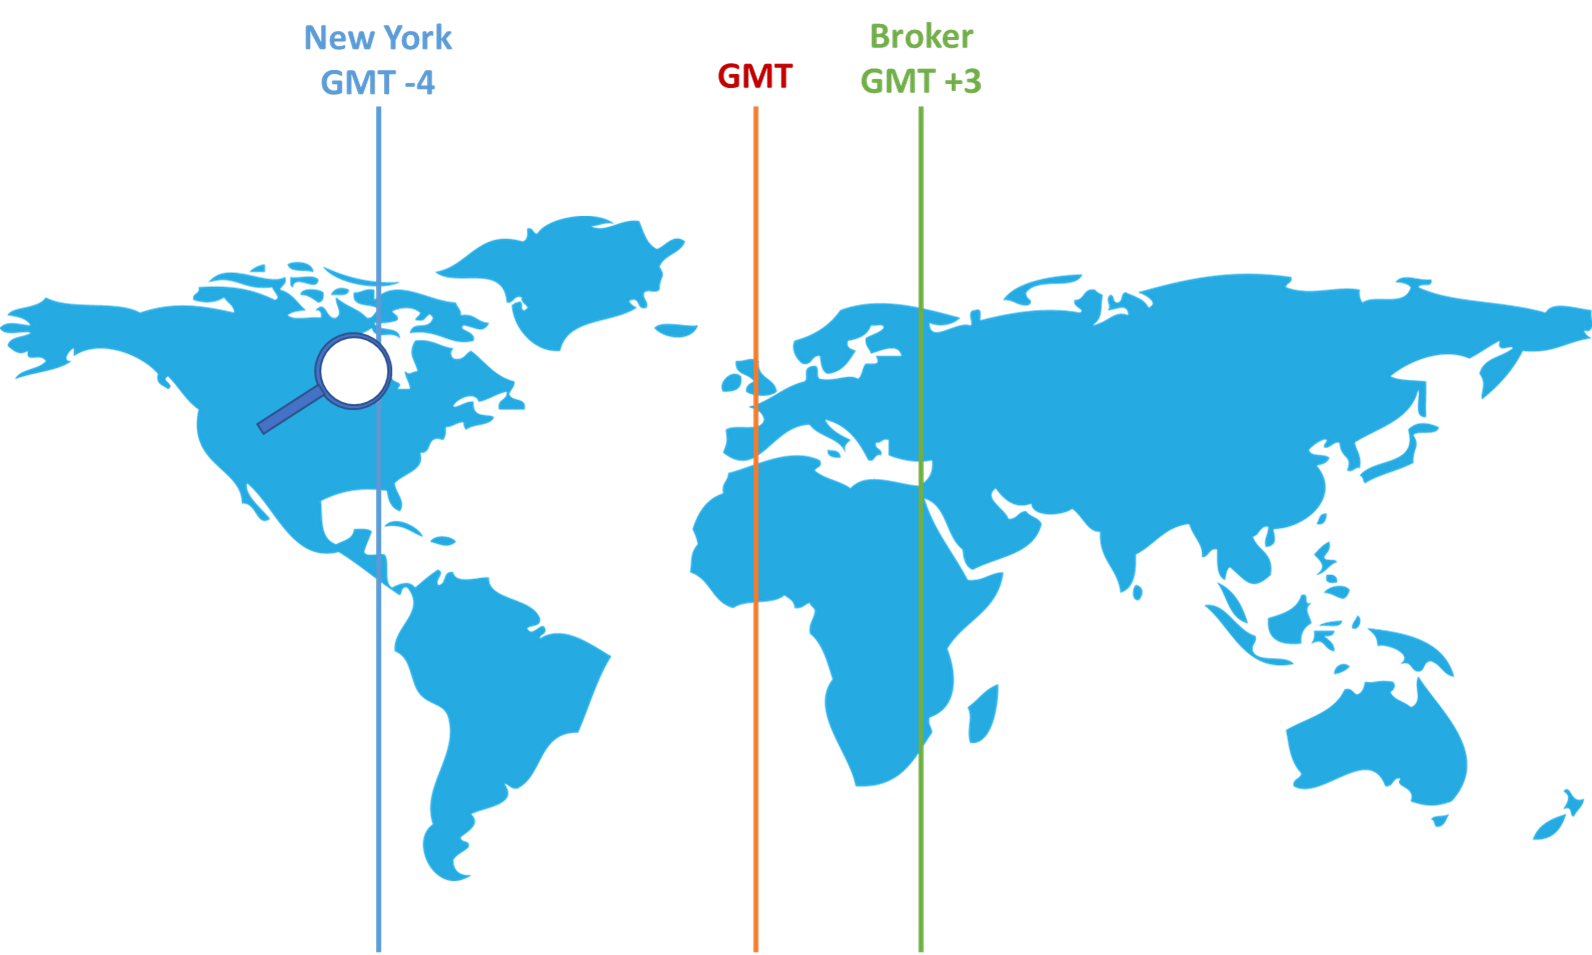
- Current Broker GMT Shift:
Broker time from GMT - Current NY to GMT Shift:
Current New York time from GMT, it can be -4 or -5 it depends on daylight saving. - Number Of Loopback Candles:
This is the number of candles that the indicator will consider to plot the different graphical elements such as FVG, Structure, ...
Let us take an example of the first window mentioned by ICT which is from 3AM to 4AM New York Time. If my broker is hosted in Europe as example, most probably the broker time will GMT+3, and New York (during light saving is -4GMT). this mean the first window will take place on my broker time between 10 and 11 AM.
- 10 AM = 3AM + 4 hours to get to GMT + 3 hours to get to my broker time.
- 11 AM = 4AM + 4 hours to get to GMT + 3 hours to get to my broker time.
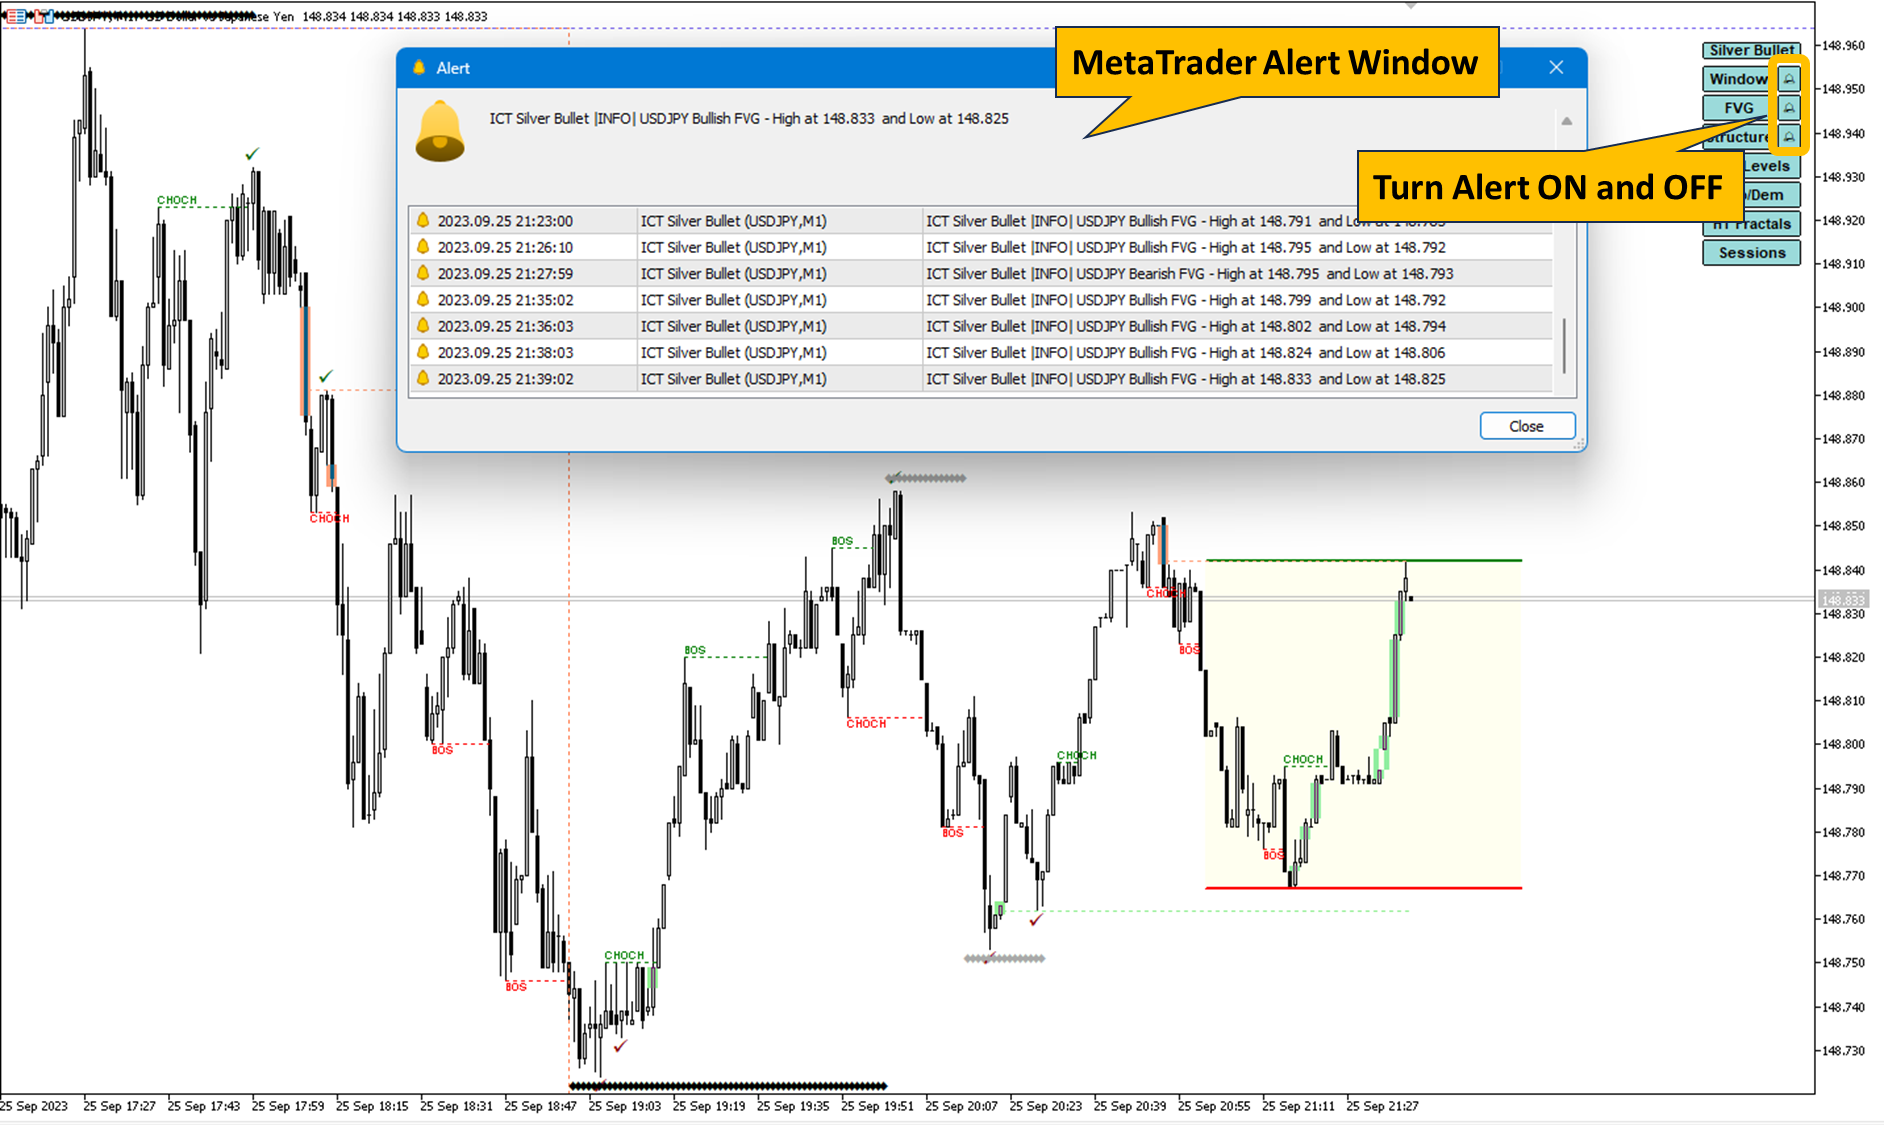
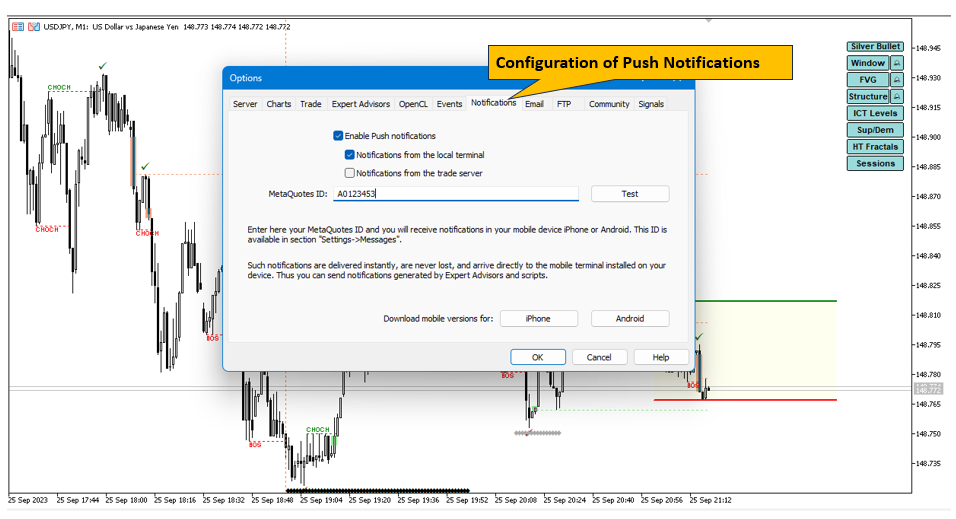
- Notification via Alert:
if set to true you can potentially configure to receive alert via native Metatrader alert window - Notification via Push Message:
if set to true and with the right configuration of the notification you can receive push notifications to your mobile - Alerts limited Inside Window:
You can limit the alerts only to Silver Bullet Window, but only extend those outside
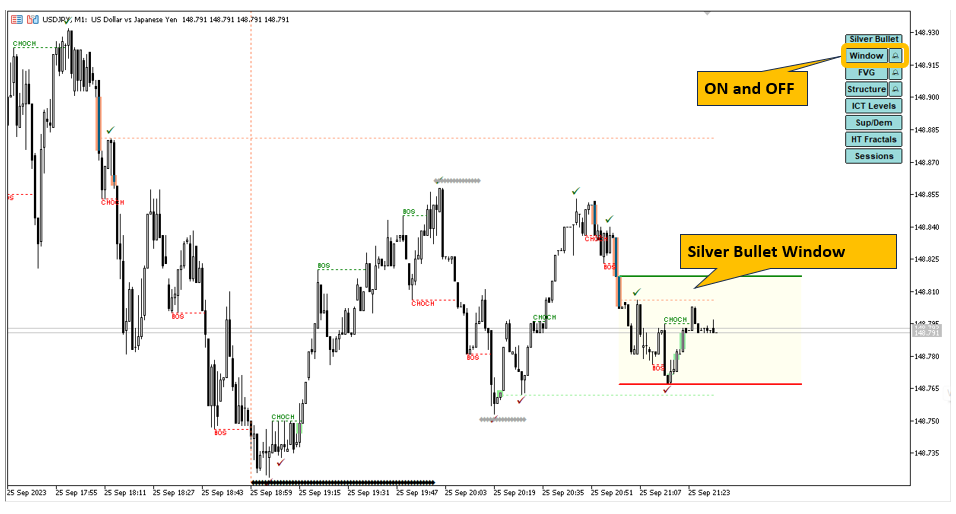
HOW ALERTS WORKS:
To be able to turn ON and OFF the alerts at least the Notification via alert or Notification via push message should be true, otherwise an alert will pop up to ask you activating one of those. The alert for each elements will be automatically switched OFF if the elements is switched OFF. The indicator will remember your last choice when switching back ON the elements.
By limiting the alerts to the silver bullet window, only alerts during this specific time are issued. In this case in case Window button is turned off all alerts are turned off too.
Silver Bullet Window Settings
- Silver Bullet Time Window Color
- Fill or not the silver bullet range
- Windows Settings: The default settings are in New York local time.
- Window 1: Start Hours (0-23), Start Minutes (0-59), End Hours (0-23), End Minutes (0-59)
- Window 2: Start Hours (0-23), Start Minutes (0-59), End Hours (0-23), End Minutes (0-59)
- Window 3: Start Hours (0-23), Start Minutes (0-59), End Hours (0-23), End Minutes (0-59)
FVG: Fair Value Gap
- Minimum FVG height:
Sometimes, a 1 or 2 pips fair value gap is insignificant. You can decide on its height based on the pair your are trading - Bullish FVG color:
Color used for bullish FVG - Bearish FVG color:
Color used for bearish FVG - Option to plot FVG:
You can choose to see all FVG, only the unfilled one, or the partially filled.
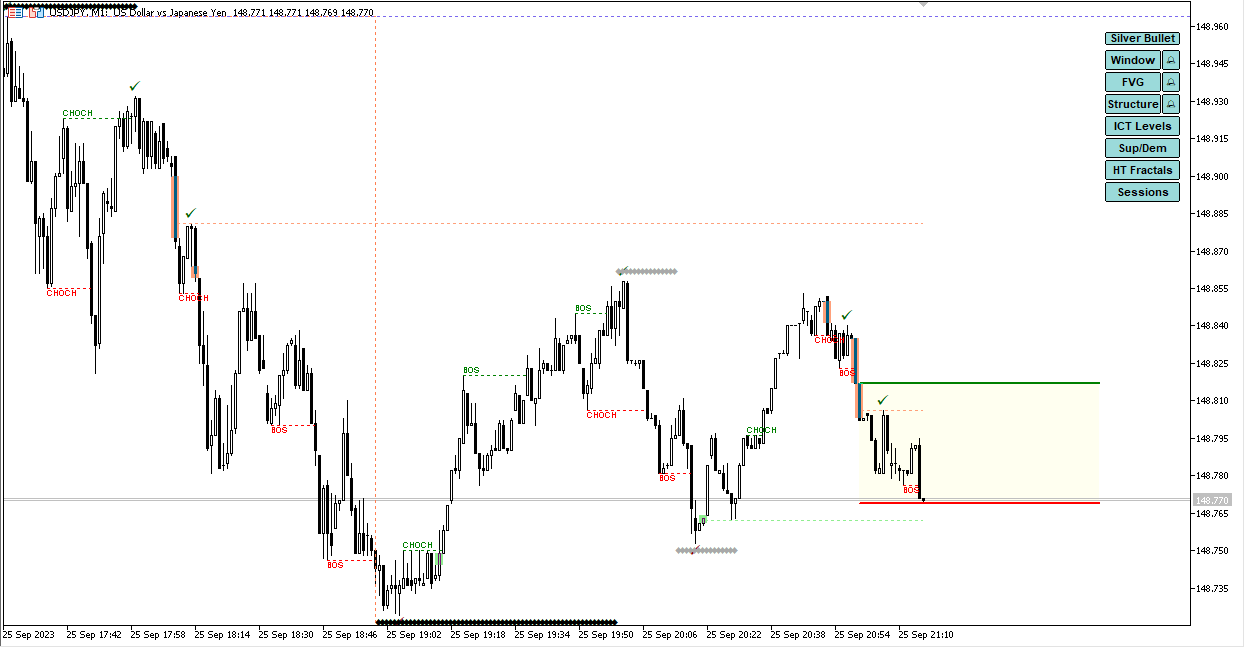
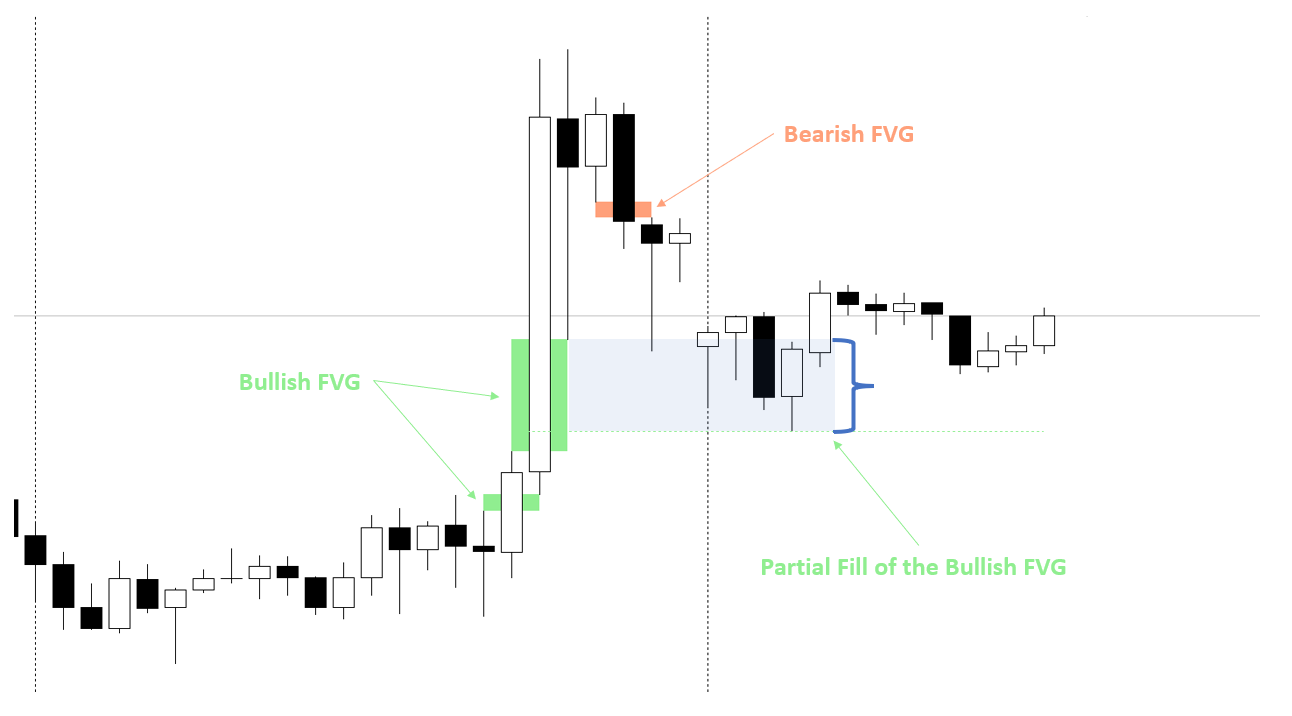
FVG stands for "Fair Value Gap". As per ICT it is a price imbalance. For example for a bullish FVG on candle X, is the difference in Price between the high of candle X-1 and the low of the candle X+1. So in the screen below the first and second green rectangle represent a Bullish FVG. The bearish FVG is the opposite and you can notice it as the orange rectangle below. The indicator will highlight new bullish FVG or bearish FVG appears on the screen for the last 200 candles if you use the default settings. However, when you you are using this indicator, you will also notice if you activate partial fill line option, a line will appear, as for example the second Bullish FVG below. This happens when a FVG is identified at candle X+1, and afterward the price revisit the FVG and may partially or totally fill it. This will help you visually to identify that the FVG is revisited and it may be the time to trigger your trade.
ICT Level Settings
- Ray levels on Chart: If true the levels will be plotted on all the charts, however when it is false the levels will only be shown on the right of the current chart.
- Previous Day high and low color
- Previous Week high and low color
- Number of past NWOG - up to three
- Current NWOG color
- New York Open Price
- Long or Short Label format
- Level line style
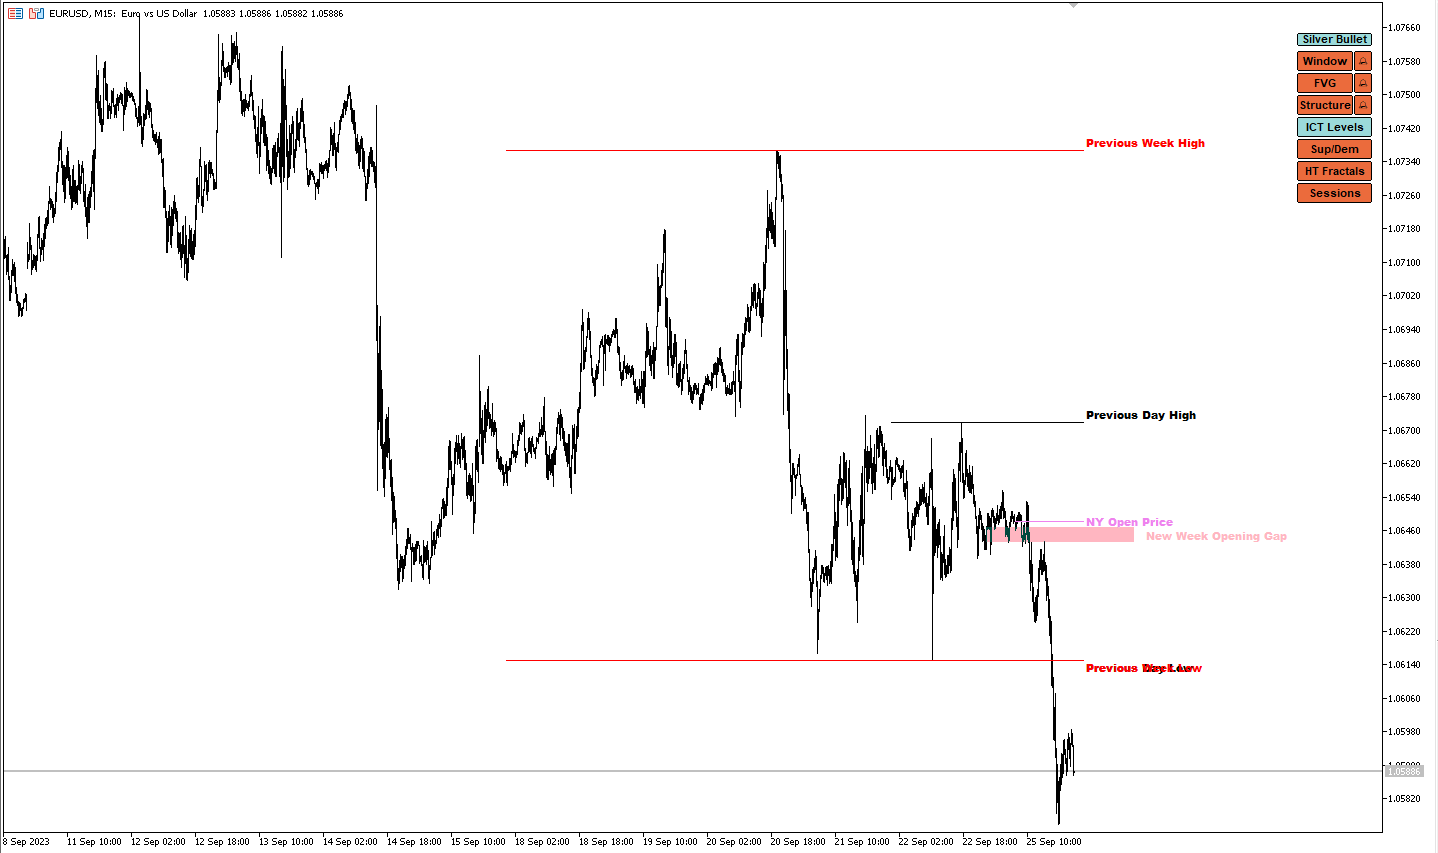
The levels are what ICT mentions as potential draw on liquidity and motivation to make price move toward them or from those level out. Below are the short label version.
- PWH --> previous weekly high
- PWL --> previous weekly low
- PDH --> previous day high
- PDL --> previous day low
- NWOG --> New Week Opening Gap
- NYOP --> New York Open Time
Structure Settings
- Zigzag depth: the depth used for ZigZag to determine the high and lows
- Bullish BOS/CHOCH color
- Bearish BOS/CHOCH color
- Structure line style
Market Structure is the most essential part to know the trend. Combining it with the other elements of this indicator makes your analysis more precise.
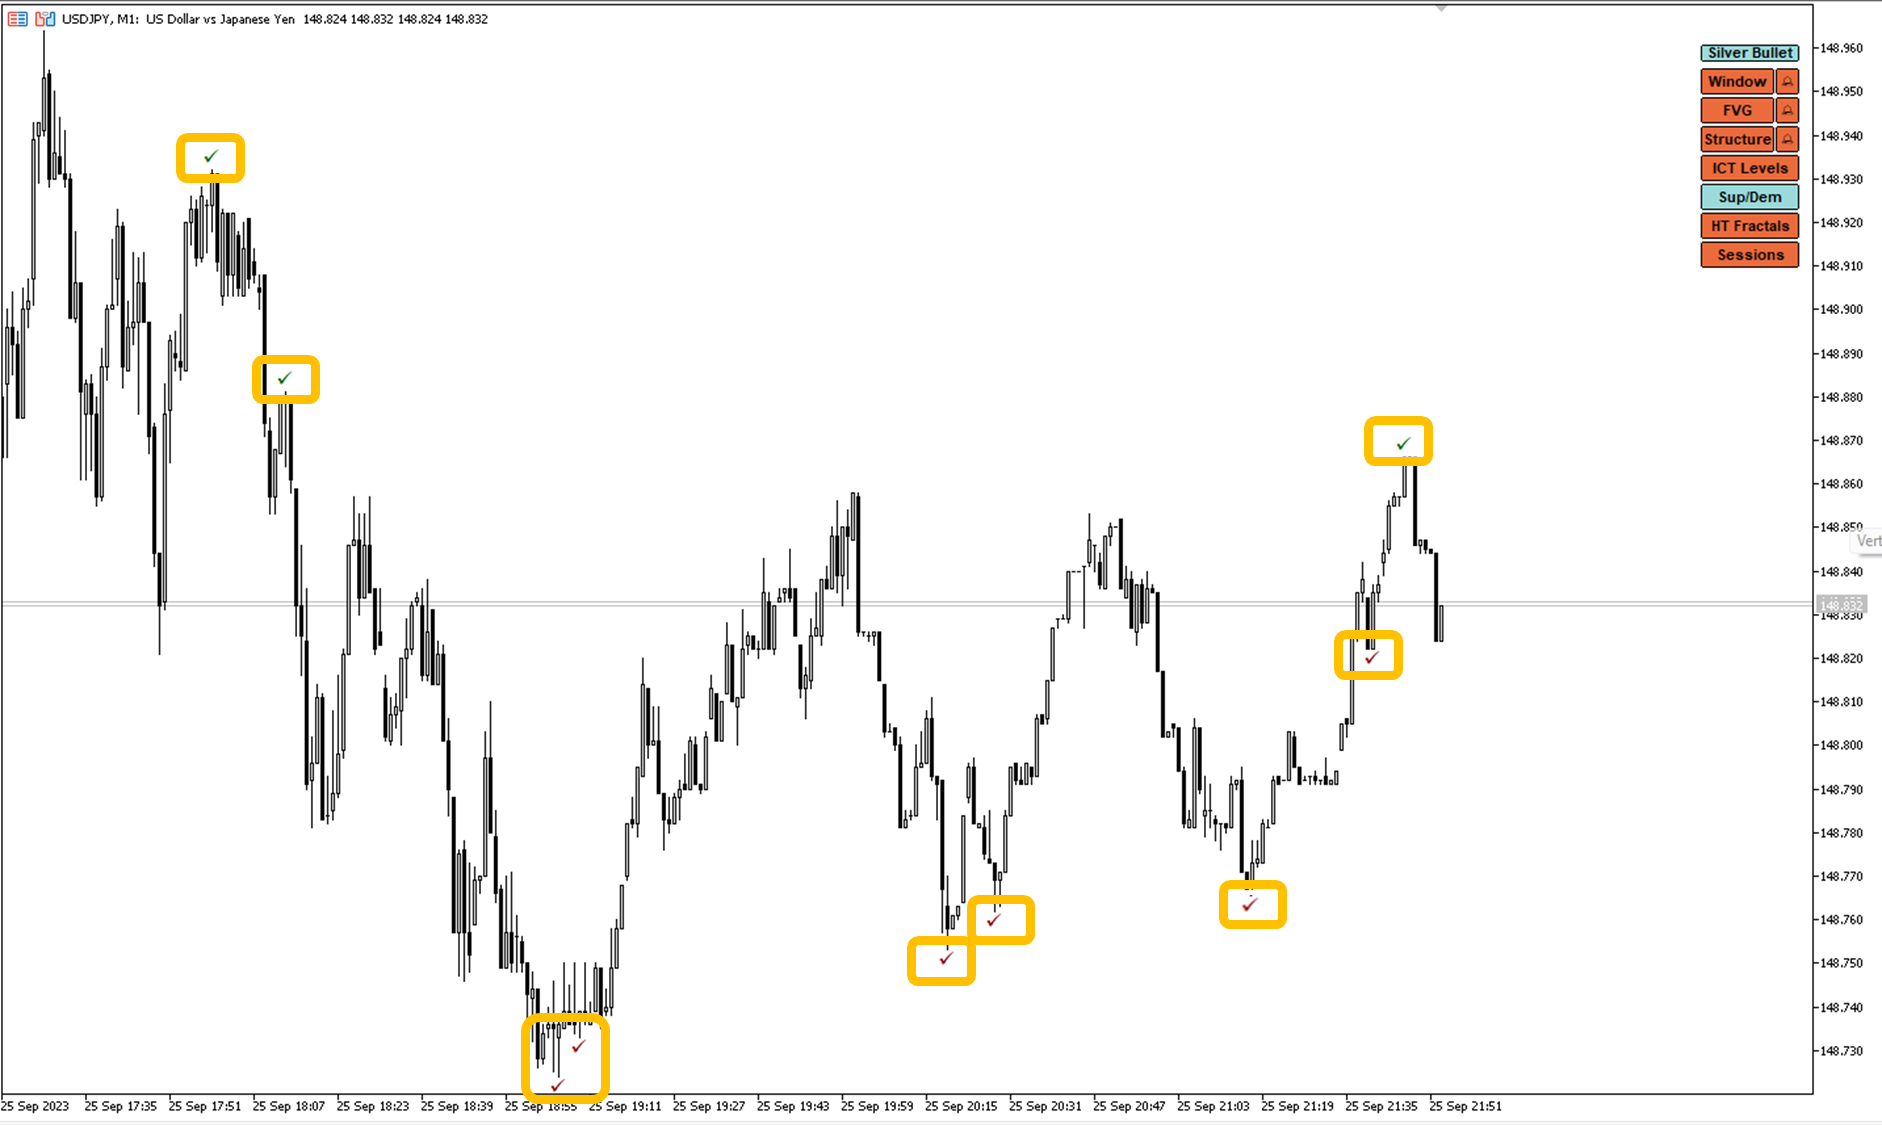
Supply and Demand
- Choose if the Sup/Dem are plotted as check marks or lines
- Line style if line is chosen
- Supply Color
- Demand Color
The Supply and demand are potential areas on the same timeframe as the chart where you may have liquidity pools on the sell side and buy side. Those zones are identified from market structure in addition to potential market range.
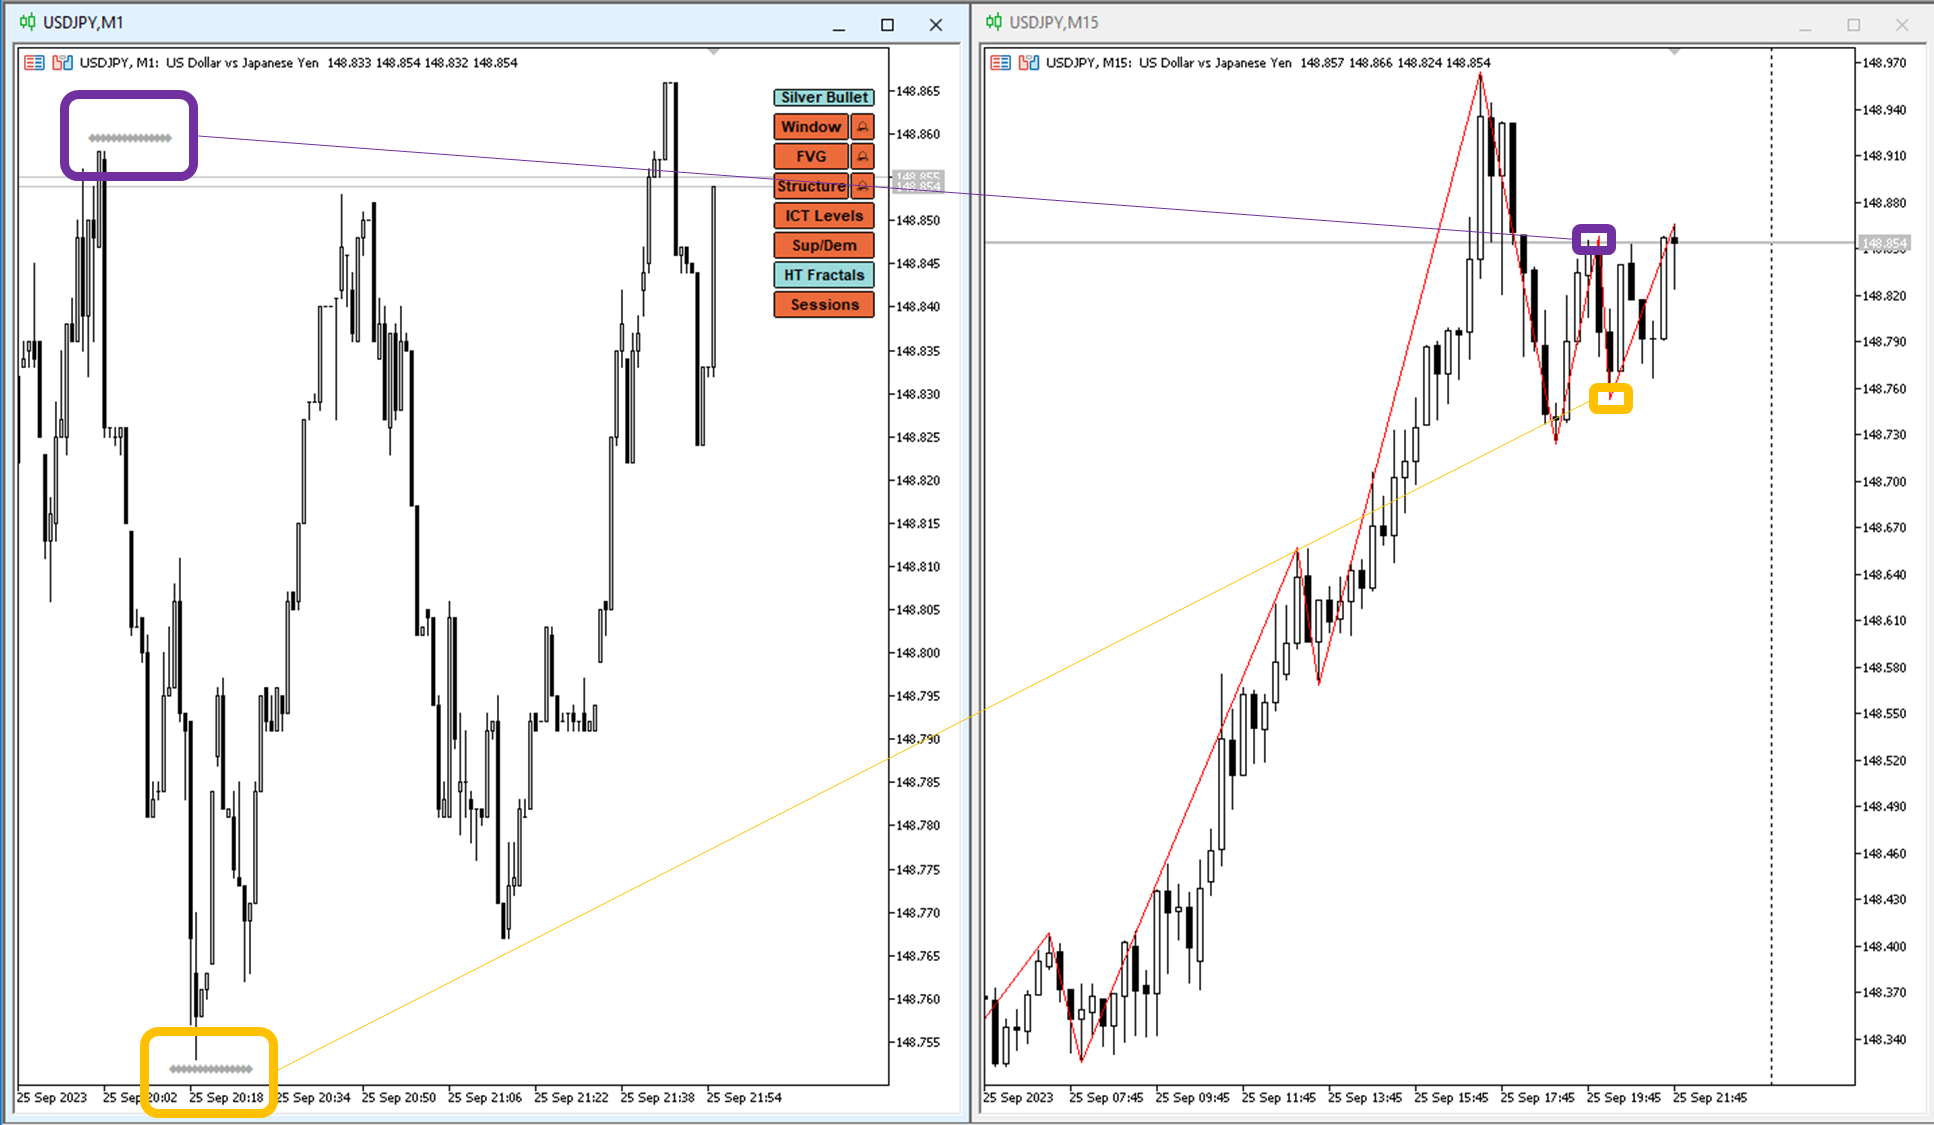
HT Fractals
Higher Timeframe fractal will allow you to see on low time frame the High and low of higher timeframes. Example when you are on a 5 minutes charts and you want to check the 15 minutes and 1 hour timeframes high and low. The representation is done with multiple dots that are the mutiple of the current timeframe with the higher timeframe you are comparing to. Example a 15 min timeframe fractal will appear as 15 dots on a one minute fractal.
Two timeframes can be configured with different colors.
Pay attention that this option will only be calculated on new candle to help optimize the performance or on need by turning it OFF then ON.
In the picture below we can see how high and lows on 15 minutes are show on 1 minute timeframe under the HT fractal feature.

Sessions Settings
- Session Representation: You can simple plot the high and low, or as empty rectangle of filled one
- Asia Session color
- London Session color
- New York Session color
- Manual Adjustment for Asia, London and New York session (if needed)

Control Panel Settings
- Position of the control Panel: Top left, Top right, Bottom Left, or Bottom Right
- Vertical shift from the chart border
- Horizontal shift from the the chart border