SMC TRADING PART 5 - Supply and demand trading strategy based on structure

II. Fundamental Knowledge
- Structural foundation:
- Estimating direction based on structure
- No matter how varied the form, structure breaks it all
- The role of structure in trading
- Supply and demand foundation:
- Supply and demand trading strategy based on structure
Supply and demand trading strategy based on structure
Directional expectations from structural breakthroughs
Price trends are driven by the push of funds and profit-taking behavior, with pushing behavior forming the main uptrend and profit-taking behavior forming adjustments. A series of continuous pushes and profits, in retrospect, are trends.
Going with the trend means breaking through the high/low point structure of prices and forming higher highs/lower lows; reversal means breaking through the high/low point structure of prices and forming lower highs/higher lows.
For example, in an uptrend, the high points tend to be continuously broken, and the low points also continuously rise; when the trend reverses downwards, the low points will be continuously broken, and the high points will also continuously decline.
Structural breakthroughs on a larger time frame will bring directional expectations. This direction does not have certainty, only a slightly higher probability advantage. Skilled traders can combine multiple methods to enhance probability, but it can never reach 100%.
The significance of supply and demand relationships
Supply and demand relationships are the first of Wyckoff's three laws and are closely related to fund behavior. From a macro perspective, supply and demand relationships determine the direction of market price changes; from a micro perspective, supply and demand relationships also determine the entry and exit positions of traders.
When supply and demand are balanced, the market is in a consolidation phase; when supply and demand are imbalanced, the market moves in a directional manner.- If supply is greater than demand, the market price will fall.
- If demand is greater than supply, the market price will rise.
Following the trend or following big money?
What makes the price candlestick move up and down? Is it the collective efforts of countless individual traders?
The larger the market volume, the more capital is needed to move prices. For example, in the forex market, only large financial institutions such as banks, investment banks, and funds can significantly change prices, and they play a decisive role in the market trend.
Unlike individual traders, financial institutions trade with huge amounts of capital and often face the problem of insufficient liquidity[1]. Even if large orders are split into smaller ones, they will still cause significant changes in the market price.
For example, if an institution wants to complete one buy order, there must be an equivalent amount of sell orders in the market. If there are not enough sell orders at the current price, demand will far exceed supply, and the price will rise to match the sell orders until they are completely filled. This is reflected in the chart as a sudden appearance of a large bullish candlestick (or a series of bullish candlesticks).
It is impossible for the remaining orders split by institutions to continue to be completed through pending orders. In addition, based on cost considerations, if the current price is far from the accumulation zone, institutions will manipulate prices to return to the vicinity of the accumulation zone by closing profitable positions. If the accumulation zone of the institution can be identified in advance, this is an excellent trading opportunity.
The supply and demand trading method is a method of identifying the intentions of major funds, and following the footsteps of big money may be more reliable than following the trend.
How to Identify Institution Accumulation Zones
After big money enters the market, there will be a clear characteristic, which appears as a large bullish or bearish candlestick on the chart, or a series of bullish or bearish candlesticks. If viewed through order flow software or volume distribution charts, you will find that within the range of these candlesticks, there are almost only buy orders or sell orders.
These strongly imbalanced candlesticks are somewhat similar to gap openings. Because they are caused by insufficient liquidity, these large candlesticks can also be called liquidity gaps.
Except for market fluctuations caused by news, any large candlestick has the potential to be a trace left by institutional accumulation. Because institutions are not a union and still eat smaller fish, institutions in the Asian, European, and American sessions also attack each other, especially during the European and American sessions, which often lead to reversals. Only under the condition of unified fundamentals, can smooth trend movements occur simultaneously in the Asian, European, and American sessions.
One of the methods to determine whether it is institutional accumulation is to confirm the behavior of institutional accumulation if the price returns to the vicinity of the starting point of the large candlestick shortly after.
However, it is important to note that not all large candlesticks in any position can be used. A limiting condition must be added, which is to break through the high/low points of the structure or range. When a large candlestick that may be an institutional accumulation zone appears, it is necessary to see if the price can break through the previous structure or range next. If it cannot break through, it means that the effort has no result, and there is likely a divergence of volume and price.
If a large candlestick appears and breaks through the previous structure's high/low point, then we can expect this institutional accumulation zone to be effective and place a limit order here.
Structural Types of Institutional Accumulation Zones
The name "institutional accumulation zone" is a bit long, and if you already understand its meaning, you can also call it a supply-demand zone or decision zone. The term "decision zone" is based on the breakout pullback system and "supply-demand zone" seems more appropriate in this article. Supply-demand zones can be divided into two categories based on their structure: reversal and continuation[2].
Reversal structures:
- RBD - Rally-Base-Drop (from uptrend to downtrend)
- DBR - Drop-Base-Rally (from downtrend to uptrend)
Continuation structures:
- DBD - Drop-Base-Drop (downtrend continuation)
- RBR - Rally-Base-Rally (uptrend continuation)
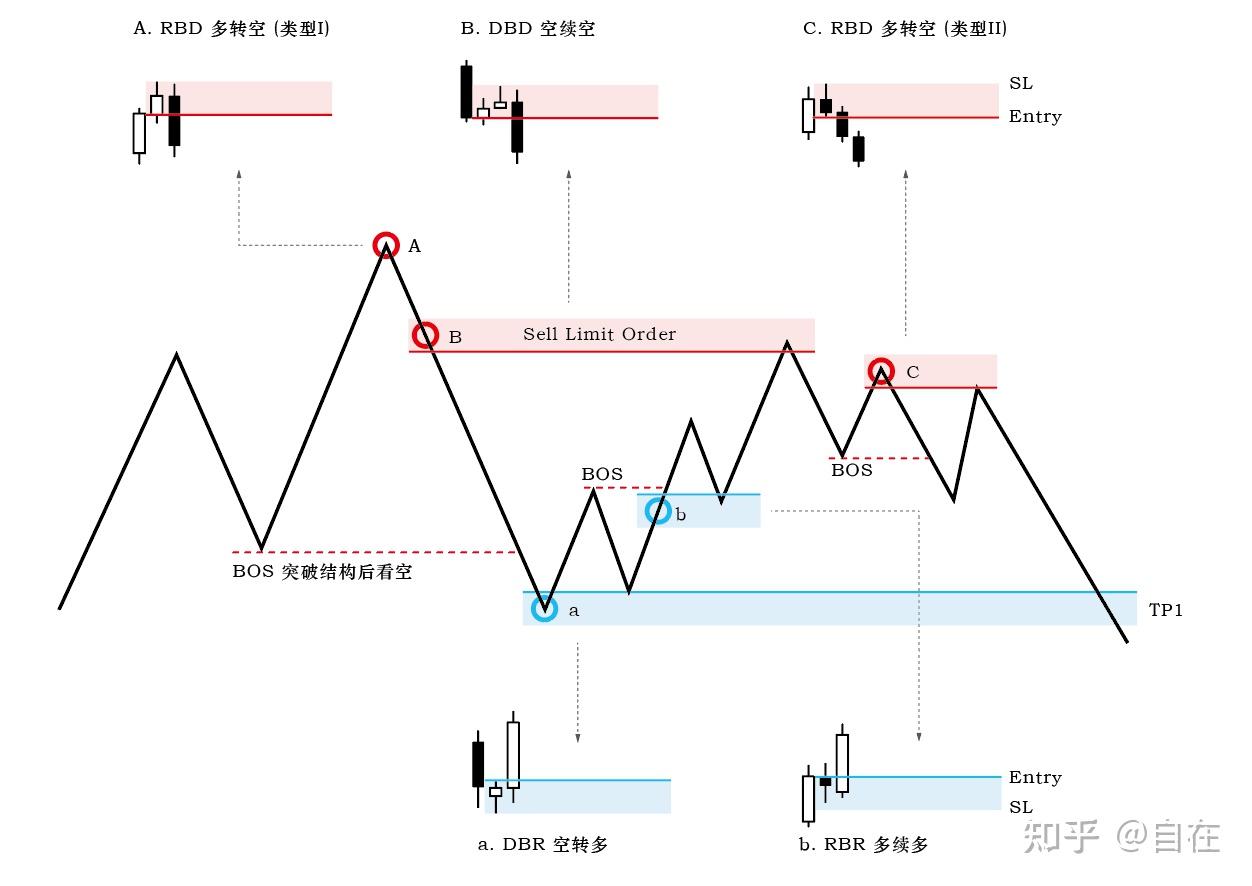
Structure-based Supply-Demand Trading Model
• The red block in the figure is the stop loss range for the short limit order, and the red line is the entry point for the short position; the blue block is the stop loss range for the long limit order, and the blue line is the entry point for the long position.
• Point a is the first target of the limit short order at point B, where some profits will be locked by reducing the position, and point C is the second entry point for the short position.
• Point b is the entry point for the contrarian long position, which will be fully closed at point B (also the area for short selling, but not a market order, but a pre-set limit short order).
Two Momentum Types in Supply-Demand Zones
In the supply-demand trading model, both points A and C are reversal structures, but the momentum of institutional accumulation is different.- Engulfing Pattern: Common supply-demand zones belong to engulfing candlestick combinations, and the stronger the momentum, the longer the body of the engulfing candlestick.
- Multi-Candlestick Reversal Pattern: This type of supply-demand zone has slightly weaker momentum than the first type. Typically, the first reversal candlestick is a piercing pattern, and two or more consecutive candlesticks are needed to break through the low point of the base candlestick (RBD) or the high point of the base candlestick (DBR).
Microscopic View of Supply-Demand Zones
Looking at the four structures of the supply-demand zone, you will find small candlesticks in between. If we switch to a smaller time frame, what do these small candlesticks look like? Do they become a consolidation range? So, the large candlesticks formed by institutional accumulation, are they a strong breakout from the consolidation range?
As mentioned earlier, consolidation represents supply-demand balance, and breakout represents supply-demand imbalance. We must consider the supply-demand zone as an entry and exit basis, expecting a quick reversal when the price returns here. However, the imbalance of large candlesticks is often filled by counter orders, making it difficult to reverse.
Therefore, the supply-demand zone should include a consolidation range of a balanced state. It is not only the starting point of institutional accumulation, but also provides liquidity for a large number of unfilled orders (value investors tend to sell in the premium zone and buy in the discount zone).
Candlesticks can be mainly divided into two types: range candlesticks and momentum candlesticks:- Range candlesticks: They can be divided into two types according to the proportion of the body and the position of the closing price, namely those with upper and lower shadows exceeding 50% and those closing within the range of the previous candlestick. Even if the candlestick is mainly composed of a body, it still belongs to the range candlestick type in the latter case.
- Momentum candlesticks: They mainly refer to candlesticks with a body portion exceeding 50%. Strictly speaking, they should have very few shadows because the body of the momentum candlestick represents strong supply-demand imbalance, while the shadow indicates the existence of reverse supply-demand forces, which is a more balanced state.
Oh, I almost forgot to mention that it is not necessary to calculate the ratio of the body to the shadow based on the OHLC values of the candlestick. Just look at which one is bigger at a glance, and if you can't tell, treat it as a range candlestick. Trading is not an exact science, so if you're not using an EA, don't pursue accuracy too much and don't waste your energy on these things.
How to determine the stop-loss range
Usually, we use the Base area that represents supply and demand balance among the four supply and demand structures as the stop-loss range (the spread should be added in actual trading). There are roughly three ways to determine the stop-loss range based on entry probability and risk-reward ratio:- High probability: Use the high and low points of the Base area's interval candlestick as the entry and stop-loss points. For example, in a strong upward momentum market, when the price pulls back, it will immediately reverse when it touches the high point of the interval candlestick. The disadvantage of using the high and low points of the interval candlestick is that sometimes the shadow range is too large, resulting in a poor risk-reward ratio.
- Balance: Use the opening price of the interval candlestick near the entry point and the high/low point of the shadow at a distance as the stop-loss point. It combines probability and risk-reward ratio and is suitable for regular use.
- High risk-reward ratio: Use the 50% point of the interval candlestick or the closing price as the entry point and the high/low point of the shadow at a distance as the stop-loss point. This entry method has a relatively good risk-reward ratio but can significantly reduce entry probability, and it is usually used when the shadow range is long.
Note: Choose one of the three methods, and do not change it according to subjective preferences, as this will only lose consistency and not be worth the effort.
For the Base area with multiple interval candlesticks, these candlesticks can be considered as a consolidation zone.- For the RBD (rally-base-drop) and DBD (drop-base-drop) structures: Use the opening price of the lowest interval candlestick as the entry point and the high point of the shadow of the highest interval candlestick as the stop-loss point.
- For the DBR (drop-base-rally) and RBR (rally-base-rally) structures: Use the opening price of the highest interval candlestick as the entry point and the low point of the shadow of the lowest interval candlestick as the stop-loss point.
Finally, for the multiple candlestick reversal structure, choose one of the three stop-loss methods based on the piercing candlestick.
How to Judge the Quality of Supply and Demand Zones
Good supply and demand zones have two basic characteristics, which are clean and fresh. Clean means that the imbalance is strong, while fresh indicates that the liquidity gap left behind after the price imbalance has not been filled, and the price is likely to come back to test this zone.
The area that has been tested is no longer fresh, or has become a relatively stable area, and is no longer in an imbalanced state. This process of balancing after an imbalance is the supply and demand reaction.
Trainer Sam Seiden also mentioned that the quality of supply and demand zones can be judged based on the stagnation time and the risk-reward ratio. However, this is not a necessary condition, especially the idea of stagnation time, which can be ignored. In actual trading, only the momentum and freshness of the supply and demand zones need to be considered.
Momentum Strength:
The candlestick leaving the supply and demand zone must have strong and smooth momentum. It can be in the form of a gap, momentum candlestick, or a series of candlestick. If it is leaving the supply and demand zone with overlapping candlestick, it indicates no imbalance and it is difficult for the price to return to this area.
We hope that the price has strong momentum when leaving the supply and demand zone, but when it returns to the zone, if the momentum is still strong, then we need to be careful that the supply and demand zone has been broken through.
Therefore, when the price returns in the form of a V-shaped reversal, the best approach is to abandon this supply and demand zone.
The momentum of the price returning to the supply and demand zone should be the opposite of that when leaving, and it needs to return in a smooth, step-by-step or small wave-like manner.
MACD can be used as an indicator of momentum strength for judging supply and demand zones.
Freshness:
Unlike support and resistance, supply and demand has a time-sensitive and usage-based nature.
This is because every time the price touches a supply and demand zone, there is an order matching process that simultaneously consumes market orders and pending orders in that area.
Therefore, we mainly focus on the nearest and untouched supply and demand zones relative to the current price.
If a supply and demand zone has been tested once, when it is retested for the second time, one should ensure that their position is in a zero-risk state. As for the third time...if the price can still retest the zone for a third time, then it is best to abandon that supply and demand zone and wait for a new opportunity.
An effective supply and demand zone also has a requirement for the timeliness of price returning to it.
For example, for a trading cycle of less than 15 minutes, the price should return to the supply and demand zone within about 24 hours; for a trading cycle of 30 minutes to 4 hours, the price should retest the zone within 20 days; for a daily trading cycle, the price should return to the zone within 3 months.
A long-untested supply and demand zone is no longer fresh in terms of timeliness, so it is best not to use it directly.
Strategy review:
- Choose the direction based on the structure
- Find the starting point of price imbalance by selecting the breakout structure of the supply and demand zone
- Choose a suitable supply and demand zone drawing method as the entry and stop loss zone
- Determine the quality of the supply and demand zone and decide whether to hang a limit order and wait for entry
Practice question:
Practice finding supply and demand zones in different timeframes and different instruments. Observe successful and unsuccessful cases, and analyze the patterns after finding several hundred of them.Reference:
- ^When someone sells to you when you want to buy, and someone buys from you when you want to sell, it means there is sufficient liquidity. Conversely, when there is insufficient liquidity. Typically, liquidity is good during consolidation, while it is lower during trends.
- ^It can also be translated as "Rally-Base-Drop/Drop-Base-Rally/Rally-Base-Rally/Drop-Base-Drop", but the base may not always move flat. Sometimes the pullback may be deep, and sometimes it may reverse directly. Therefore, understanding the base as "flat" can mislead beginners.


