SMC Trading Part 1 - Common Abbreviations for SMC Concept & Multi-Time Frame Replay

1. Preface
My article is more suitable for experienced traders to read, as it mainly covers the basic principles of the market, without much advanced content or trading details. This is because I hope that learners have independent learning spirit, and can absorb the knowledge I provide into their own system, actively explore the underlying core of trading and train their own thinking and observation abilities.
Please do not ask me for apprenticeship training. In my view, as long as you understand the principles, anyone can become their own teacher.
Just like the premium-discount concept, the actual PD zone is not divided by the upper and lower 50% of the wave, it actually has a more specific position. But does this mean that the ICT theory is not good? No! Any knowledge has a process of progression from basic to advanced. In the introductory stage, compared with the profound formula like E=mc2, a crude mechanical explanation is like a metaphor, which is easier for us to understand. If the learner stops at the primary stage and overinterprets, they will fall into a trap full of errors.
Traders engaged in venture capital work must have critical thinking skills. Do not treat any theory as truth, because there is no mathematical theory that is perfect. All theories are like Plato's cave, no matter how close to the essence and truth of the market, they are derived from limited observations and logical deductions, and cannot fully represent reality. Don't stop at the theory itself, because due to the relationship of dissemination and interest, the theories that have been published can only be primary or intermediate theories.
When you reach this point, please don't be angry or discouraged. Without the red pill, the savior cannot wake up from the matrix. Without the basic theory, it is difficult for us to get out of the dead end. If the basic principles of the market are compared to eggs, we can eat them directly to satisfy hunger, or hatch them into chicks, and then the chicks will lay endless eggs. It may be more difficult to hatch eggs, but it is easier than laying eggs out of thin air. I am glad and grateful that I received an egg and successfully hatched a chicken that can lay golden eggs.
The little golden chicken comes from an egg, but it is completely different from the egg - this is what I really hope you can get.
2. Learning Toolbox
- Common Abbreviations for SMC Concept
| Abbreviation Used | Full Name or Alias (there may be many aliases for the same concept) |
| M | Monthly |
| W | Weekly |
| D | Daily |
| HTF | Higher Time Frame |
| LTF | Lower Time Frame |
| IMB | Imbalance (FVG, LV, LG) |
| SH | Stop Hunt |
| SSL | Sell Side Liquidity |
| BSL | Buy Side Liquidity |
| BOS | Break of Structure (BMS) |
| MS | Momentum Shift (CHoCH, Change of Character) |
| H | High (Monthly/Weekly/Daily High: MH/WH/DH) |
| L | Low (Monthly/Weekly/Daily Low: ML/WL/DL) |
| $ | Liquidity, Liquidity Pool, EQH/EQL |
| OB | Order Block (POI/POA/Supply and Demand Zone) |
| P/D | Premium/Discount |
| SMC | Smart Money Concept |
| EQH/EQL | Equal High/Equal Low |
| 4H/1H/15m | 4 hours/1 hour/15 minutes |
| EX$ | External Liquidity |
| IN$ | Internal Liquidity |
| LI$ | Liquidity Inducement |
| HH, LL | Higher High, Lower Low |
| HL, LH | Higher Low, Lower High |
| S2B | Sell to Buy |
| B2S | Buy to Sell |
- Easy Tutorial for Multi-Time Frame Replay
Replaying the market is a part of chart reading training. Without professional replaying tools, most charting software can only replay a single timeframe.
If conditions allow, you can invest in professional replaying software such as Replay Master or open a premium account on TradingView to perform market replays.
In this article, I will share my simple method on how to use a small software with MT4/MT5 to achieve a better experience of multi-timeframe market replay (friendly for lazy people like me).
Setting up Cover:
First, search and download "Cover", a subtitle masking software that is small and lightweight and does not require installation.
We will use Cover to mask the right side of the MT4/MT5 chart window to enable annotations on the chart (annotations can still be made without Cover, but they may be blocked by the chart edge when annotating the latest candlestick).
Next, let's set up Cover:
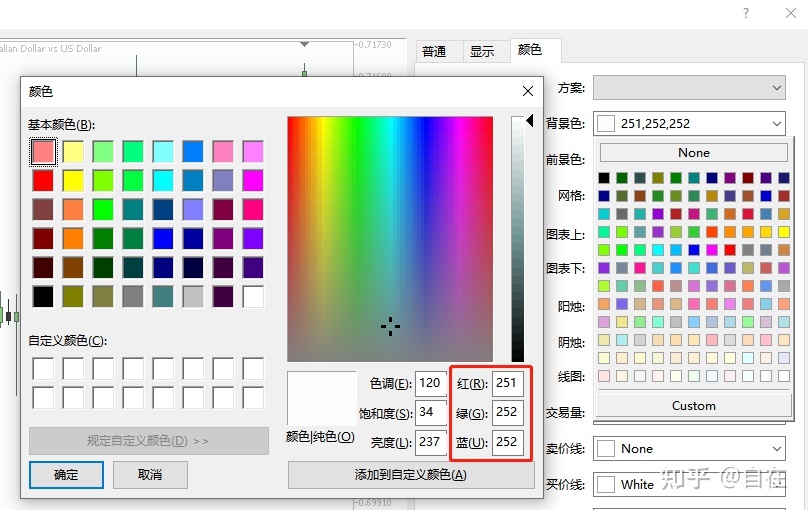
First, adjust Cover's color to match your MT5 background color. If you don't know the color value, you can press F8 or right-click on the trading chart and select Properties -> Colors -> Background color, then open the dropdown menu and select Custom. Fill the color value inside the red box in the figure below into Cover's color setting (also by right-clicking on Cover).
Adjust the size of Cover by dragging it to the approximate position shown below. Then, right-click on Cover and leave only the Top most option checked, uncheck all other options.
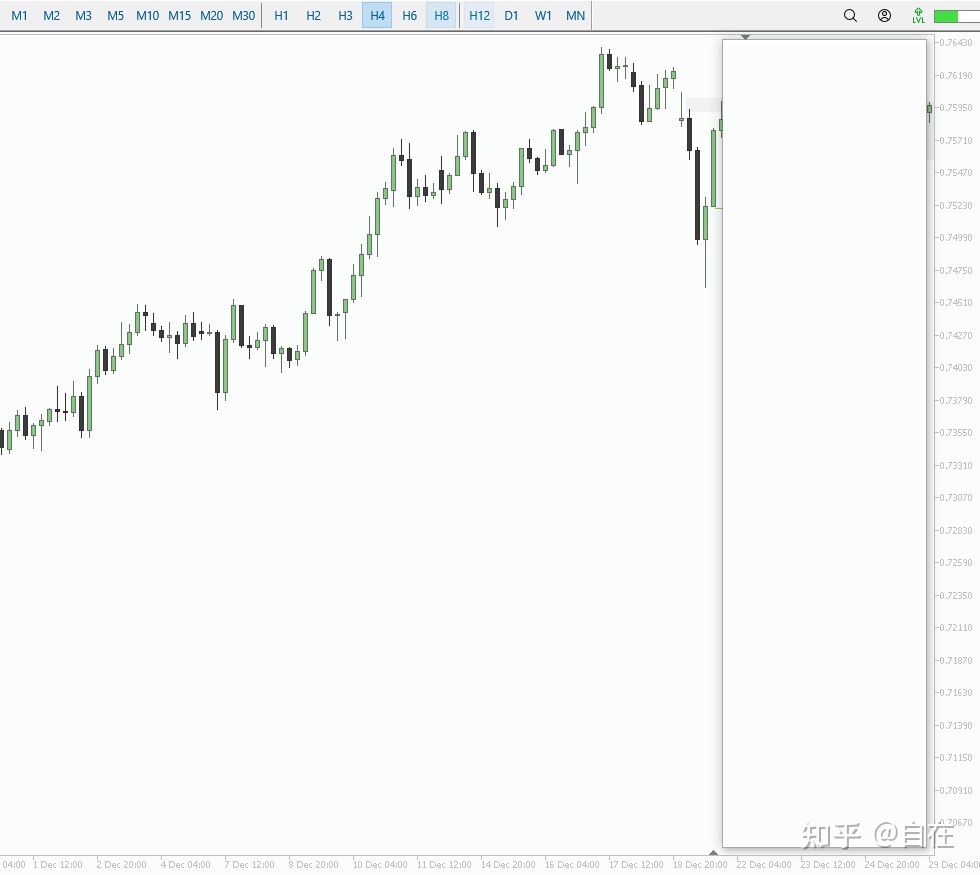
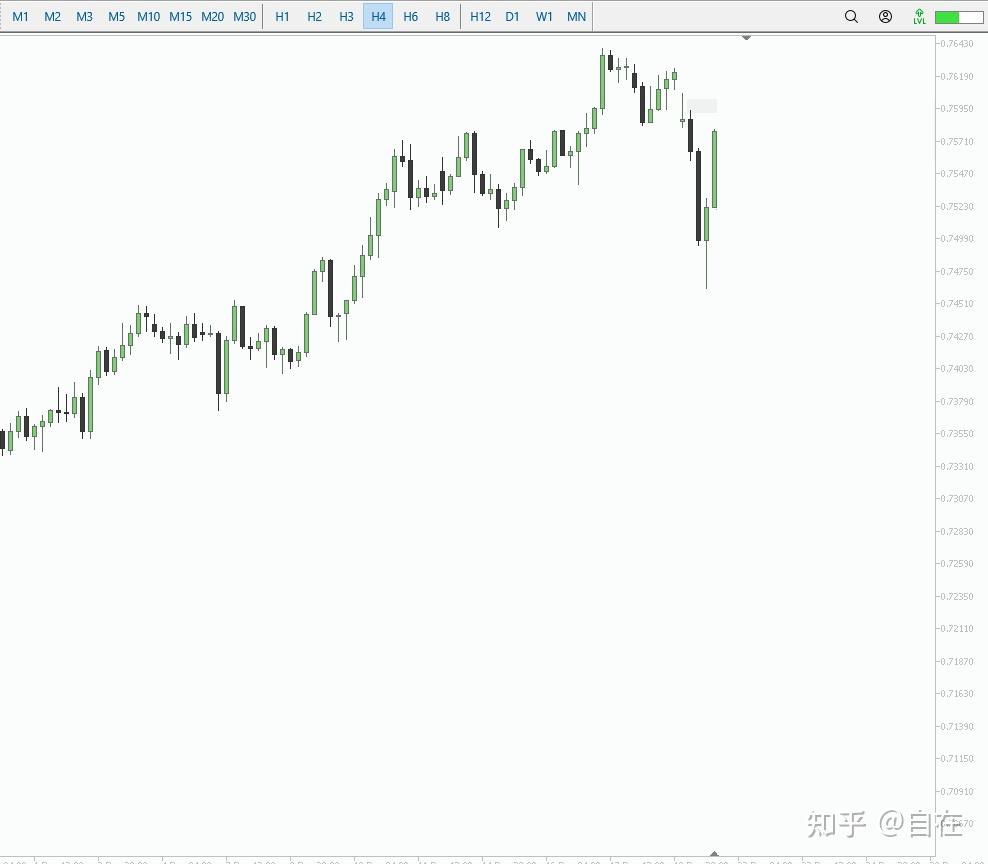
Your chart should now look like the following figure, with the latest candlestick not being cut off and the right-side candlesticks being completely covered (after unchecking the scaling option, the shadow part of the top figure also becomes a solid Cover).
Exit and then reopen Cover. This step is important to check if Cover is still in the same position before closing.
If the position and state have not changed, you don't need to modify it again (some options will be automatically checked upon launch, you can ignore them).
If Cover automatically returns to the center of the screen, repeat step 2, adjust it again, and then exit and re-enter.
Setting up MT4/MT5:
1.Turn off the option for automatic scrolling of the chart.

2.In the lower-left corner of the chart window, find a small triangle button that can be dragged to determine where the chart position begins.
3.Drag the triangle button to the right to align with the center of the last candlestick (located on the left of Cover).

4.Next, it is essential to click on all the timeframes you plan to view to prevent price from jumping directly to the end when switching timeframes. (Note: if you don't switch timeframes for a long time, price data will be reloaded, and it will jump directly to the end).
For this example, we will only use M1, M15, H4 timeframes.
Market Replay
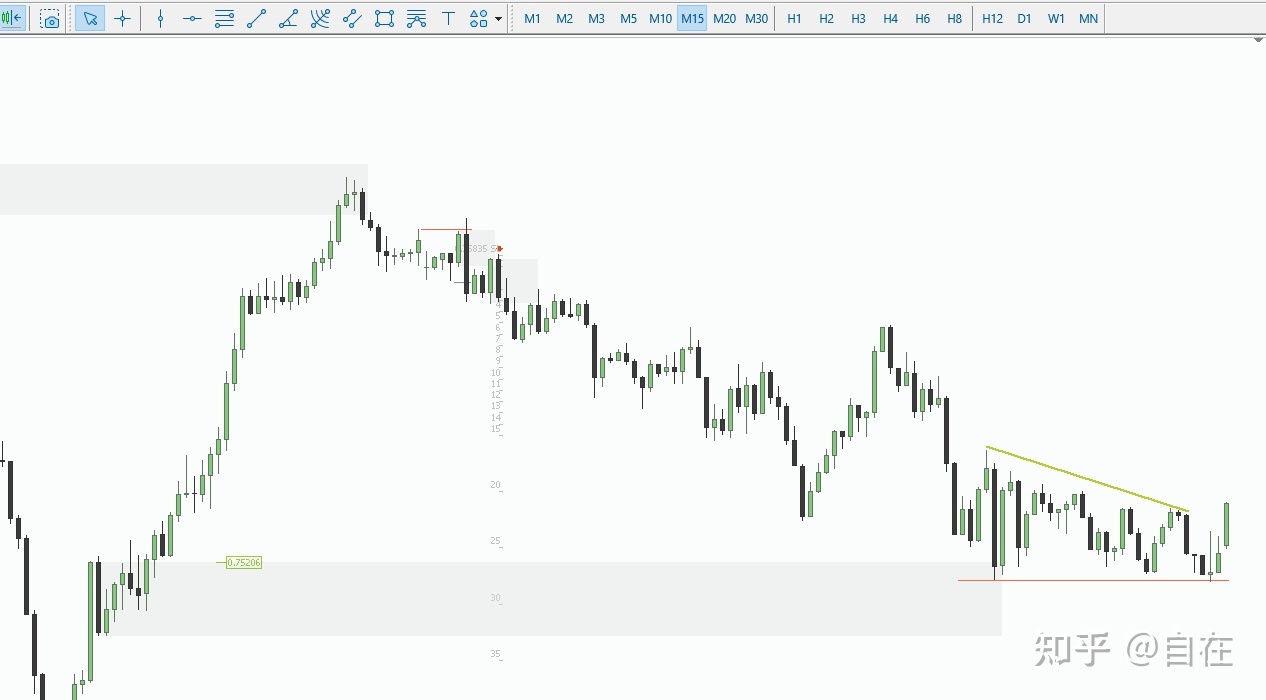
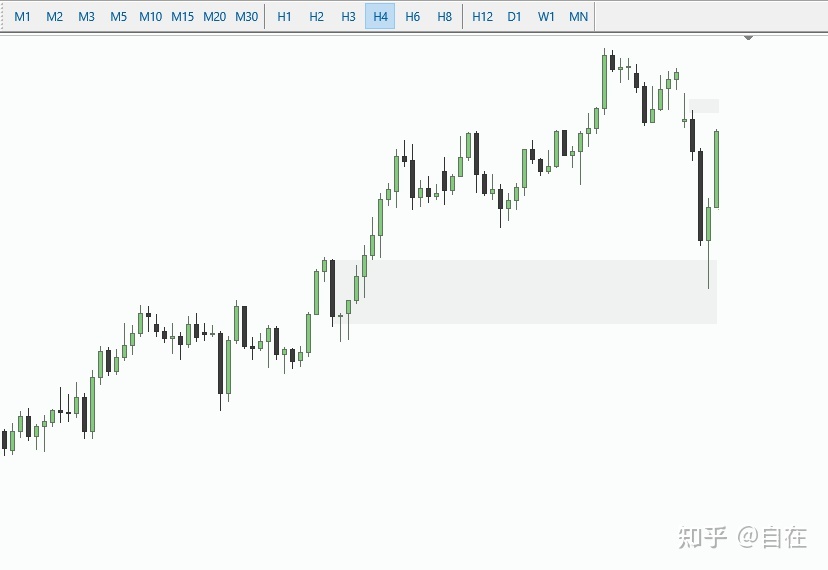
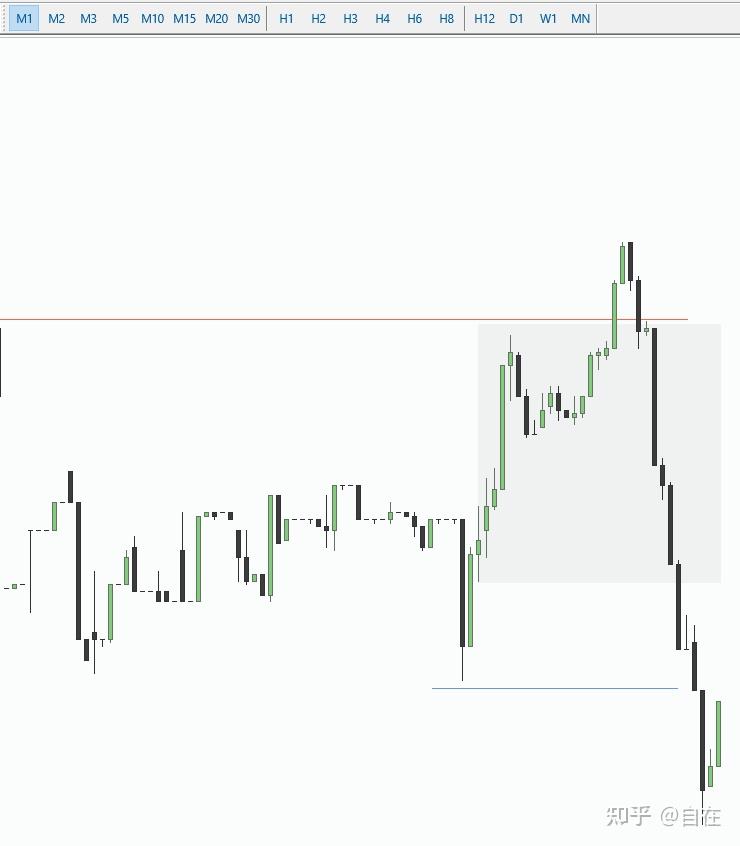
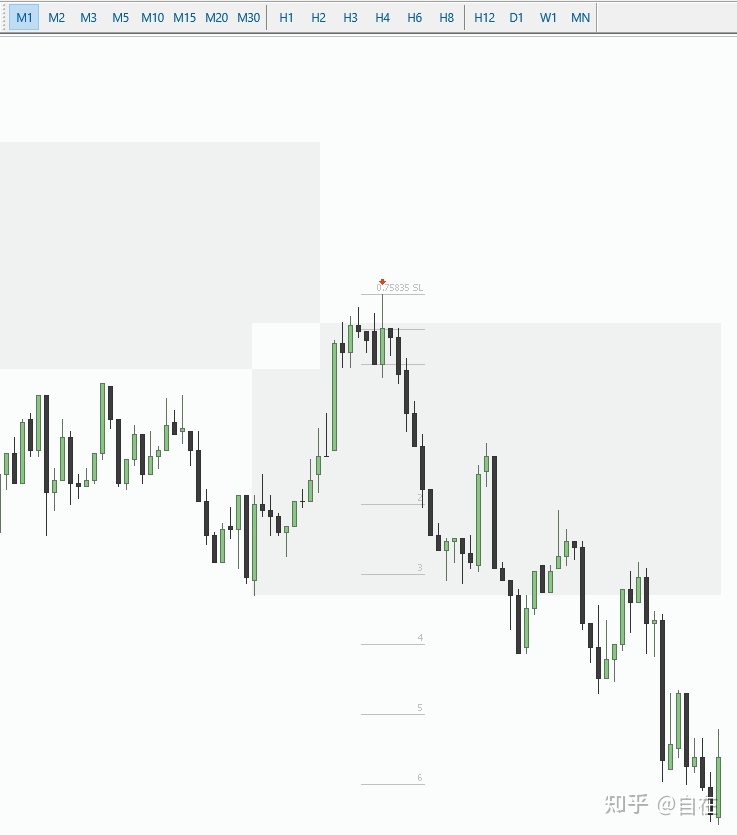
H4
The market environment is in a bullish trend, and there has been a recent momentum reversal. However, a strong rebound occurred at the demand order block (OB) below.
Expect the price to fall below the supply OB above, and the target is aimed at the pinbar closing below.
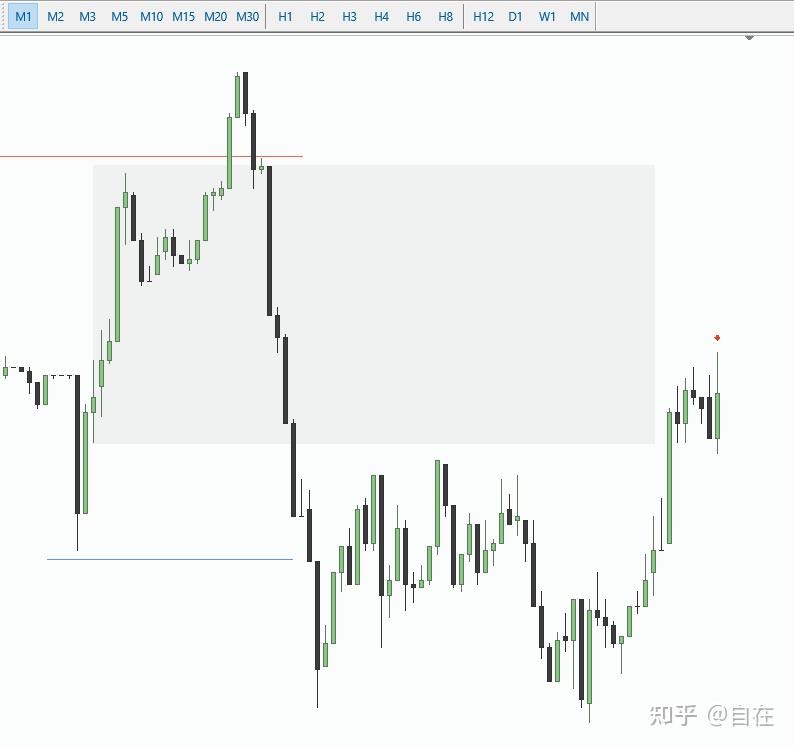
M15
Switch to M15 timeframe, and the chart will directly display the price as shown in the figure below. You will find that the price has retreated for 4 hours, which is normal.
This is because the 4-hour candlestick that opens at 4 o'clock contains prices between 4:00-20:00.
The 15-minute candlestick only includes prices between 4:00-4:15.
If you don't understand, it's okay. For the purpose of reviewing, it's always better to move the price to the left rather than to the right.
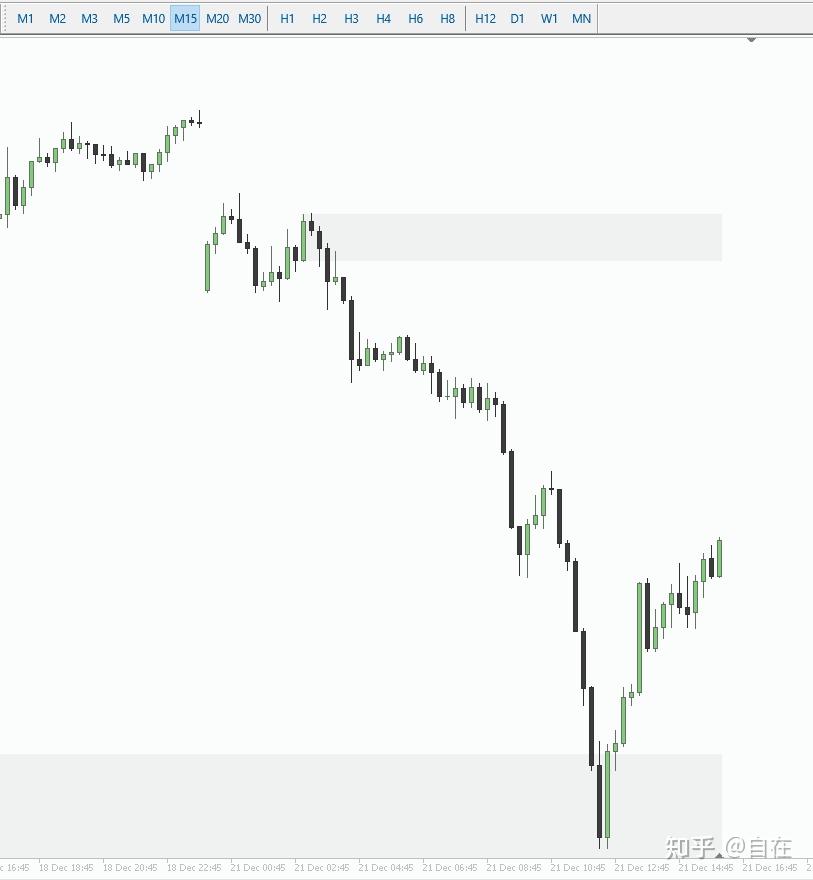
Press the F12 key on the keyboard and manually move the candlesticks one by one to the 20:00 point, which is where the H4 chart is located (the right arrow key on the keyboard can switch 4 candlesticks at a time, which is suitable for resetting the price, but not recommended for replay analysis).
Next, we will observe the price behavior when it enters the upper OB, but there was no clear reversal signal until the end of the day.
At 1 a.m. the next day, the price broke through the recent structural low, confirming the LH. The awaited trading opportunity has emerged. Mark the OB on the M15 chart and switch to a smaller time frame for observation.
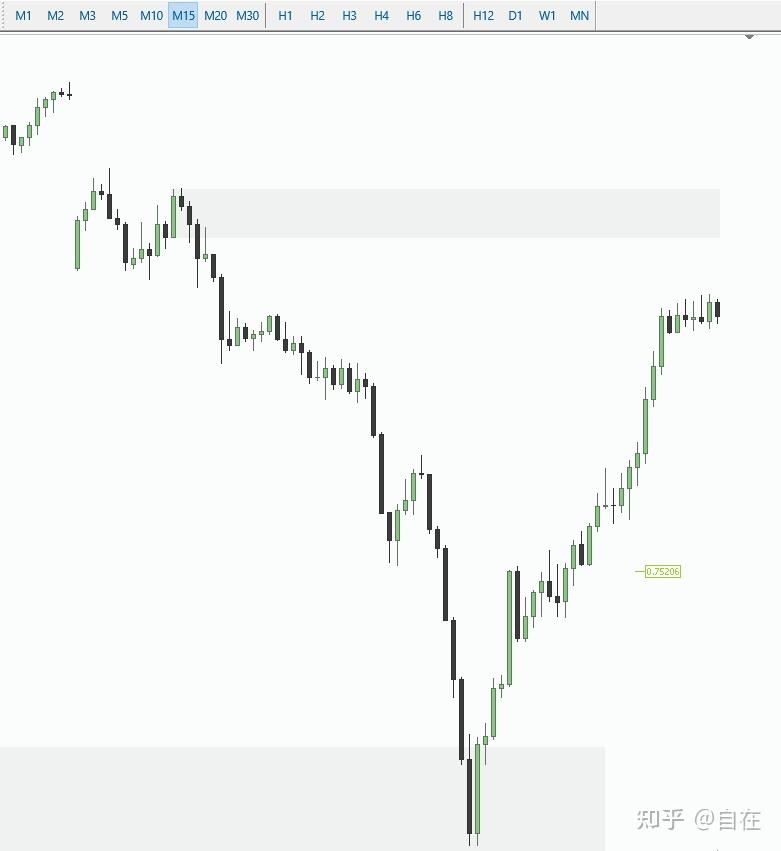
M1
Switching to M1, press F12 or the right arrow key to scroll 15 candles to bring the price to the same location as M15.
You can see a strong momentum imbalance on this 15-minute chart, indicating that the price is unlikely to return to the LTF OB level above.
Before entering the OB, there was a downward trap to accumulate BSL.
When the price breaks above the previous high and enters the OB range, it can be seen as a B2S, but we need to wait for the upward momentum to be exhausted and then a reversal occurs.
For strong momentum trends, limit orders may not always be filled. In such cases, a breakout order can be placed at the low point of the last bullish candlestick shadow (MT5 can use a Sell Stop Limit order to sell at a limit price below the current price to prevent slippage and sometimes save some points).
Add an entry mark here and continue to observe the price movement.
Once the partial take-profit is hit, enter the holding phase where you can switch between different timeframes to find entry opportunities (pay attention to the PD structure of buying low and selling high), and observe price movements until the price reaches the expected target or shows a clear reversal signal at the HTF OB.
In addition, it is recommended to frequently check the H1 timeframe and check the H4 timeframe every few hours during platform time. It's important to note that during high liquidity periods in the European and American markets, there may be significant reversals. If time permits, we will write an article specifically discussing timing-related strategies.
Once the target position is reached, start a new round of observation.