A novice trader, getting into the Forex currency market , is sometimes literally “washed away” by a stream of recommendations for studying and mastering techniques, methods, tactics and strategies . The latter, in turn, require to comprehend at least thirty basic indicators . The authors who created them have written more than one book as a guide to their operation, and each of them is perceived by the Forex community as a bible. In general, it will take more than one year to comprehend this material, then the importance of mastering the basics of psychology and NLP will “emerge”, etc., the terms of real work on the market will move beyond the horizons of the boundless future.
Without at all denying the importance of the above in the education and development of an individual as a trader, we note that modern small arms have a number of undeniable advantages, but the “three-ruler”, made at the beginning of the 20th century, is still no less deadly.
The securities market was born two centuries ago, the first traders traded without technical indicators, managing to be profitable. Reasonably using logic and monitoring prices, you can make up a strategy that is understandable to a beginner and works.
Japanese candlesticks and significant levels
Japanese candlesticks are a way of presenting continuously changing market quotes in the form of time ranges, highlighting the extremes of entry and exit prices.The primary analysis of the market took place using various repeating combinations of candles. Also, each candlestick has 4 parameters, which were used in the process of evolution in the mathematical formulas of indicators. Traders themselves made the conditional reference points of prices significant technical analysis data: indicators are calculated on them, support lines , resistance lines, graphical analysis channels are drawn, states of “calm” or movement” of the market ( trend or flat ) are determined.
The primary analysis of the market took place using various repeating combinations of candles. Also, each candlestick has 4 parameters, which were used in the process of evolution in the mathematical formulas of indicators. Traders themselves made the conditional reference points of prices significant technical analysis data: indicators are calculated on them, support lines , resistance lines, graphical analysis channels are drawn, states of “calm” or movement” of the market ( trend or range ) are determined.
Components of the success of the "10 points" strategy
Written works on the art of trading contain the dogmas of market trading. Over the years, traders have paid with their own money out of their own pocket and others to find them. You just have to use these concepts correctly, making a successful strategy.
It is believed that it is more reliable to analyze the trend of the market direction when choosing a higher timeframe. It is impossible to predict stable trends on five-minute timeframes; daily timeframes are considered reliable . The 10 point strategy is based on daily candles.
Recognized market trading coaches point out the need to make trades at significant points in price fluctuations. Entries according to the strategy are made at the closing and opening prices of the previous daily range. The significance of these levels was indicated by us above.
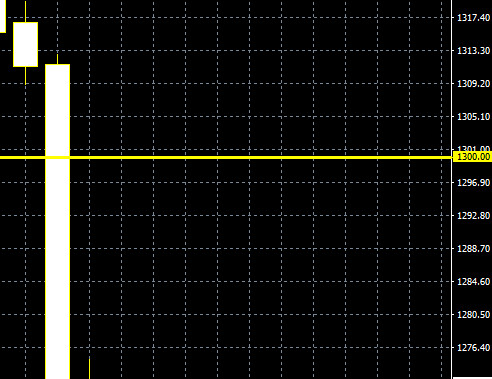
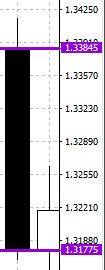
The strategy is based on observing the trading style of intraday traders. They often place protective orders of their trades just above/below the trading range of the candle body. On the other hand, the frequently observed phenomenon of “breakthrough” of resistance/support levels is explained by the fact that quotes have reached the level of protective orders. When triggered, they “push” the price in the direction of the “move”. The more significant the level, the “higher” the acceleration. The figure below shows two breakouts of "magic levels" quotes. It is believed that "round" price figures have the "magic" of resistance and support, not for any technical reasons, but simply based on the psychological perception of traders of a round price.


False breakdown and pullback are inevitable components of a breakout. The price, which first rushed into the “gap” of the level, can just as quickly return back. Take profit according to the strategy is set in advance, which eliminates the risk of price rollback after a breakdown.
Strategy execution tactics
The choice of instrument stems from the name of the 10 points. The strategy is designed for the most liquid currency pair EUR\USD . If the broker allows you to trade with a commission of 2 pp, you can try to connect pairs of US dollars with pounds and francs .
Determine the closing and opening levels of the daily candle. We place pending orders a little higher than these levels for buying, a little lower for selling, immediately setting a standard take profit of 10 points . This can be done in one window of the created trade order. Order type - Buy (Sell) stop.

The Forex market operates 24 hours a day and usually does not contain price gaps. The closing price of the daily candle is the opening price of the next candle. In fact, the strategy is aimed at catching continuations and reversals of trend movements. Unexpected events or a planned "attack" of speculators using significant funds can reverse the trend.
Modifications of the strategy 10 pp.
Profit targets (about 10 pp) remain roughly unchanged. Modifications are subject to entry levels. The extrema of the daily candle are also significant levels and can serve as a basis for placing pending orders to open deals.

The desire to create a “break-even strategy” led to the combination of “10 points” with the “martingale” tactics, an open transaction that did not reach the target profit level when rolled back to a certain level was supplemented by another transaction larger than the first one. Stop loss was not set at all, there was a series of averaging with an increasing number of open lots.
Without disputing the very method of such trading, I would like to point out that the final rate of return of 10 pp is infinitely small for such a “break-even fight”.
conclusions
An example of non-indicator trading in the Forex market is given, which does not require detailed analysis and the constant presence of a trader, with simple clear rules. After conducting tests or real trading, you will get a benchmark of profitability and returns of this strategy. In the process of searching for new trading systems, having the current one in front of your eyes, you will very soon come to the conclusion that complexity does not guarantee an increase in the trading result.
Automate your trading with our Robots and Utilities
EA Long Term MT4 https://www.mql5.com/en/market/product/92865
EA Long Term Mt5 https://www.mql5.com/en/market/product/92877
Scalper ICE CUBE MT4 - https://www.mql5.com/en/market/product/77108
Scalper ICE CUBE MT5 - https://www.mql5.com/en/market/product/77697
Utility ⚒
EasyTradePad MT4 - https://www.mql5.com/en/market/product/72256
EasyTradePad MT5 - https://www.mql5.com/en/market/product/72454
Risk manager MT4 - https://www.mql5.com/en/market/product/72214
Risk manager MT5 - https://www.mql5.com/en/market/product/72414
Indicators 📈
3 in 1 Indicator iPump MT4 - https://www.mql5.com/en/market/product/72257
3 in 1 Indicator iPump MT5 - https://www.mql5.com/en/market/product/72442
Power Reserve MT4- https://www.mql5.com/en/market/product/72392
Power Reserve MT5 - https://www.mql5.com/en/market/product/72410


