Price Ray indicator is a utility that will improve the way you trade. Primarily, it shows the Bid, Ask or Last price as a line ray which beams till the current candle, last visible chart candle or extended to all candle bars. The enhanced features in this indicator provide information in an area where you focus most, right next to the current candle. You can select text to be shown above or below the Price ray. The indicator is fully customizable, allowing it to fit any strategy requirements.
| Price Ray functionality includes:
|
|
This document details the functionalities and is also a guide on how to configure the indicator.
| Price Ray Settings |
The following are the customizable indicator settings:
| | : | You can temporarily disable the indicator rather than deleting it. |
| | : | Adjust the GMT offset for the server time. This is required for drawing the session range correctly on the chart. For e.g. If the server is location GMT +2 (Cyprus) Without GMT - 120 minutes With GMT - 180 minutes |
| | : | You can choose the Bid, Ask, Last price or Bid & Ask for the Price Ray to be shown. |
| | : | Decide the format to show current spread as Pips or as Points. |
| Text Display |
The indicator allows the display of the following text above or below the price ray. Below are the options:
- Bid, Ask, Last Price (server feed required)
- Current spread (in pips or points)
- Bid price with spread
- Candle Range (High-Low & Open-Close) » The range and the body size for a defined time-frame candle in pips -> the range as HL (High-Low) and the body size as OC (Open-Close).
- Candle Timer (actual or as percentage)
- Option not to show any of the above
The customizable parameters related to the “Text Settings” are:
| | : | You can select the Text to be shown above and below the Price Ray |
The indicator allows customisation of Line (extension, style, width and colour), Dot (enabled or not, dot size, shifting the dot and line ray to the left) and the Text (font, size and colour). You can choose whether the colour of Price Ray is constant, or it changes based on trend. Also, you can select the bullish or bearish colour for the trend.
| Styling and Formatting |
Below explains on how you can configure the “Line Ray Settings” and “Font Settings”
| | : | The Line ray beams till the current candle, last visible bar or the maximum candles (all bars) on the left of the screen.
NOTE: The toggle option is not available if "Maximum Candles" is selected. | ||
 | : | The indicator allows you to decide on the styling of the Line ray as a solid line or others provided as a list. Also, you can choose the thickness and the colour of the line (See “Trend Settings” to change the colour as per trend). | ||
 | : | You may choose whether you want the dot to be displayed. You can configure its size and also shift the ray dot as required. | ||
 | : | You can choose the Font and colour of the text shown above and below the Price Ray. |
| The Trend |
The ideal way to determine a trend is to look at the chart with trend lines drawn on the highs and lows. Added to this, the strategy may include, to determine whether the current price is above or lower to opening price for a higher time-frame. Price Ray indicator changes the line ray colour based on bullish or bearish candle body of a selected time-frame. I trade on a H1 period and keep the trend timeframe for M30. It works with my strategy.
The following are customizable parameters related to the “Trend Settings”
| | : | You may decide if colour of the price ray will change depending on the bullish or bearish body colour of the selected time-frame. If “false”, the indicator will use a constant colour as defined in the “Line Ray Settings”. |
| | : | You can choose the time-frame for the trend candle from the list. If “current”, the indicator considers the chart time-frame. |
| | : | You can select the bullish and bearish colour to be used by the indicator. |
Range on chart: Drawing the current Range on the chart will allow for confidence in trend confirmation visually. Price Ray is fully customizable to allow various strategy requirements.
| | : | Select the timeframe for the range to be shown on the chart. Price Ray will display the high, low and open values for the timeframe. You may select to show the previous candle or current candle range. In case the previous candle range is chosen, clicking on the range rectangle will toggle the extension of the range line (high and low levels) till the current bar. Similarly clicking the open level will extend till the current bar. 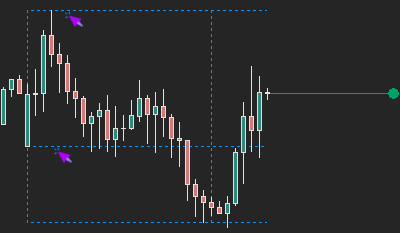 |
| | : | Decide if the timeframe range is shown on the chart as default. Price Ray allows to show or hide the range with buttons. NOTE: The button is hidden in case specified Range timeframe is less or equal to the chart period. i.e. the button will be hidden on a D1, W1 or MN chart in case a Daily range is selected. |
 | : | Select the style, thickness and colour of the line shown for the timeframe range and open price on chart. |
A Trend Strategy: As an illustration, I have tried to explain a strategy to trade based on the body colour of the candle for the higher time-frame. I have taken a live case scenario taken on 22 Jan 2022 (weekend), in my explanation.
In Figure 1, for a H4 chart - EURUSD, I have highlighted the recent candles being discussed (candle 0 - current and candle 1 - previous).
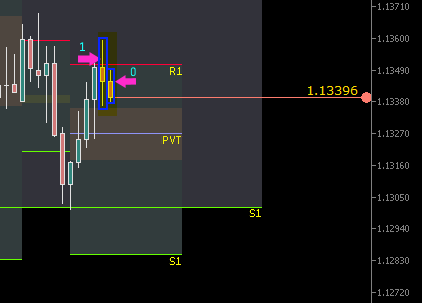
Figure 1 (EURUSD - H4)
The R1 (Pivot Levels) resistance was strong in stopping the bullish trend and a reversal candle formed in the H4 timeframe (candle - 1).
The H1 chart in Figure 2 for EURUSD, the H4 bar highlighted as hourly candles, shows that the bears have taken control and selling pressure is prevailing.
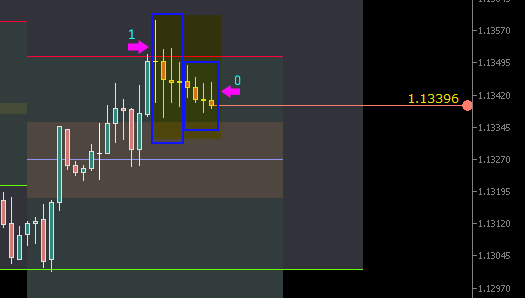
Figure 2 (EURUSD - H1)
If you are trading on a 15 minutes chart, the trend looks confusing as bulls and bears are pushing the price up and down, as shown in Figure 3.
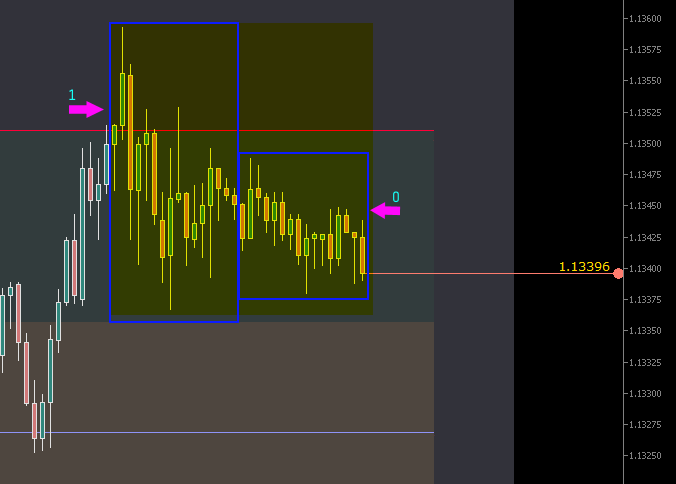
Figure 3 (EURUSD - M15)
As a scalper, trading the 15 minutes period, you may either decide to stay out of the market or have a strategy to trade as per the higher time-frame and only take sell positions. The body colour of Price Ray for a higher - H4 timeframe denotes a bearish trend, helping you have some profitable trades.
Figure 4 shows that the bearish trend continued the next week (in fact, the bearish trend continued till end of the month reaching 1.1125).
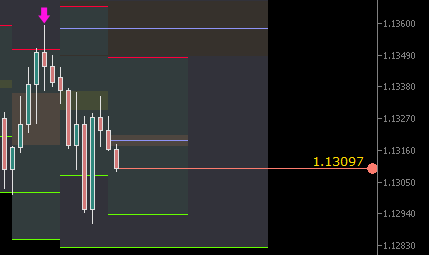
Figure 4 (EURUSD - H4)
The indicator also displays range (HL - High-Low) and body size (OC - Open-Close) as pips/points for any time-frame candle. It shows the strength or weakness of the currency pair (e.g. EURUSD) being traded.
| Candle Timer |
I have included a comprehensive Candle Timer with Price Ray. Candle timer displays remaining seconds to the close of a time-frame candle, either above or below a Price Ray. It triggers a notification alert irrespective of the selection of candle timer as a text.
| | Notification Sound Button: Click a button to enable or disable the notification sound. You may decide to disable the sound alert temporarily. It is also useful when the indicator is being used in multiple charts. |
Below are the “Candle Timer Settings” to be configured as required.
| | : | You can choose to have a notification alert for a current chart period or for any time-frame. | |||
 | : | The indicator announces an alert at specified seconds before close of the current candle. You can select the alert as a pop-up or a bird chirping sound. The default option (notification sound) is the setting for the Notification Sound Toggle button. I have provided some bird sounds to select from a list. The list includes a Canary, Cardinal, Meadowlark, Owl and Rooster. | |||
| | : | You can choose the location of the Notification Sound Toggle button in the chart window. "Window 0" is the default chart window. As you add other indicators to be shown on separate windows (for e.g. RSI, Stochastic, etc.), the platform will show it on “Window 1” and onwards.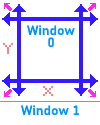 You can select the button to be displayed on any of the four chart corners and also adjust the location by specifying pixels to shift on the x and y axis.
|
| Please note: |
- The display of "Last Price" depends on the availability of price feed (data) from the server.
- The indicator changes the Chart Properties (Function key - F8: Common tab) for enabling and disabling the default selected Price to be shown as the Line ray. You can change it when needed.
- The indicator will show any errors in the "Journal" and "Experts" tabs in the terminal/toolbox (Ctrl+T) window. Please check in case you encounter any errors.
Disclaimer: Past performance may not show future results. You cannot hold me responsible for use of the indicator or for any information provided in this document.


