
Yesterday the GBP / USD pair was trading lower and closed the day in the red around the $ 1.3105 price. Today the pair was trading in a narrow range of $ 1.3085-15, staying close to yesterday's closing price. On the hourly chart, GBP / USD is testing the strength of the support - the moving average MA (200) H1 ($ 1.3105). On the four-hour chart, the pair remains above the MA 200 H4 line. Based on the above, it is probably worth sticking to the northern direction in trading and while the pair remains above MA 200 H1, it is necessary to look for buy entry points at the end of the correction.
The main scenario for the pair's advance is continued growth to $ 1.3165 (the maximum of the American session on August 19). An alternative scenario implies consolidation below the MA 200 H1 level with a subsequent decline to $ 1.3005 (August 12 minimum).

Sentiment EURUSD
Sentiment EURUSD
Sentiment of market positions is the ratio of traders' positions on the Myfxbook service . We will be interested in the skew of positions from 70/30 and stronger. The point is that the minority earns in the market. If the instrument has been in a significant skew of positions for a long time, a large player can push the price in his direction.
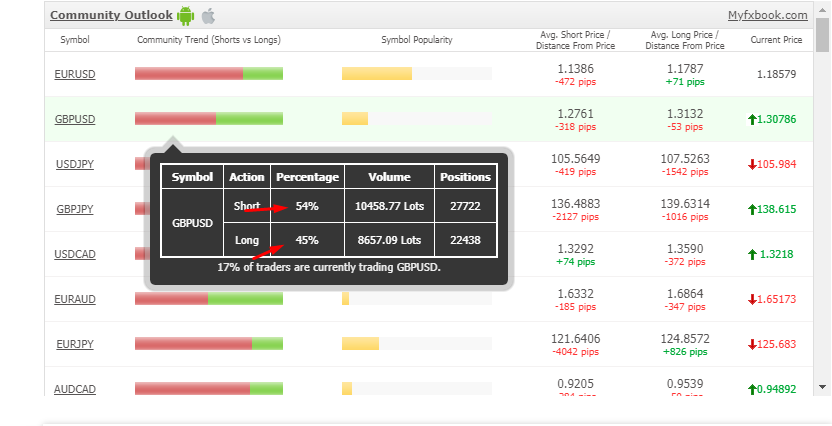
In most cases, I consider the smaller side for opening deals, since you must understand that it is just the minority who make money in the market. + I always focus on the continuation of the trend
The entire list of the ratio of traders' positions for buying and selling can be viewed on my website in the sentiment section
EUR / USD
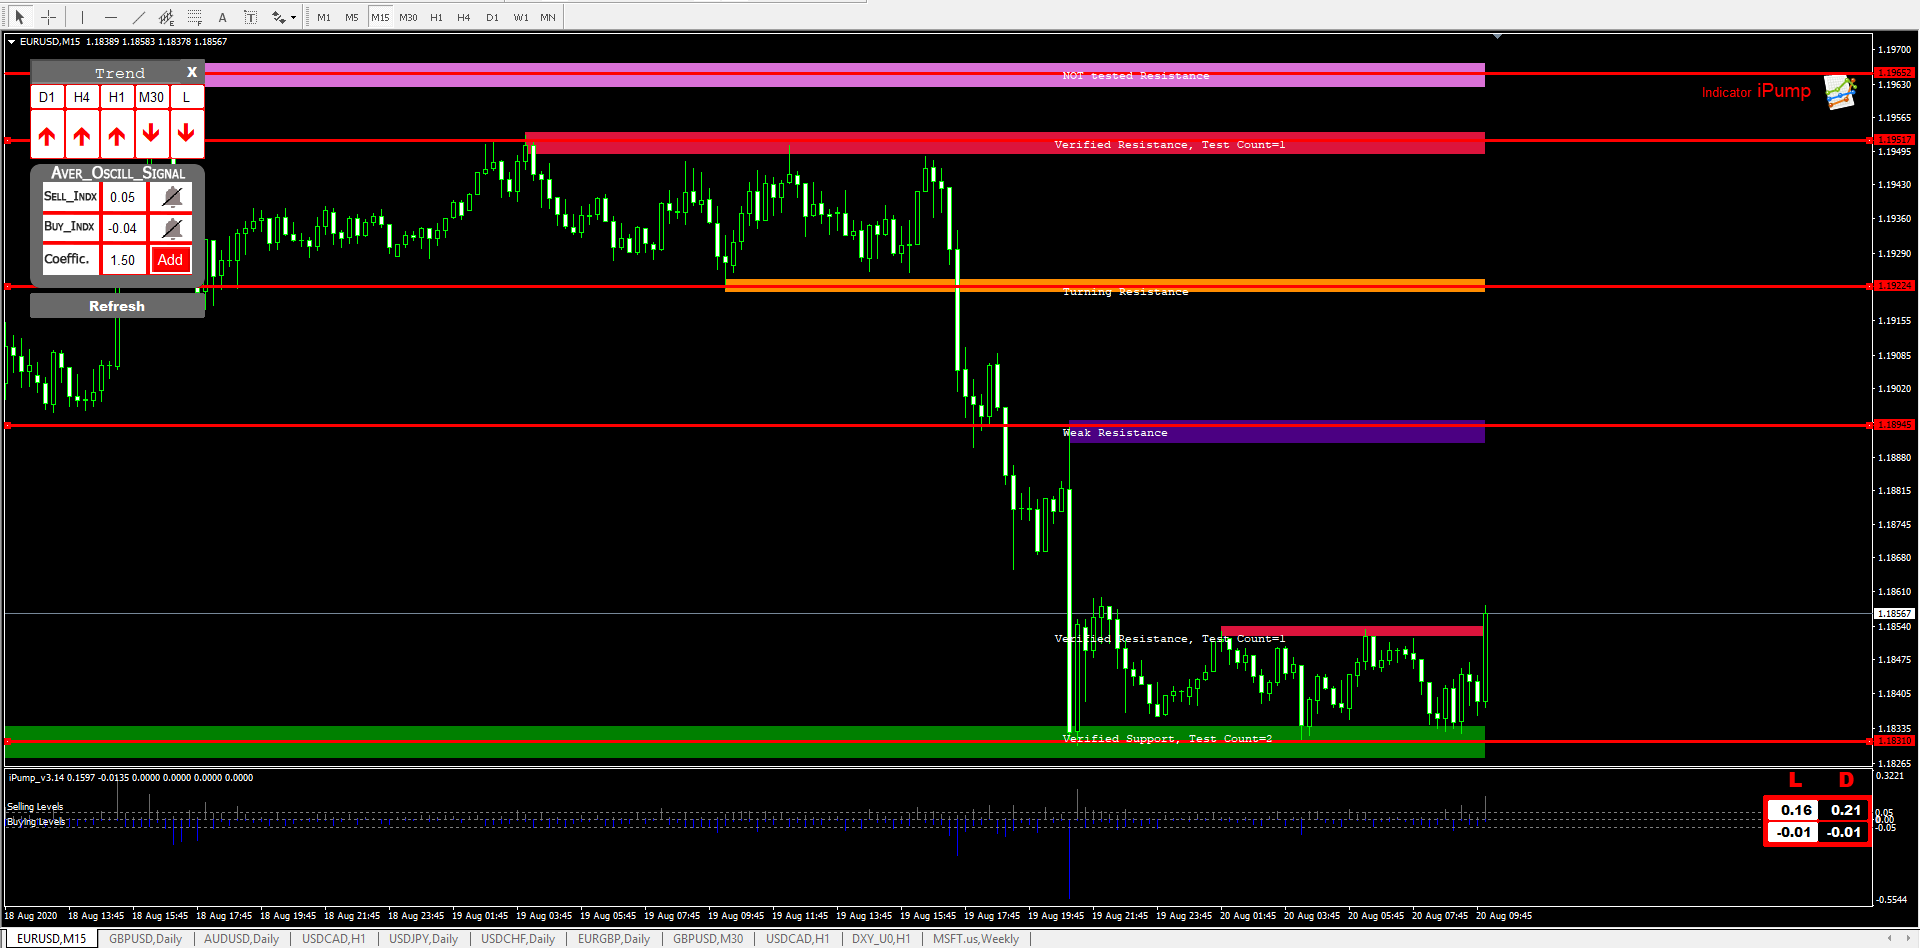
Yesterday the EUR / USD pair was trading lower and closed the day in the red around the $ 1.1840 price. Today the pair was trading in a narrow range of $ 1.1830-50, staying close to yesterday's closing price. On the hourly chart, EUR / USD is testing the strength of the support - the MA line (200) H1 ($ 1.1825). On the four-hour chart, the pair remains above the MA 200 H4 line. Based on the above, it is probably worth sticking to the northern direction in trading and while the pair remains above MA 200 H1, it is necessary to look for buy entry points at the end of the correction.
Resistances are at: $ 1.1890, $ 1.1950-65, $ 1.2000
Support levels are located at: $ 1.1830, $ 1.1780, $ 1.1755
The main scenario for the pair's advance is continued growth to $ 1.1890 (the maximum of the American session on August 19). An alternative scenario implies the final consolidation below MA 200 H1, followed by a decline to $ 1.1755 (the minimum of the American session on August 12).
Sentiment GBPUSD

Tools than can help your trading
![]()
The iPump indicator was used for this analysis
https://www.mql5.com/en/market/product/39895
Indicator defining the trend, levels, overbought / oversold

EA Pump and Dump Pro
https://www.mql5.com/en/market/product/51395
Multifunctional robot (averaging/piramiding/strategy for overclocking a deposit)

EA Long Term Strategy
https://www.mql5.com/en/market/product/35069
Trading strategy in the EA Long Term Strategy (fix stop loss, safe strategy)
#EURUSD20.08.2020analysis #GBPUSD20.08.2020analysis


