Bermaui Deviation Percent (BD%)
After I used CSD long enough I found that it is a good volatility measurement tool for the current price, but I cannot use it to compare the volatility of one security with another, because CSD calculation is in point, not in percent. This led me to create Bermaui Deviation Percent.
- You can rent or buy Bermaui Deviation Percent from the market: https://www.mql5.com/en/market/product/24174
- Also I suggest to try Bermaui Bands. Here is the link to demo version: https://www.mql5.com/en/market/product/43084
So what does the word Bermaui mean?
Of course, Bermaui is my nickname, but it have a meaning. The first half "Ber" means the land and the next half " maui" means the water, so Bermaui means the place where land meet water, such as the beach.

Anyone who goes to sea wants to get to the beach. Every trader in the market want to achieve success and that is what I hope for you when you use my trading tools. That is why I call Them Bermaui trading tools.
What is Bermaui Deviation Percent?
Bermaui Deviation Percent (BD%) is a volatility index that measures volatility in percent rather than points. The idea of BD% is to make an index depending on Classic Standard Deviation (CSD) that moves between 0 and 100 percent.
The idea behind this indicator explained in the next steps:
1. Calculate Classic Standard Deviation (CSD) for X number of days.
2. Find the Highest High of CSD in the same X number of days (= HHV (CSD, X)).
3. Find the Lowest Low of CSD in the same X number of days (= LLV (CSD, X)).
4. BD% = (HHV (CSD, X) – CSD) / (HHV (CSD, X) – LLV (CSD, X)).
Therefore, BD% is a William R% Oscillator calculated on Classic Standard Deviation.Some people ask my for the reason that I calculate BD% like this & why I did not invert the calculation method. That is because I use BD% in the calculation of another important indicator called Bermaui Bands.
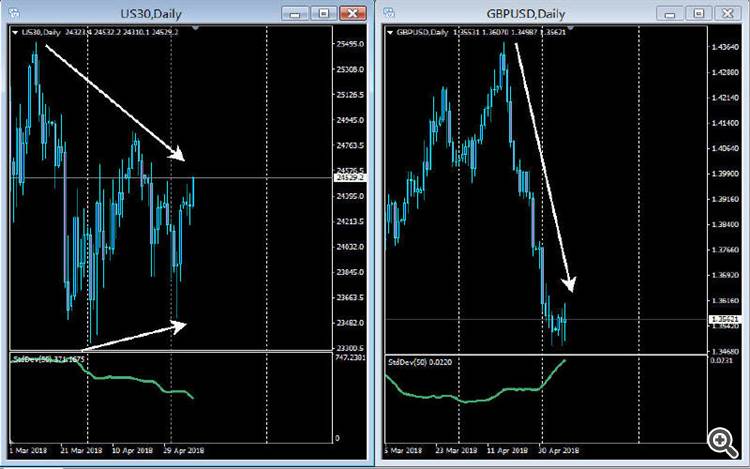
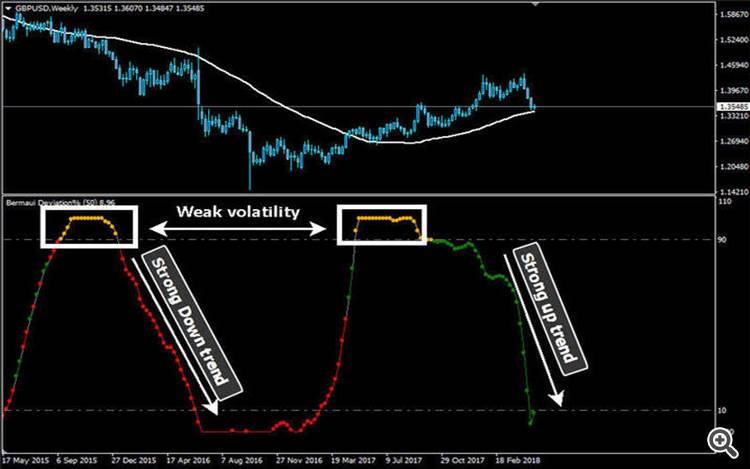
Measuring volatility as percentage rather than in points can be very useful in technical analysis. BD% helps technician to compare the volatility of one security with the other. As an example at 8/5/2018, S&P500 50 bar standard deviation read $400.15 while GBPUSD 50 bar standard deviation of the same day read $0.212. If you show this numbers to anyone, he will tell you that S&P500 is more volatile than GBPUSD, while the opposite is the right answer, because S&P500 was in a sideways movement and GBPUSD was in a steep downtrend as you can see from next charts.
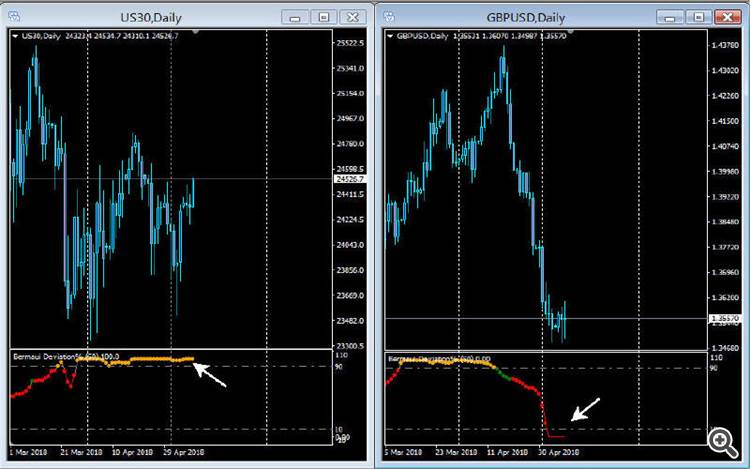
If you look at the same chart depending on BD% you will see that S&P500 reads 100% which mean that volatility is very low while GBPUSD reads 0% which means that volatility is very high (remember that BD% is an inverted scale where 100% is the lowest and 0% is the highest).
That is one reason why BD% can be a good technical analysis tool.
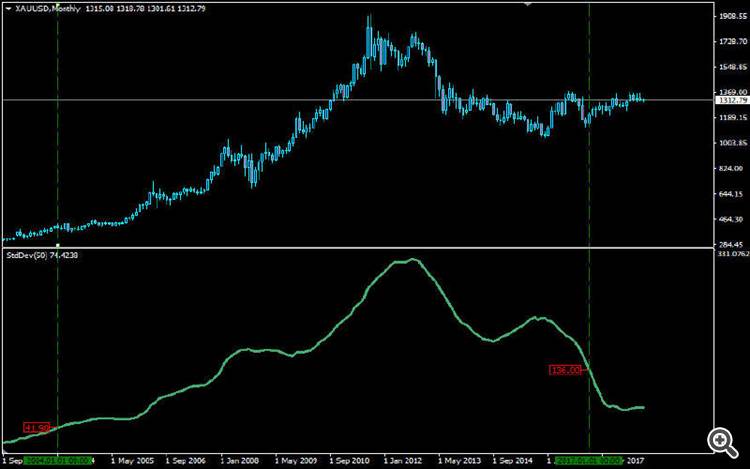
In addition, BD% help at comparing the volatility of the same security in different time periods. As an example the 50 bar period standard deviation of Gold on monthly chart at January 2004 was $41.9, while it read $136 at January 2017. If you show the numbers to anyone, he will tell you that Gold at 2017 is more volatile than what it used to be at 2004, while the opposite is the right answer.
If you look at the same chart depending on BD% you will see that Gold reads 100% at January 2017 which mean that volatility is very low while it reads 0% at January 2004 which means that volatility was very high.
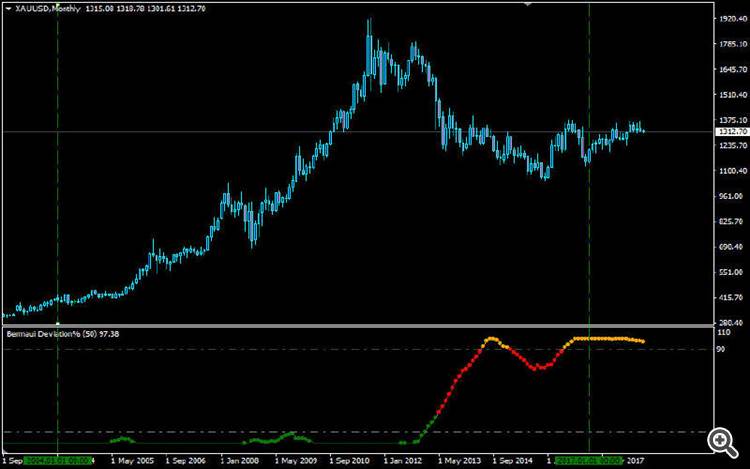
As you can see, Percent based technical indicators can be very useful giving traders a great advantage when analyzing the market.
How to use BD% as a trading tool?
When I trade with BD% I usually add a Simple Moving Average (SMA) to the chart with the same period as BD% (default is 50 bars). CSD is the square root of the difference between prices and its simple average that is why adding SMA to the chart is logical.
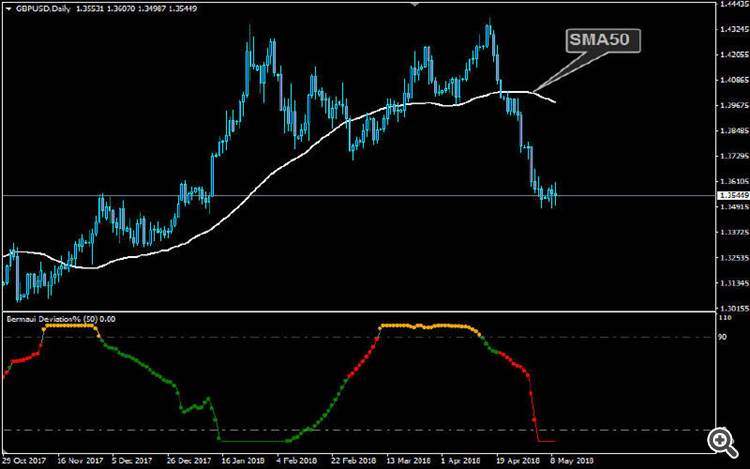
- If price candles are above SMA50 & BD% is below 90% then BD% color will be Green.
- If price candles are below SMA50 & BD% is below 90% then BD% color will be Red.
- If DB% is above 90% then BD% color will be Yellow whether price candles is above or below SMA50. This indicate that standard deviation is weak relative to the last 50 reads.
Trading with BD%
BD% can be used in different trading strategies like any other technical analysis tools. It is very helpful at differentiating between trending & sideways markets. Here is a strategy that I found to be a good start for you using BD%.
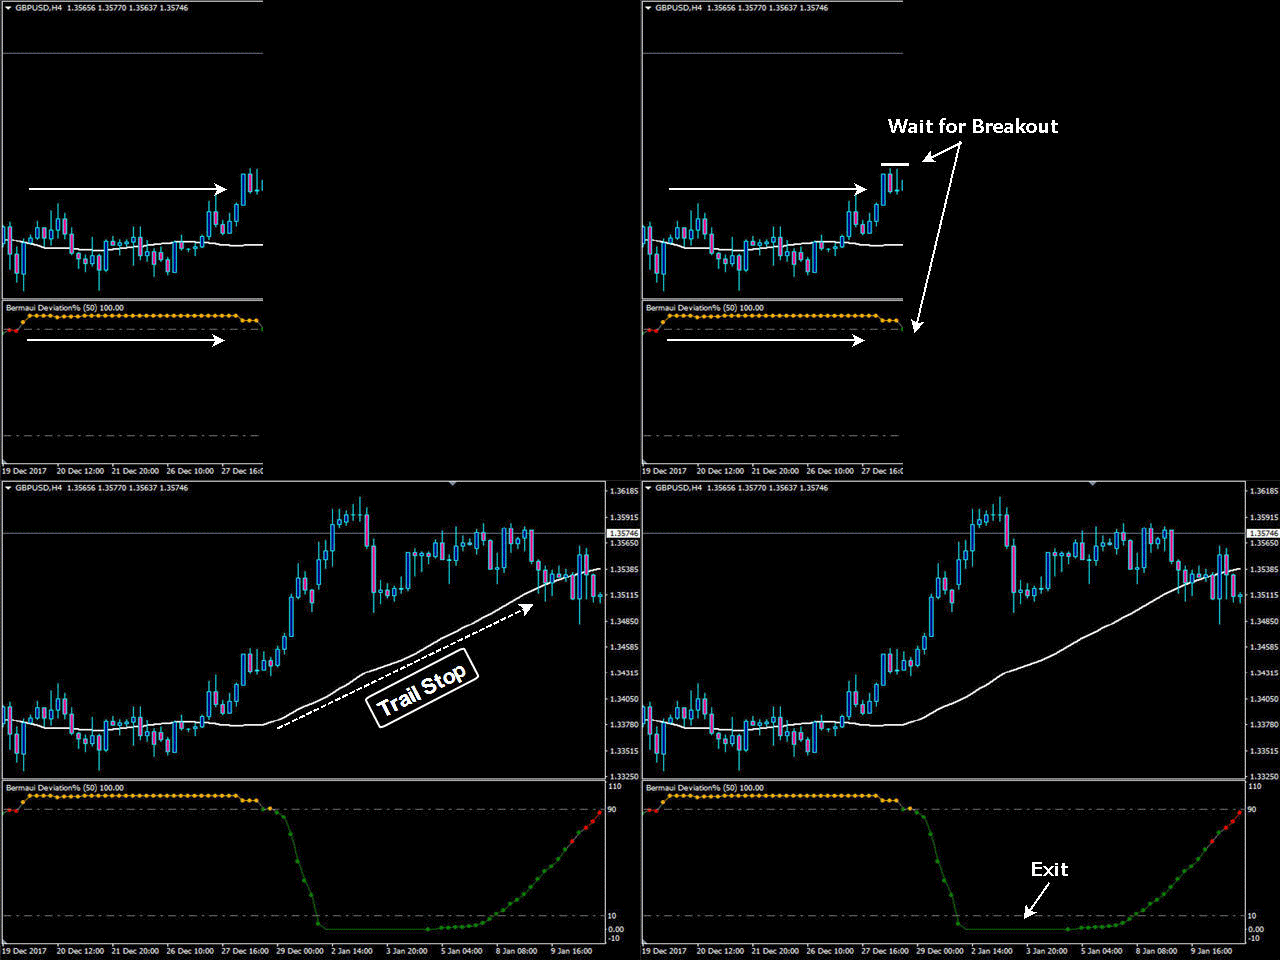
BD% enter Buy Strategy
- If BD% is above 90% and then crosses this level downwards, and the price is already above its simple moving average, this is a sign for the beginning of a new ascending trend.
- As BD% gets deeper to the downside, volatility and trend strength are increasing.
- When BD% is 0%, this means that volatility is at its highest value.
- When BD% leaves 0%, then volatility is decreasing and ascending trend is getting weak.
- You can trail stop using moving average.
- Exit should be when BD% cross 10% to the downside toward zero.
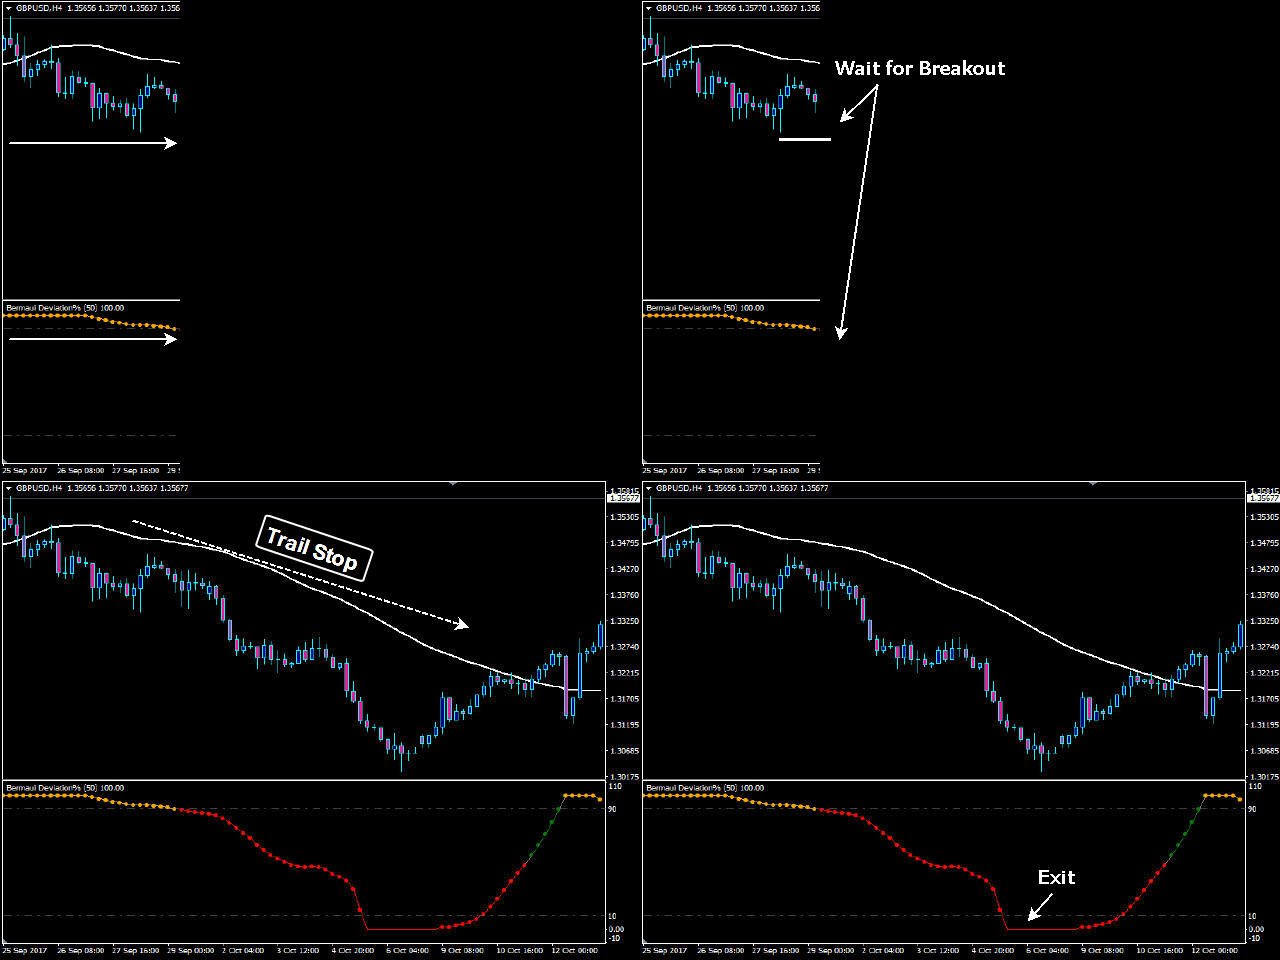
BD% enter Sell Strategy
- If BD% is above 90% and then crosses this level downwards, and the price is already below its simple moving average, this is a sign for the beginning of a new descending trend.
- As BD% gets deeper to the downside, volatility and trend strength are increasing.
- When BD% is 0%, this means that volatility is at its highest value.
- When BD% leaves 0%, then volatility is decreasing and descending trend is getting weak.
- You can trail stop using moving average.
- Exit should be when BD% cross 10% to the downside toward zero.
This is the main strategy that I use to trade with BD%, but this does not mean that you can combine this indicator with other technical analysis tools to create more robust trading ideas and strategies.
I suggest to try BD% with:
- MASR Bands: https://www.mql5.com/en/market/product/43431
- Bermaui Bands : https://www.mql5.com/en/market/product/43084
- Moving Average Cloud: https://www.mql5.com/en/market/product/15576
I hope that this simple manual for using Bermaui Deviation Percent is helpful for you. If you have any question send it to me and I will answer as soon as I am online.
Best regards
Muhammad Al Bermaui, CMT
![[MANUAL] - Bermaui Deviation Percent (BD%) [MANUAL] - Bermaui Deviation Percent (BD%)](https://c.mql5.com/6/803/splash-718182.jpg)
