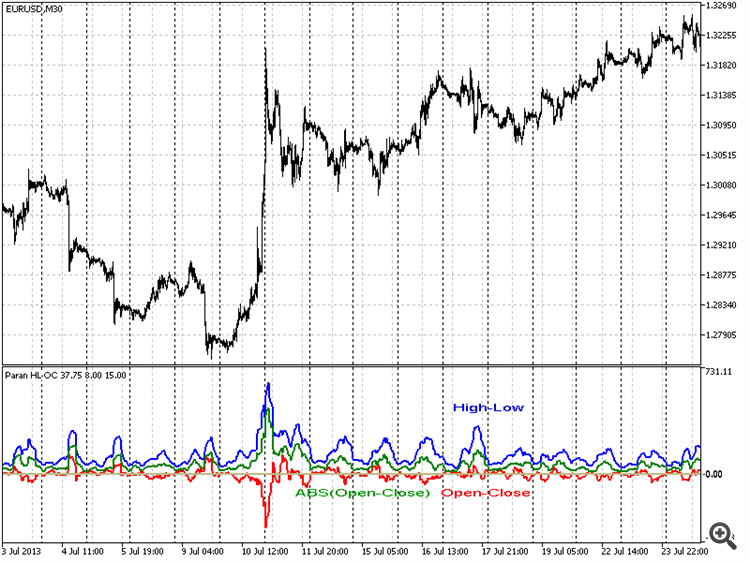
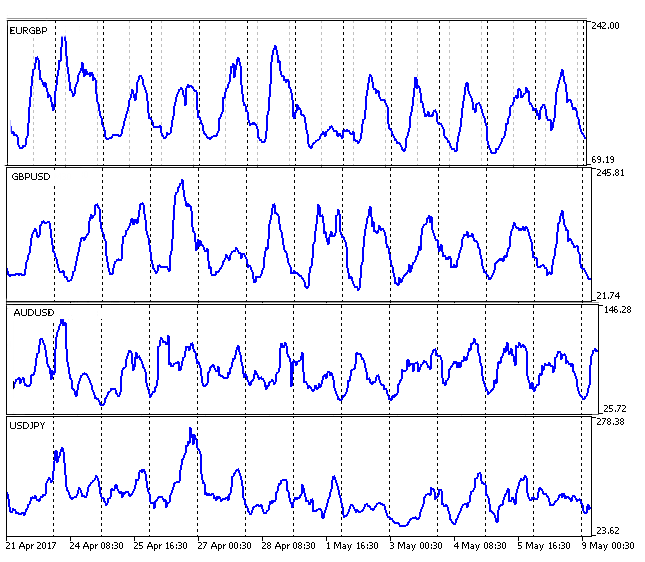
Price changes and trend lines show us that there isn't any permanent pattern for a day or any periods of time. But chart of High and Low differences has a daily oscillation. I drew chart of High minus Low for different currency pairs. I added Open minus Close chart to them to clarify no meaningful pattern in O-C chart at that period of time.
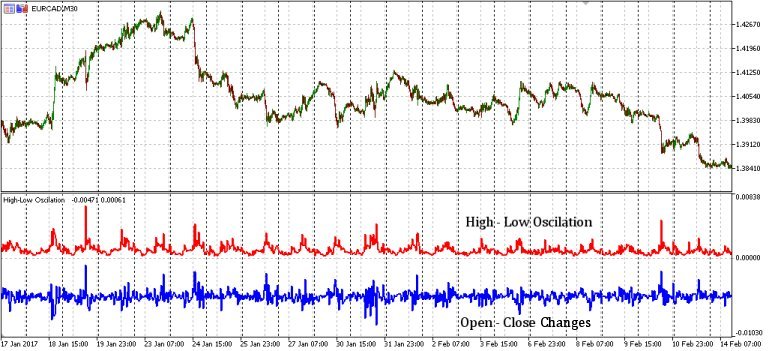
The following picture is H-L and O-C curves for EURCAD. Red for H-L and blue for O-C with -0.001 offset.
To filter ripples I used MA(6) for both curves. The following pictures are some examples of H-L swing. We can see a sinusoid H-L curve, despite of price movement and O-C changes:
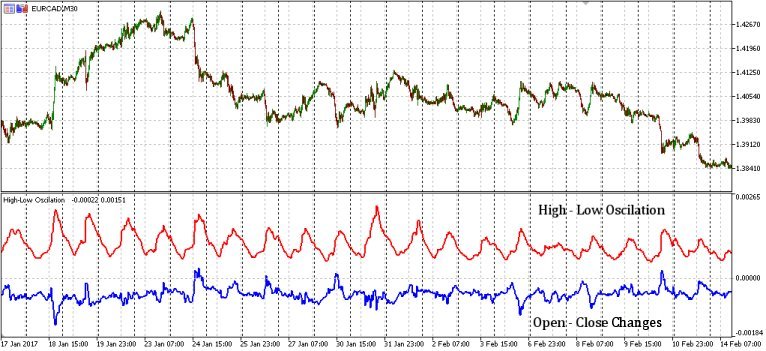
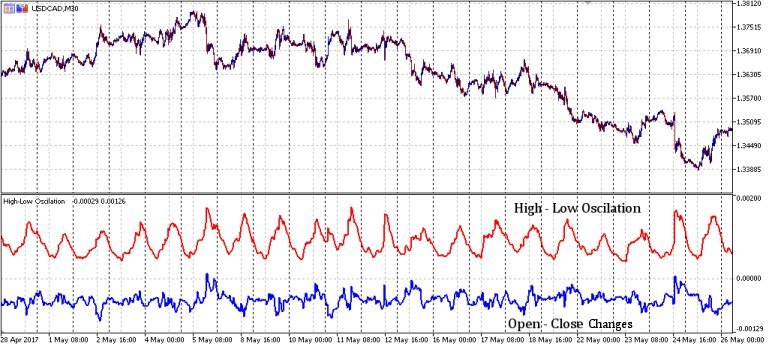
The minimum size of price candle happens at morning and maximum size of it at afternoon (GMT).
