Brent: The Price Failed to Consolidate Above The Level of 50.00. Technical Analysis as of 27.05.2016
Brent: The Price Failed to Consolidate Above The Level of 50.00. Technical Analysis as of 27.05.2016
Review and dynamics
The price of crude oil Brent failed to consolidate above psychologically important level of 50.00 and since the opening of today’s trading day oil price has declined.
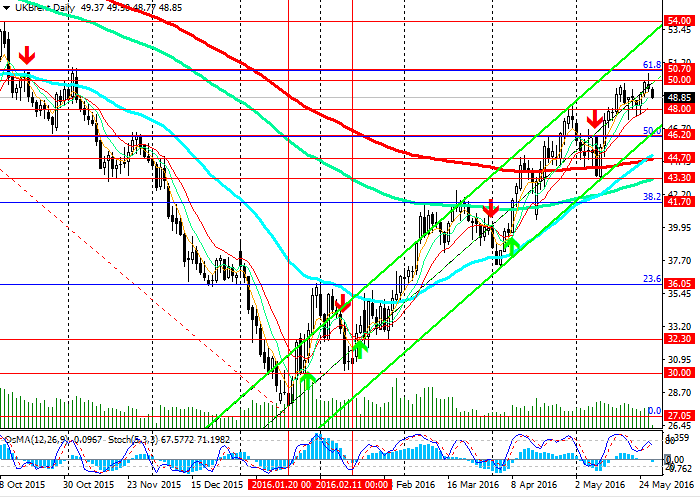
At the beginning of this month the price broke out resistance level of 46.20 (Fibonacci50% to the decline since June 2015 and the level of 65.30 to the lows of 2016 at the level of 27.05) and continued to rise in the ascending channel on the daily chart amid the reduction of the US oil reserves and disruptions in oil supply in the number of the world’s regions.
The upper limit of the ascending channel is between the levels of 50.70 (Fibonacci 61.8%) and 54.00 (lows of August and October 2015).
Our opinion
Meanwhile upward dynamics in the channel continues on the daily chart. If the price consolidates above psychologically important level of 50.00 and in case of breakout of the level of 50.70 (Fibonacci 61.8% and highs of November 2015), the price may go into the range of 50.00 - 54.00.
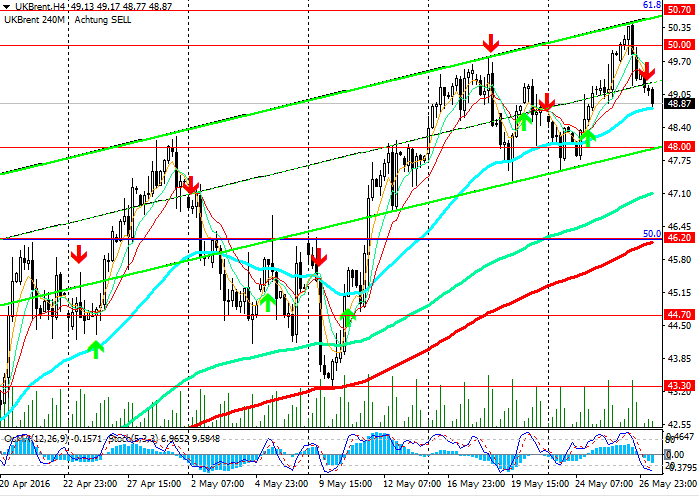
Oil prices are going down today, due to anticipation of the speech by Janet Yellen and profit taking at the end of the trading week. The indicators OsMA and Stochastic also show downward correction, giving sell signals on 4-hour chart. The price may even go back 48.30 (highs of April) and then, continue to grow again.
In case of breakout of support level of 48.00 (lower line of the ascending channel on 4-hour chart) deep correction can follow to the level of 46.20 (Fibonacci 50% to the decline since June 2015 and the level of 65.30 to the lows of 2016 at the level of 27.05, andЕМА50 on the weekly chart and ЕМА200 on 4-hour chart). Later, correction can reach support level of 44.70 (ЕМА200 and the lower line of the ascending channel on the daily chart) and43.30 (ЕМА1444). In case of breakout of the level of 41.70 (Fibonacci 38.2%) and consolidation of the price below this level, the pair may go further down to 36.05 (Fibonacci 23.6%) and 30.00.
Support levels: 48.30, 48.00, 46.20, 44.70, 43.30, 42.50, 41.70, 41.00, 40.00 and 36.05.
Resistance levels: 50.00 and 50.70.
Trading tips
Sell Stop: 48.70. Stop-Loss: 49.10. Take-Profit: 48.30, 48.00, 46.20, 45.00, 44.70, 43.30, 42.50, 41.70, 41.00 and 40.00
Buy Stop: 49.20. Stop-Loss: 48.80. Take-Profit: 50.00 and 50.70.

In the ascending channel

Indicators recommend to SELL


